 Dedicated FREE FOREX VPS
 Free FOREX Virtual Private Server
 MT4 Demo Contest, Get $500
 Sign Up for an Account, Claim 60% Deposit Bonus
 Free MT4/MT5 VPS 2024
 Send E-mail and Get Free Merchandise
 $1K Refer a Friend Bonus for Pepperstone Pro clients
 Maximize Your Earnings with 100% Deposit bonus
 Trade to Win, $5,000 Monthly Demo Contest
 Claim 30% + 15% Deposit Bonus from LiteFinance
20-EMA can be incredibly helpful in finding good entry spots with the pullback trading strategy. Learn the steps and case scenarios in this article.
In trading, the precision of entry and exit positions in the market is very important. The reason is that these two aspects determine the quality of success opportunities (win rate) and what the risk-reward ratio will be.
One effective trading strategy for identifying good entries is the 20-EMA strategy. This strategy can immediately determine good entry points with just two steps: determining the trend and the level, and then entering when a confirmation occurs.
So, how do you apply it during trading? What are the details?
Introduction to 20-EMA Strategy
The 20-EMA strategy is a trading approach that relies on the 20-period Exponential Moving Average (EMA) indicator. This strategy is prized for its simplicity and applicability, making it a valuable tool for traders, especially those who are new to the market.
Applicable across all timeframes, its optimal performance is observed in the M15 timeframe. The strategy involves two steps:
- Plotting the 20 EMA on a price chart and using it to identify trends and key levels in the market.
- When the price retraces or pulls back within a trend, traders observe how it interacts with the 20 EMA.
During a trending market, price pullbacks are usually not as deep, and they often find support or resistance at the 20 EMA. This bounce off the EMA serves as a confirmation of the trend's continuation.
While the strategy is effective in trending markets, it's crucial to avoid using it in sideways or choppy market conditions. This is because the strategy relies on the presence of a clear trend for its effectiveness. Attempting to use it in non-trending markets could lead to unfavorable outcomes.
Steps to Find a Good Entry Spot With 20-EMA
The steps to determine a good entry point using the 20 EMA are relatively straightforward. Begin by identifying the trend, locating support and resistance, and then entering when a pullback occurs to those levels.
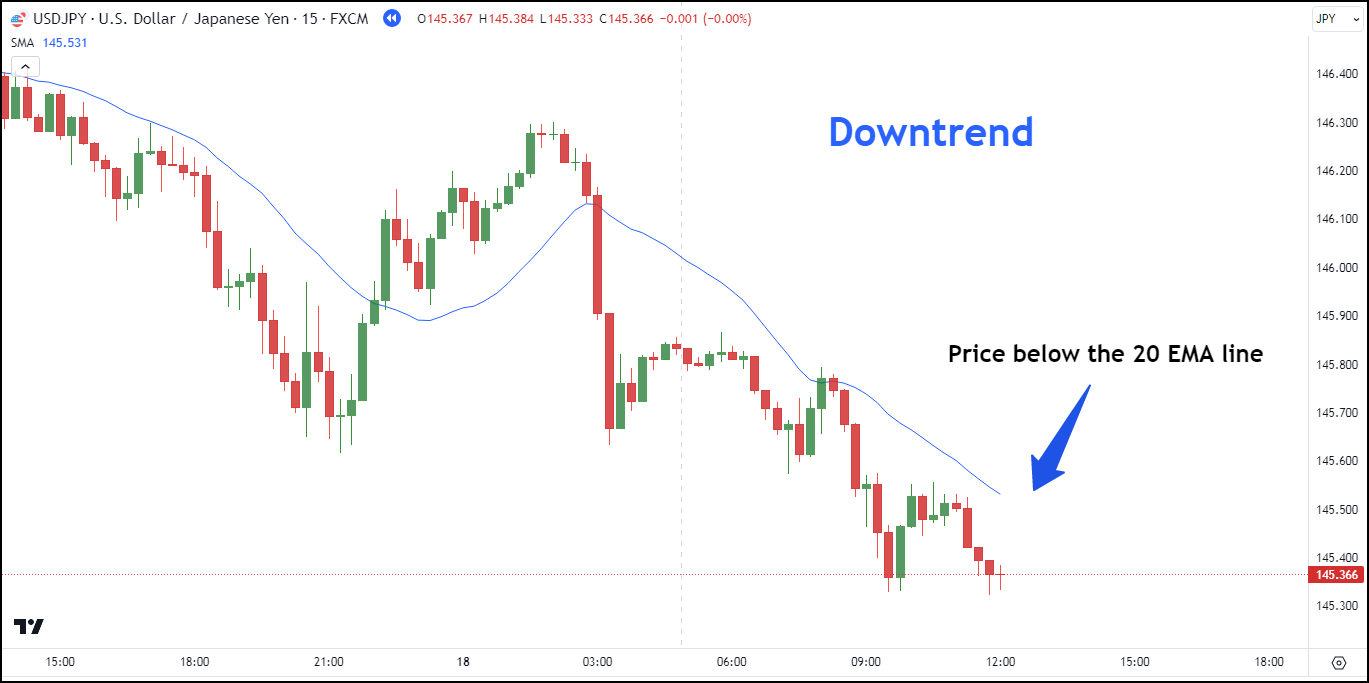
1. Identifying Trends
Identifying a trend using the EMA-20 indicator is a fairly straightforward process. You simply need to observe the EMA line's placement relative to the ongoing price movement.
- If you see the EMA line positioned beneath the current price, this indicates an upward trend.
- Conversely, if the EMA line is above the current price, it signifies a downward trend.
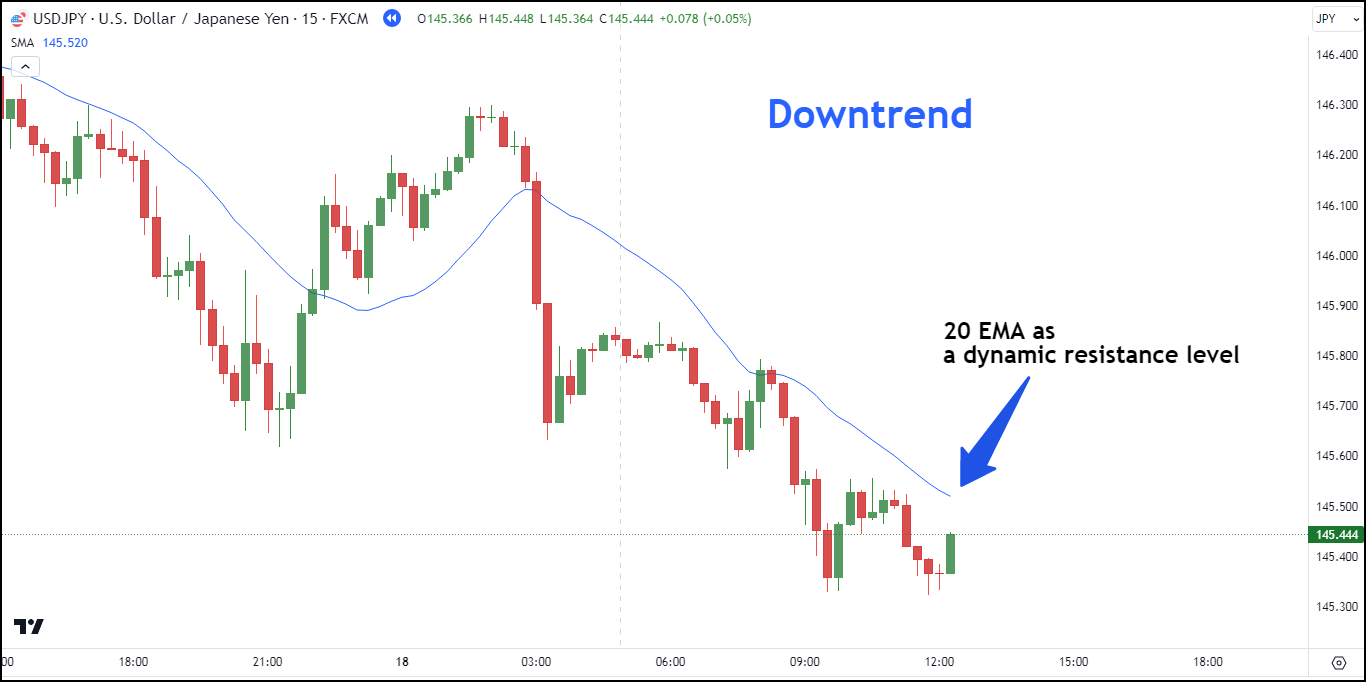
2. Finding Support or Resistance
Once you've determined the prevailing trend, the subsequent action involves identifying significant support or resistance levels. As highlighted earlier, our focus is on dynamic support and resistance derived from the 20 EMA line.
- During a downtrend, the 20 EMA line functions as a resistance level.
- Conversely, in an uptrend scenario, the 20 EMA line assumes the role of a support level.
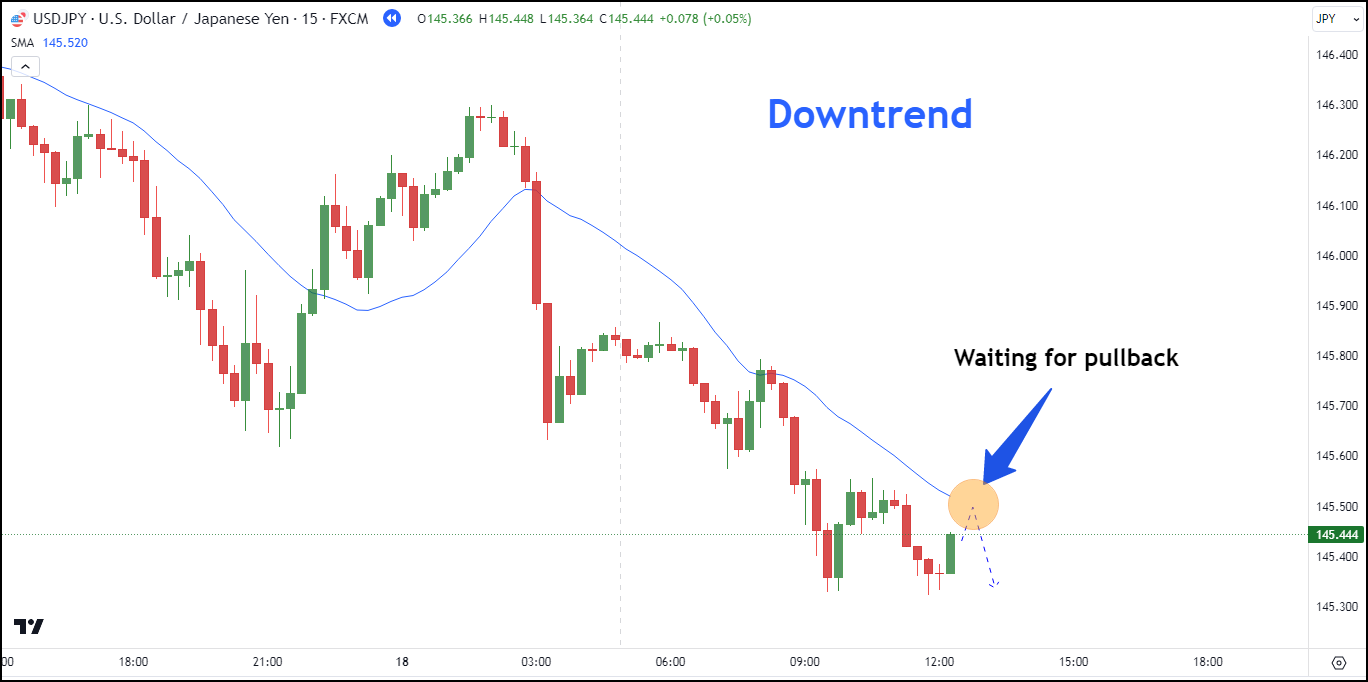
3. Waiting For Pullback
Moving forward, the next action requires patience for the price to pull back to the support or resistance level or the 20 EMA line.
This stage holds importance, and it's something beginner traders frequently neglect. They might assume that once the trend direction is evident, they can initiate a trade right away.
However, in practice, even if the price trend is evident from the trend itself, we still exercise patience for a retracement. This waiting interval is pivotal to optimizing the risk-reward ratio of the trading setup.
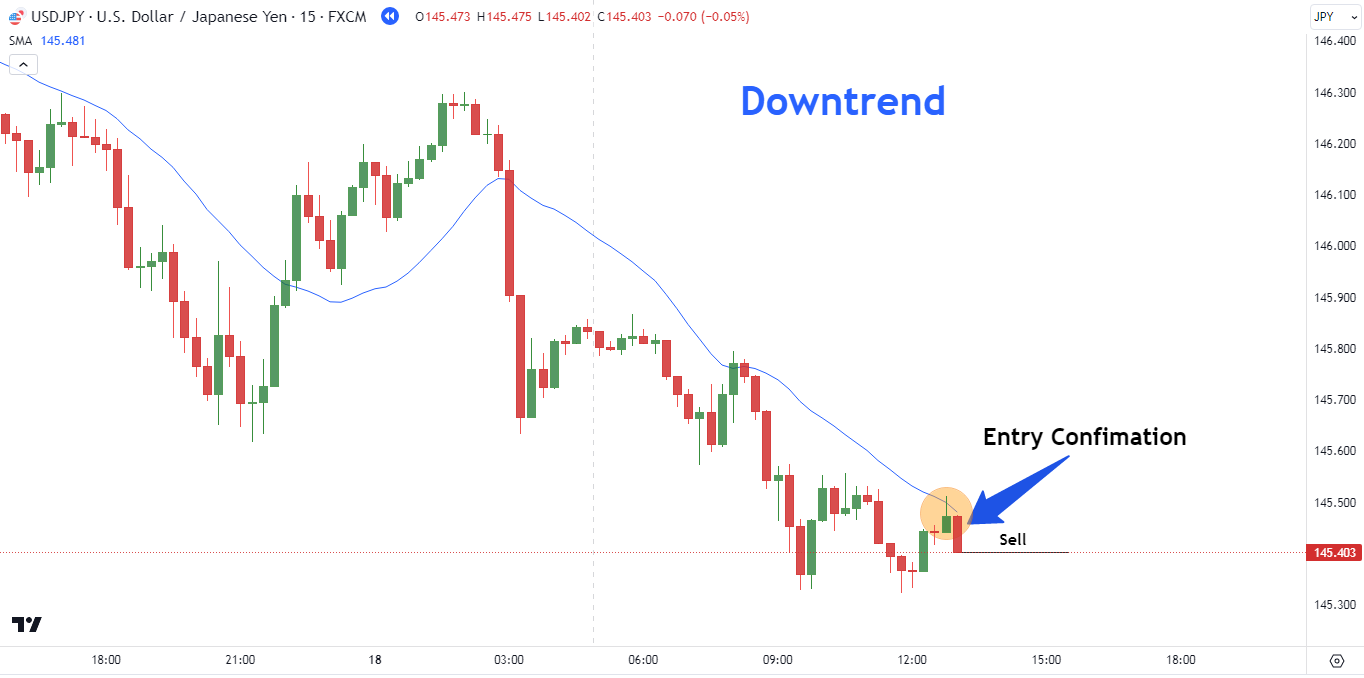
4. Entry Confirmation
There are two ways to confirm an entry: using price action or indicators.
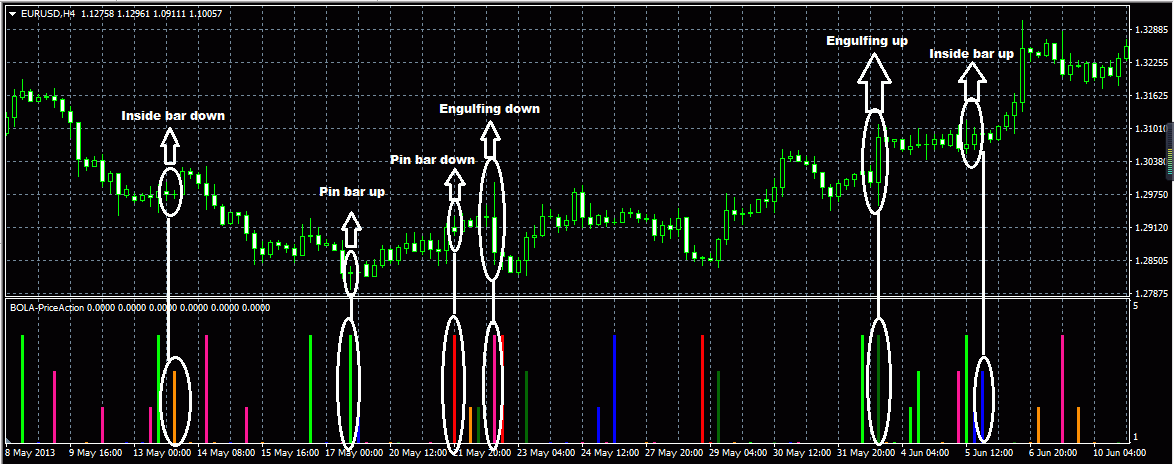
For price action confirmation, you watch for chart or candlestick patterns. Common chart patterns include double top/bottom, head and Shoulders/inverted head and shoulders, triple top/bottom, and more. As for candlestick patterns, popular ones for confirmation include engulfing patterns, pin bars, and inside bars.
On the other hand, using indicators involves tools like stochastic, RSI, MACD, and others.
3 Things to Remember
When employing this trading strategy, it's crucial to direct your focus toward these factors:
- Only enter the market when it's in a trending state.
Entering the market when it's in a clear and established trend can significantly increase the probability of a successful trade. There's a higher likelihood of price continuing in the previous direction, making it conducive for traders to align with the existing momentum. Attempting to trade during non-trending or choppy market conditions can lead to unpredictable price movements and potentially unfavorable outcomes. - Avoid trading against the trend direction.
Trading against the trend, also known as countertrend trading, can be risky. When trading against the trend, traders are essentially betting that the market will reverse its current course, which requires precise timing and strong indicators of a potential reversal. - Enter during active market sessions.
Active sessions often coincide with major market overlaps, such as when both the European and American markets are open. Trading during these sessions can provide better opportunities as volume and price volatility are relatively higher, resulting in tighter bid-ask spreads, reduced slippage, and enhanced executions. Trading during low-activity periods, such as weekends or holidays, may expose traders to wider spreads and reduced liquidity, making it harder to execute trades optimally.
Case Scenarios of Finding Good Entry Spot with 20 EMA
In this case study, I will furnish you with three distinct samples for reference. These samples comprise one buy position and two sell positions, thus presenting a comprehensive overview of the strategy's application in various contexts.
#1 Buy EUR/USD M15
On the EUR/USD M15 chart below, the price is identified to be in an uptrend. The evidence lies in the fact that the price is positioned above the 20 EMA line. Moreover, the price is also seen breaking through the resistance at 1.09900.
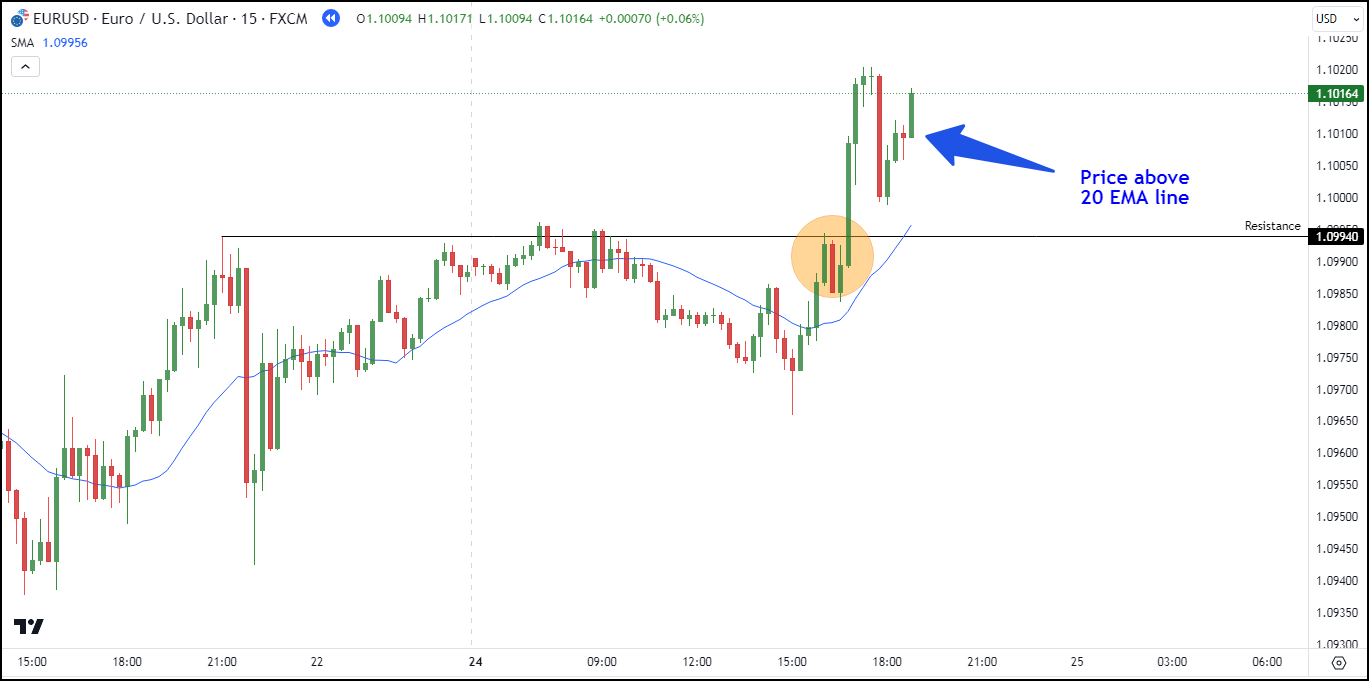
Consequently, we move on to the next step, which involves waiting for the dynamic support level of the 20 EMA line.
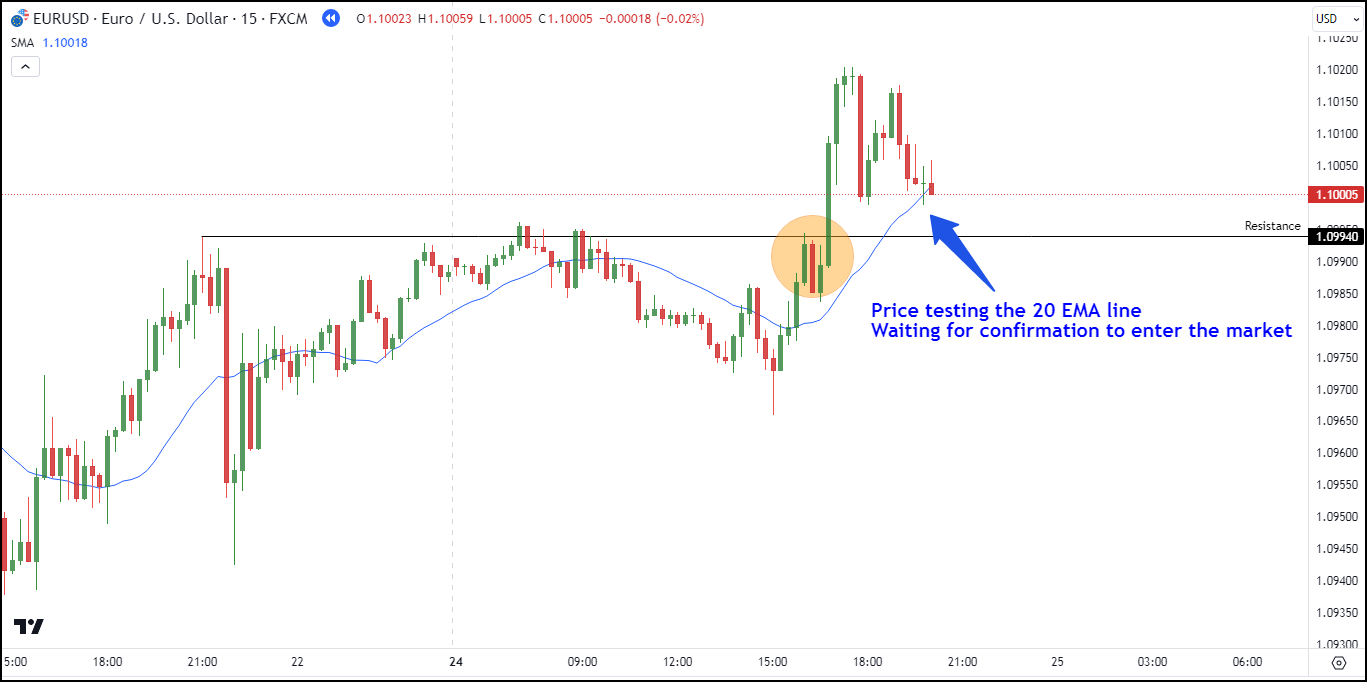
The price observed is testing the support level and forming a doji candlestick. A buy position is entered when there is a reversal candlestick pattern such as a bullish engulfing pattern, a pin bar (with a long lower shadow), or a bullish inside bar.
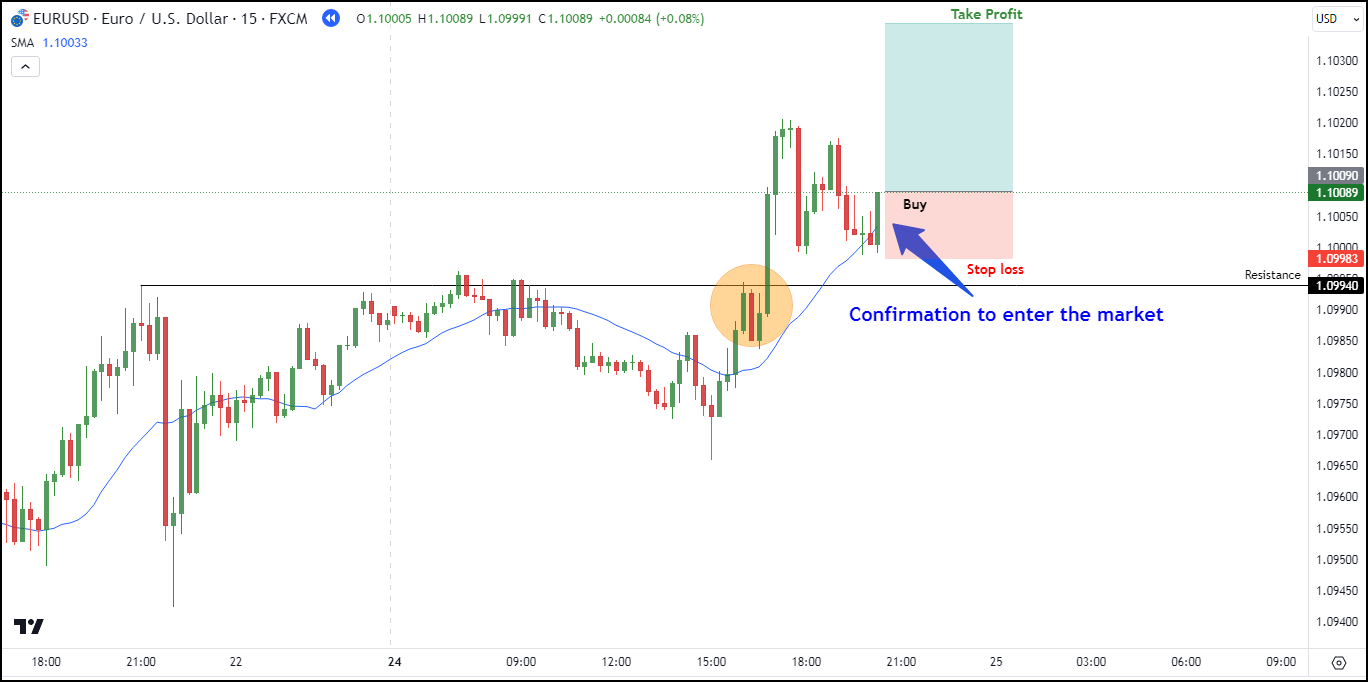
A buy position is initiated due to the formation of a bullish engulfing pattern while testing the support level of the 20 EMA line. The stop loss is placed below the last lowest price, while the take profit is set at the next resistance level.
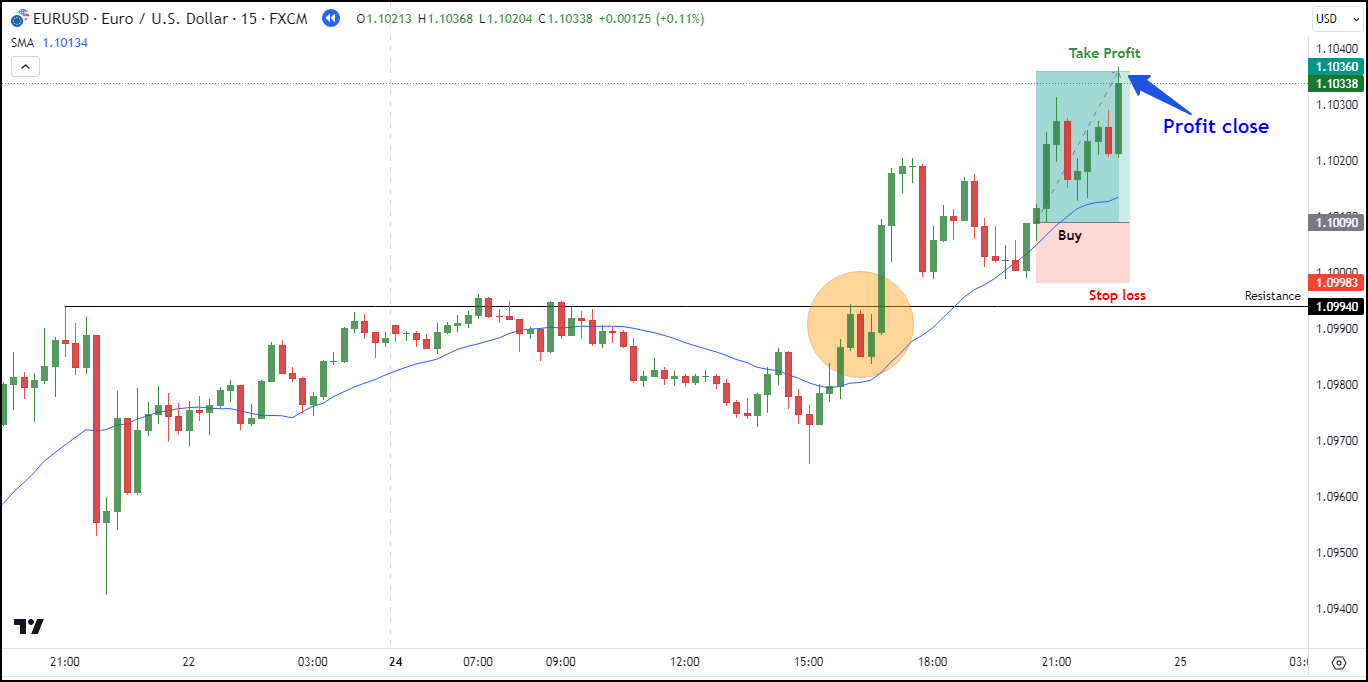
The price continues to rise until it reaches the take profit level. The buy position turns out to be successful.
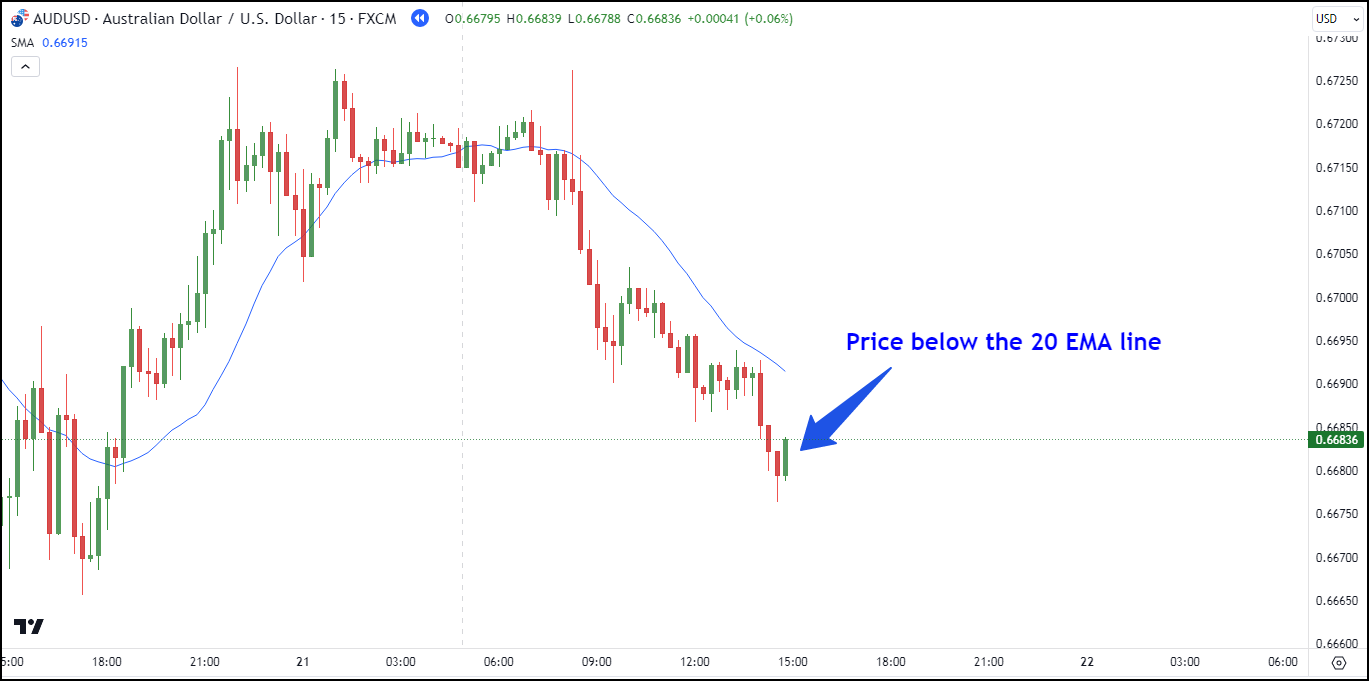
#2 Setup Sell AUD/USD M15
In the following AUD/USD M15 chart, a downtrend is clearly underway. You can observe the price positioned beneath the 20 EMA line.
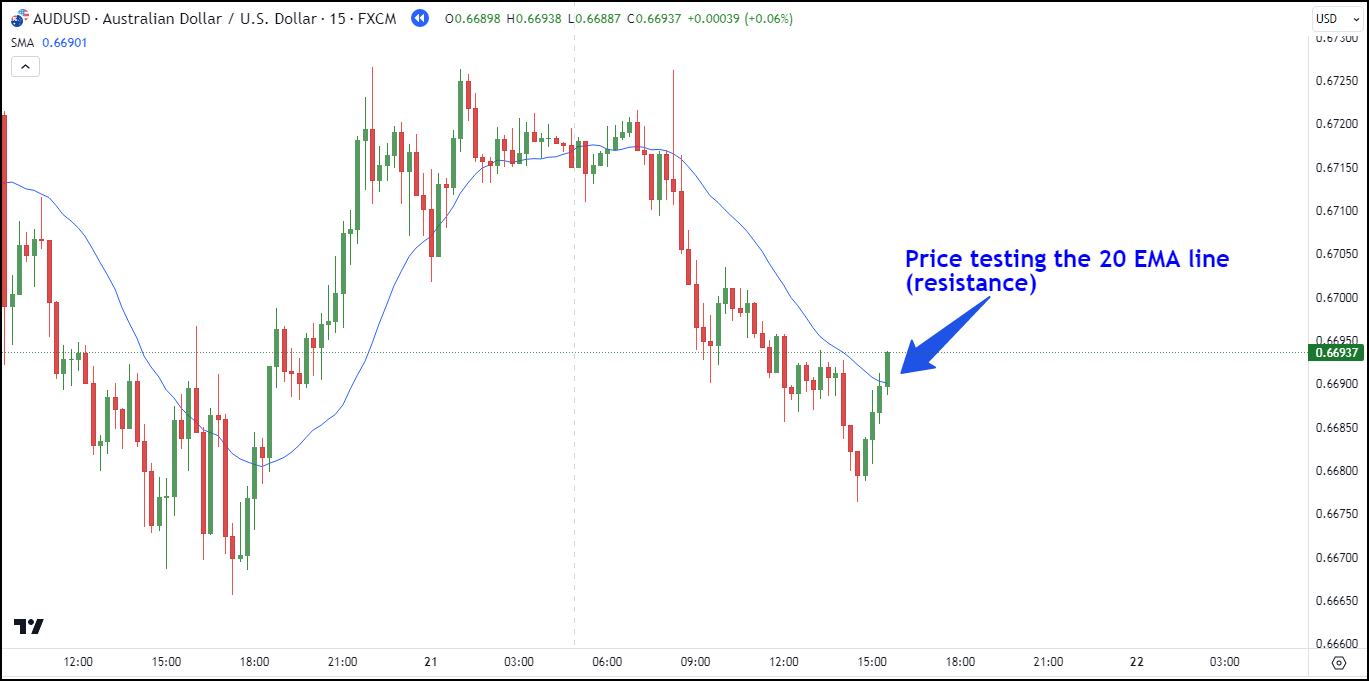
Once the trend is identified, the next step is to patiently await confirmation for entering a sell position as the price tests the 20 EMA's resistance level.
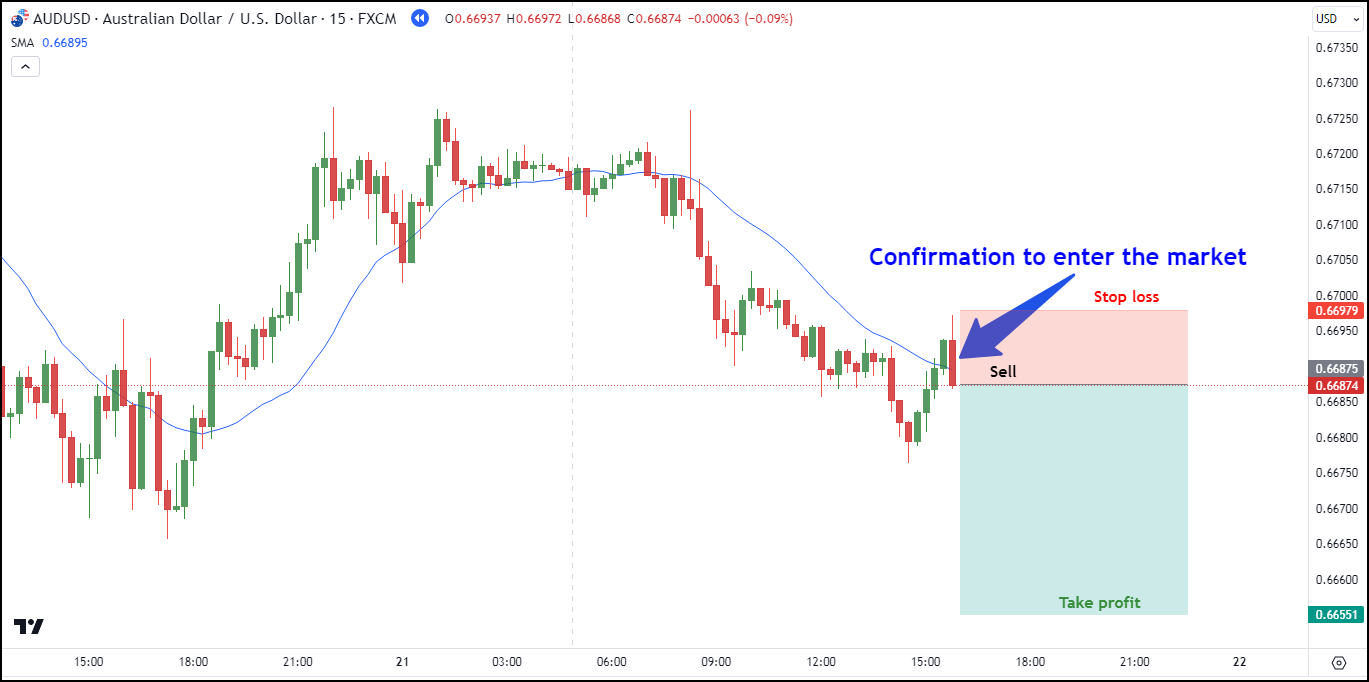
With a valid confirmation in place, the sell position is initiated. A stop loss is positioned just above the highest point of the confirming candlestick, while the take profit is set at the next support level.
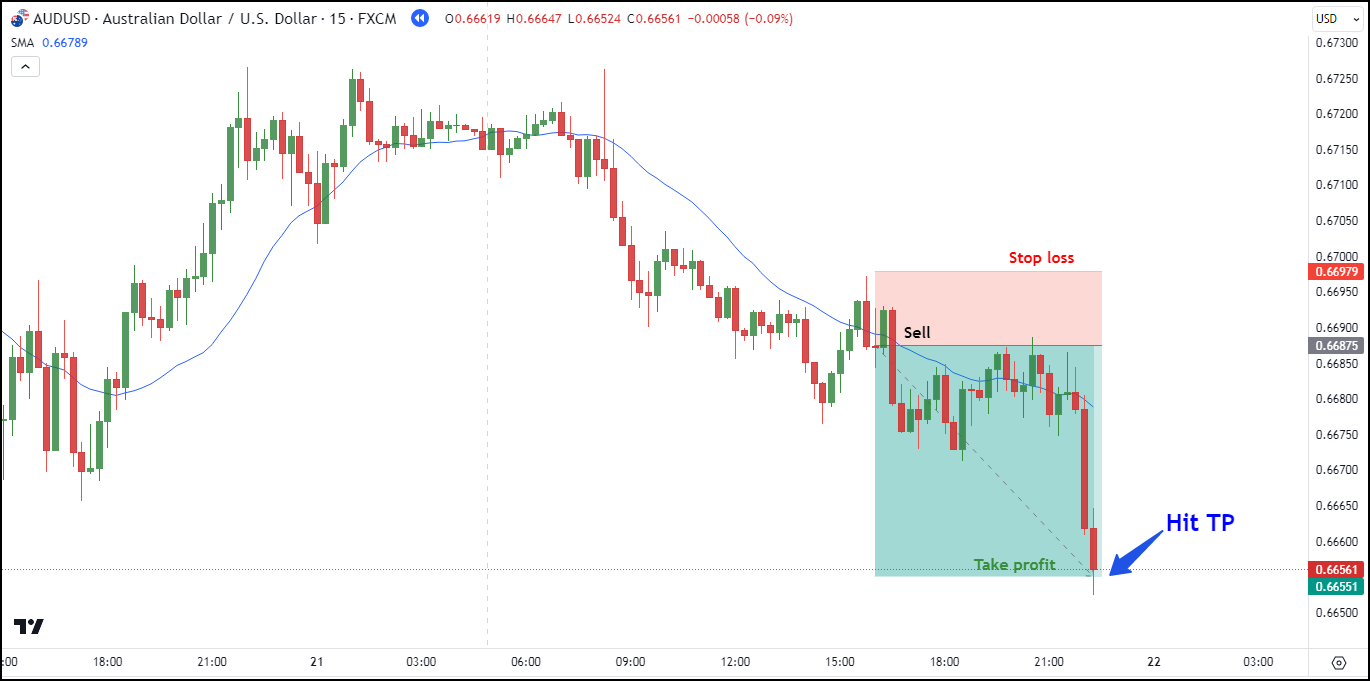
As the price continues its descent, it successfully reaches the designated take profit point. The AUD/USD sell setup turns out to be a success.
#3 Setup Sell GBP/USD M15
In the GBP/USD M15 chart below, the price is observed to be situated beneath the 20 EMA line. This indicates that the price is currently in a downtrend.
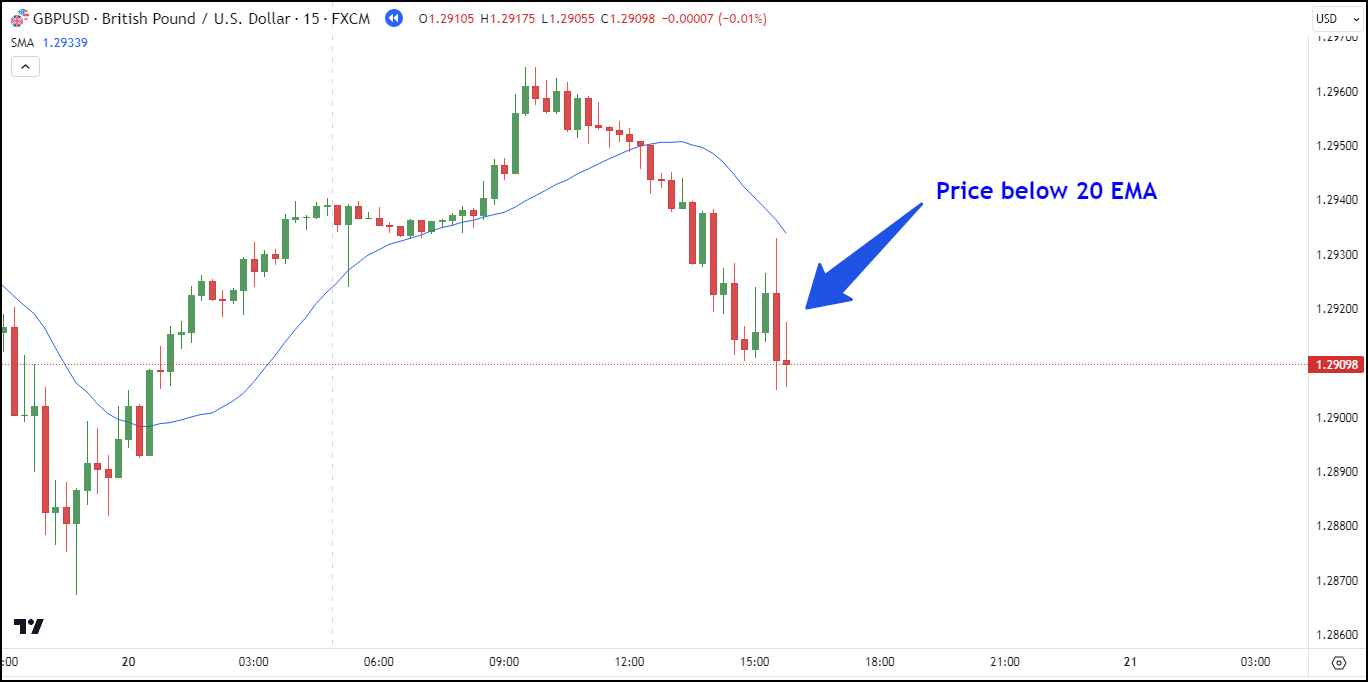
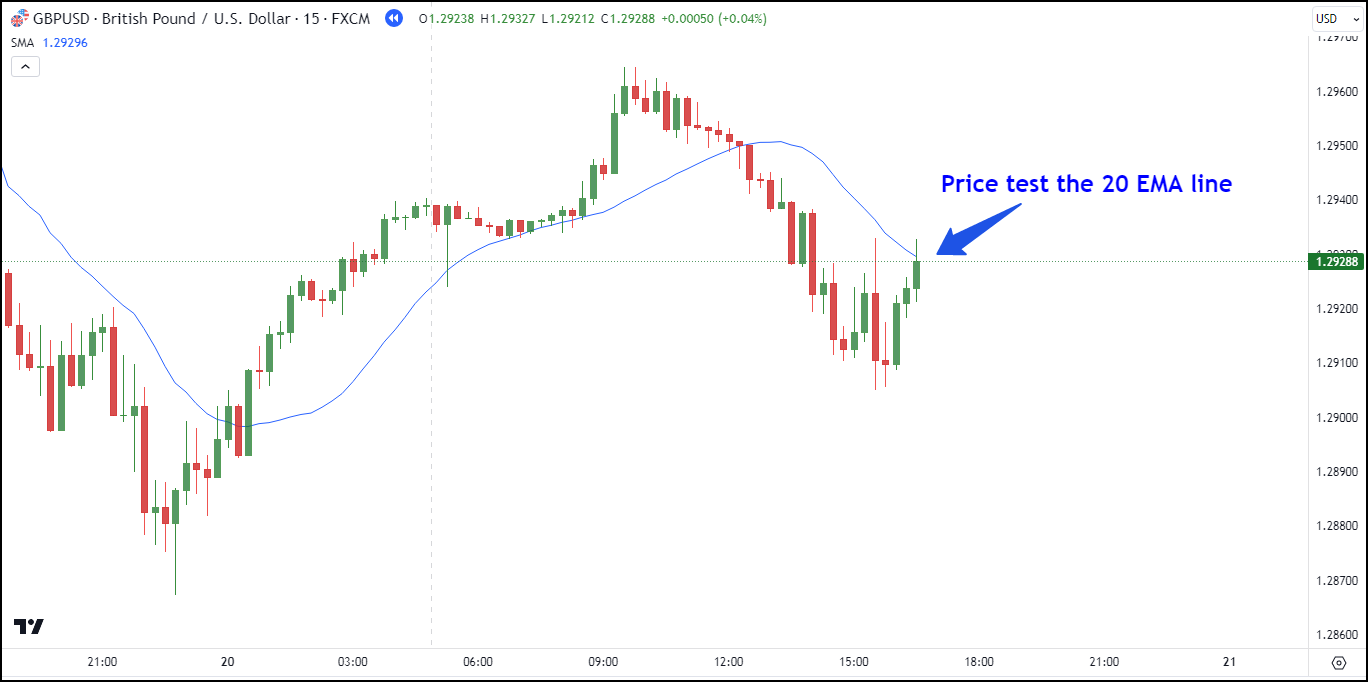
Moving on, our next step involves waiting for a price pullback that tests the resistance level provided by the 20 EMA line. As you can see, the price has touched the 20 EMA line.
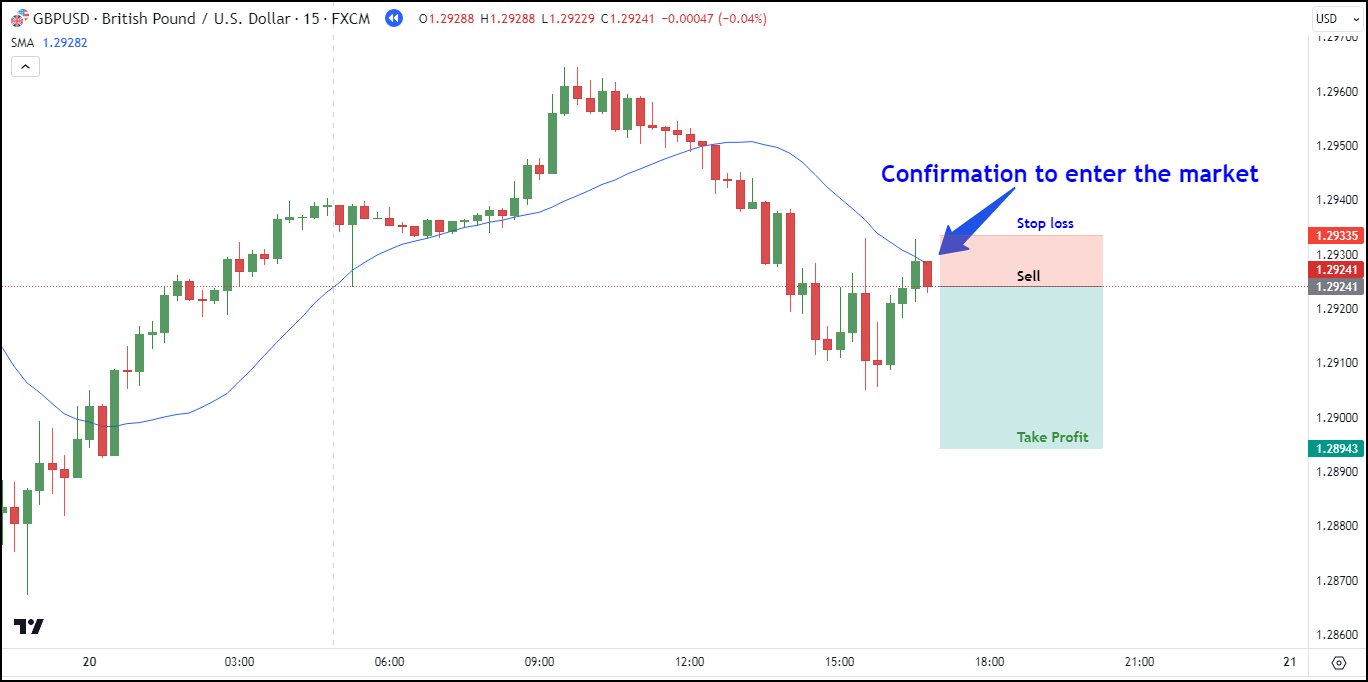
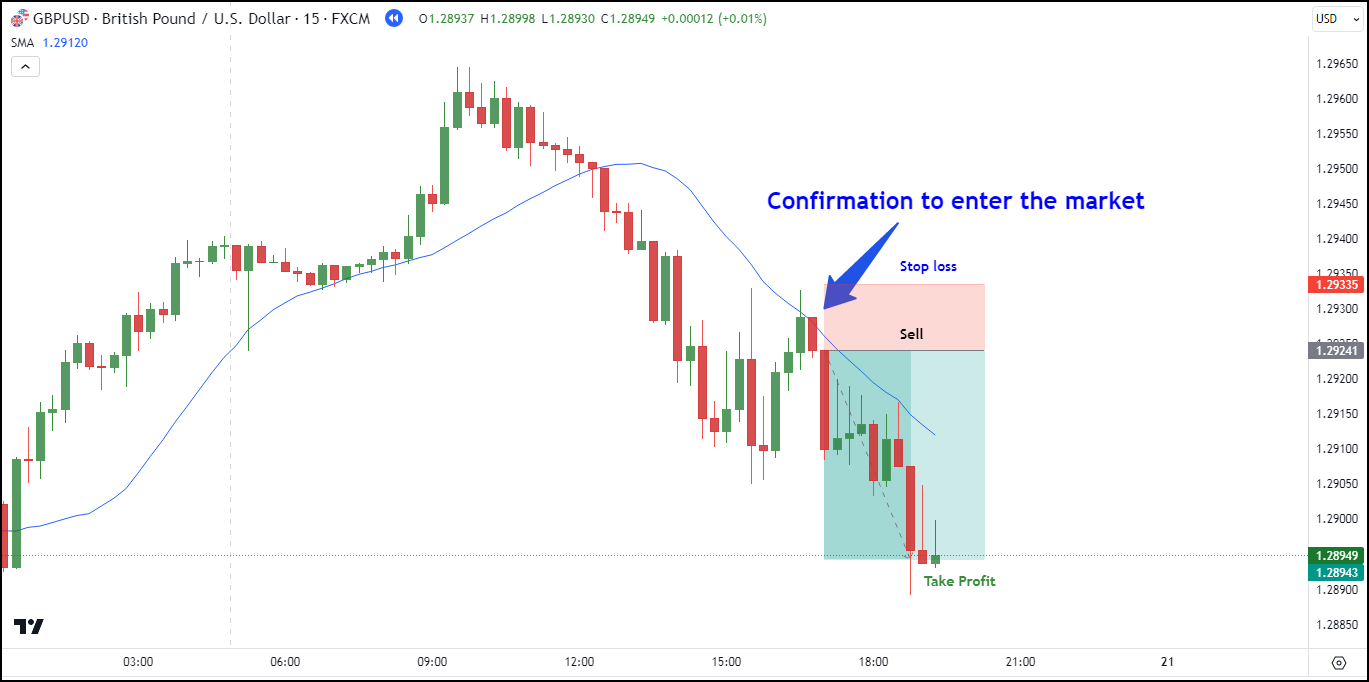
With a valid confirmation now in place, it's time to enter a sell position. The stop loss is positioned above the highest point of the bearish engulfing candle, while the take profit is set at the subsequent support level.
As the price continues its downward trajectory, it successfully reaches the designated take profit point. The GBP/USD sell setup proves to be a successful trade.
Bottom Line
In conclusion, the 20 EMA trading strategy is a powerful tool for identifying good entry points in the market. 20 EMA can help you to identify the trend and the level easily. You just need to wait for a pullback and valid confirmation in the level to enter the market.
After entering a position, don't forget to configure the stop loss and take profit parameters. As shown in the scenarios above, the levels are adjusted to match the prevailing position direction.
If the price is in an uptrend, the stop loss is positioned beneath the lowest point of the confirming candlestick or chart pattern. Regarding take profit, it should be set at the closest resistance level or the subsequent system level. The opposing term is equally valid during a downtrend.
20 EMA is not the only Moving Average to try when it comes to 15-minute chart. In fact, there is also a good MACD trading strategy suitable for that particular time frame.


10 Comments
William
Aug 28 2023
I used to rely on EMA20 as a part of my trading strategy, but I didn't pay much attention to the prevailing trend's direction while making my trades. After reading the article above, I've come to realize the validity of the argument presented. It does seem more logical to let the trend influence my trading decisions.
I have a question stemming from this: Given my reluctance to use candlestick patterns for confirmation, are there any alternative indicators that could be used to confirm my entry points? Thanks for the answer!
David Tristan
Aug 28 2023
There are alternative indicators you can use to confirm your entry points and complement your trading strategy. Since you're now focusing on trading following the trend, using indicators that provide insight into both the trend direction and potential reversals could be beneficial. Here are a few indicators you might consider:
Remember, indicators should not be used in isolation but as part of a larger trading plan. It's always recommended to test and validate any trading strategy using historical data or in a simulated environment before applying it to live trading.
Violet
Aug 28 2023
The discussion is interesting because I also use a 20 EMA, but with periods of 9 and 21. So, I utilize EMA crossovers to identify signals or validate signals.
However, I frequently encounter losses because of false signals. When these false signals arise, I tend to become careless and engage in overtrading, attempting to recoup the losses, which typically results in even greater losses in the end.
The question is, how can I minimize the frequency of being affected by false signals? And what might be a solution if I'm grappling with the psychological impact of these false signals?
David Tristan
Aug 28 2023
Dealing with false signals and the psychological impact they can have is a common challenge for traders. It's important to have strategies in place to both avoid false signals and manage the psychological impact when they do occur. Here are some suggestions:
1. Confirmation Indicators:
Using additional indicators to confirm signals from the 20 EMA can help filter out false signals. This could include indicators like the Relative Strength Index (RSI), Moving Average Convergence Divergence (MACD), or Bollinger Bands. When multiple indicators align, the likelihood of a false signal decreases.
2. Higher Time Frame Analysis:
Analyzing higher time frames, like the 1-hour or 4-hour charts, can provide a broader perspective on the trend. If the higher time frame confirms the direction indicated by your 20 EMA crossover, it can help you filter out false signals and improve the accuracy of your trades.
3. Avoid Overtrading:
Develop a disciplined trading plan that includes a maximum number of trades per day or per week. Overtrading in response to false signals can compound losses and negatively impact your psychological state.
4. Accept Losses as Part of Trading:
Losses, including those from false signals, are an inherent part of trading. It's essential to develop a mindset that views losses as a natural part of the trading process. Focus on the long-term results of your trading strategy rather than getting fixated on individual trades.
5. Practice Patience:
Impatience can lead to overtrading and acting on false signals. Cultivate patience and wait for strong, well-confirmed signals before entering trades.
6. Maintain Risk Management:
Implement proper risk management techniques, such as setting stop losses and position sizing, to help mitigate the impact of false signals on your trading account. This can reduce the risk of overexposing yourself to significant losses.
7. Keep a Trading Journal:
Recording your trades, including reasons for entry and exit, can help you identify patterns in your trading behavior and emotions. Reviewing your journal can provide insights into how you react to false signals and help you develop strategies to manage such situations.
8. Psychological Preparedness:
Accept that false signals are an inevitable part of trading. Develop mental resilience to handle losses and setbacks without letting them affect your overall confidence and decision-making.
9. Take Breaks and Practice Self-Care:
If you find yourself becoming emotionally charged due to false signals, take breaks from trading. Engage in activities that help you relax and refocus. Your mental and emotional well-being are essential for making rational trading decisions.
Gina B.
Aug 28 2023
From what I understand in the text above, the entry method involves using a pullback strategy. This means that when the price moves up or down, one waits for a pullback to test the EMA line. For example, when the price goes up and is above the EMA line, we wait for a price pullback to test the support (EMA line).
Personally, I'm accustomed to using a breakout strategy. It's also a trend-following approach, but I enter trades when there's a break below support or a break above resistance. I'm curious, how would waiting for a breakout using the breakout method be carried out in detail?
David Tristan
Aug 28 2023
Waiting for a breakout using the breakout strategy involves entering trades when there is a break below support or a break above resistance. Here's a detailed step-by-step process for implementing this approach:
Breakout strategies also require patience and discipline. Not every breakout will result in a strong trend, and some might lead to losses. Keep in mind that no trading strategy is 100% accurate, and it's important to practice proper risk management and have a well-defined trading plan to help manage your risk.
Here are some tips for a breakout strategy:
Robert
Aug 28 2023
The explanation provided is quite comprehensive, including step-by-step instructions, examples, and clear details. Additionally, I see that the method involves trend-following with a favorable risk-reward ratio of at least 1:2, which has significant profit potential. This is great.
However, I plan to test it first to gauge its effectiveness over a few months. If the results are positive, then I will proceed to apply it to a real account with a small initial capital. Could you guide me on a fast yet effective backtesting method?
David Tristan
Aug 28 2023
Here's a fast yet effective approach to backtesting your breakout strategy using the EMA20:
1. Gather Historical Data
Obtain historical price data for the trading pair or instrument you want to test. Ensure that you have data for the time frame you plan to trade, such as daily or hourly.
2. Choose a Backtesting Platform
Select a backtesting platform or trading software that enables you to input your strategy rules and test them against historical data. Some popular options include MetaTrader, TradingView, and specialized backtesting software.
3. Define Strategy Rules
Based on the breakout strategy you've outlined, clearly define the entry, stop loss, and take profit rules. For instance, specify how you'll identify breakouts, where you'll set your stop loss, and where you'll set your take profit.
4. Set Up Charts
Load the historical price data into the backtesting platform and plot the EMA20 on the chart. Mark the support and resistance levels that you intend to use for your breakout strategy.
5. Start Backtesting
Utilize the backtesting platform's features to manually simulate your strategy on historical data. This entails going through each candle and identifying trade opportunities according to your defined rules.
6. Record Trades and Results
As you progress through the historical data, document the entry point, exit point, stop loss, take profit, and outcome (profit or loss) for each trade. This will aid in evaluating the strategy's performance.
7. Calculate Key Metrics
Upon completing the backtesting for your chosen period (as you mentioned, a few months), compute essential metrics, including:
- Total number of trades taken.
- Win rate (percentage of winning trades).
- Average profit per trade.
- Average loss per trade.
- Risk-to-reward ratio.
- Expectancy value.
8. Analyze Results
Analyze the metrics to assess the strategy's performance. Pay close attention to the win rate, risk-to-reward ratio, and overall profit/loss. Consider how the strategy performed under various market conditions.
9. Adjust and Refine
If the results do not meet your expectations, contemplate adjusting your strategy rules or parameters and repeating the backtesting process. This iterative approach can assist you in refining the strategy for improved performance.
10. Consider Out-of-Sample Testing
To further validate your strategy, contemplate conducting out-of-sample testing. This involves evaluating your refined strategy using a separate set of historical data that was not used during the initial backtesting phase. This helps assess if the strategy can perform well on unseen data and reduces the risk of over-optimization.
11. Test on Demo Account
Once you are content with the backtesting results, implement the strategy on a demo account to evaluate its performance in real-time under real-market conditions.
James
Aug 28 2023
I tried out the strategy on my account, but it's still yielding negative results. The instructions seemed straightforward as I read through them. The steps were clear, and they even included illustrative examples demonstrating how to spot trends and confirm them at specific levels. However, when it came to implementing these instructions in the live market, it proved to be more challenging than anticipated.
One of the difficulties I encountered was the fluctuation of prices after entering a trade. For instance, even if things began with a bit of profit, the price often reversed to its original point. This kind of situation can be quite disheartening. Additionally, there were instances where, after entering a trade and waiting for a while, sometimes just an hour or two, it hit the stop loss. Coping with such situations can take a toll on one's mental state. Could you kindly offer some advice on how to approach trading with a calmer mindset?
David Tristan
Aug 28 2023
I'm sorry to hear that you've been experiencing challenges and frustrations with your trading. Maintaining a calm and disciplined mindset is crucial for successful trading, especially during periods of volatility and uncertainty. Here are some tips to help you approach trading with a calmer mindset:
Understand that trading involves risks, and not every trade will be profitable. Set realistic expectations and avoid putting too much pressure on yourself to always achieve positive results. Accept that losses are a part of the trading process and focus on long-term profitability.
Create a well-defined trading plan that outlines your strategy, risk management rules, and goals. Having a plan in place can provide a sense of structure and help you make objective decisions based on predetermined criteria rather than emotions.
Implement strict risk management techniques. Set a maximum percentage of your trading capital that you're willing to risk on each trade. This helps protect your capital from significant losses.
If you're feeling disheartened by losses, consider going back to practicing on a demo account. This will allow you to refine your strategy, gain more confidence, and reduce emotional pressure.
When you're learning and adjusting your approach, consider trading smaller positions. This reduces the emotional impact of losses and allows you to focus on learning and improving.
Shift your focus from the immediate outcome of each trade to the process itself. Evaluate trades based on how well you executed your strategy rather than whether it resulted in a profit or loss.
Cultivate patience in your trading. Avoid chasing after quick profits or trying to recover losses too quickly. Wait for strong, well-confirmed setups.
If you find yourself getting frustrated or anxious, take a step back. Take breaks from trading to clear your mind and return with a fresh perspective.
Every loss is an opportunity to learn and improve. Instead of dwelling on losses, focus on analyzing what went wrong and how you can avoid similar mistakes in the future.
Keep a trading journal to document your trades, emotions, and thoughts. Reviewing your journal can provide insights into patterns in your trading behavior and help you make more informed decisions.
If the emotional toll of trading is significantly affecting your well-being, consider seeking guidance from a trading coach, mentor, or therapist who can help you manage your emotions and develop coping strategies.
Read: 7 Key Trading Principles Before Entry