 Dedicated FREE FOREX VPS
 Free FOREX Virtual Private Server
 MT4 Demo Contest, Get $500
 Sign Up for an Account, Claim 60% Deposit Bonus
 Free MT4/MT5 VPS 2024
 Send E-mail and Get Free Merchandise
 $1K Refer a Friend Bonus for Pepperstone Pro clients
 Maximize Your Earnings with 100% Deposit bonus
 Trade to Win, $5,000 Monthly Demo Contest
 Claim 30% + 15% Deposit Bonus from LiteFinance
The triple bottom pattern claimed an accuracy rate of more than 70%. It happens at the end of the downtrend and signs a bullish reversal.
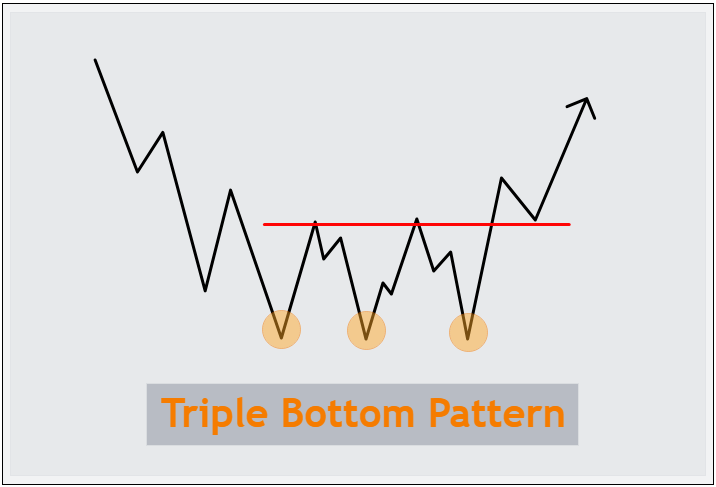
The triple bottom pattern is a reversal pattern made up of three nearly parallel low points. It usually shows up at the end of a downward trend.
One notable feature of this pattern is its three lows, each of which looks like the letter "V". It is often considered a reliable technical pattern by traders.
According to Thomas Bulkowski's "Encyclopedia of Chart Patterns," this pattern has proven to be accurate about 74% of the time in bullish stock markets.
Contents
How to Identify Triple Bottom Pattern?
The triple bottom pattern tells you that the price may have reached a bottom, and there is potential for a trend reversal from bearish to bullish. Here's how to spot a triple bottom pattern:
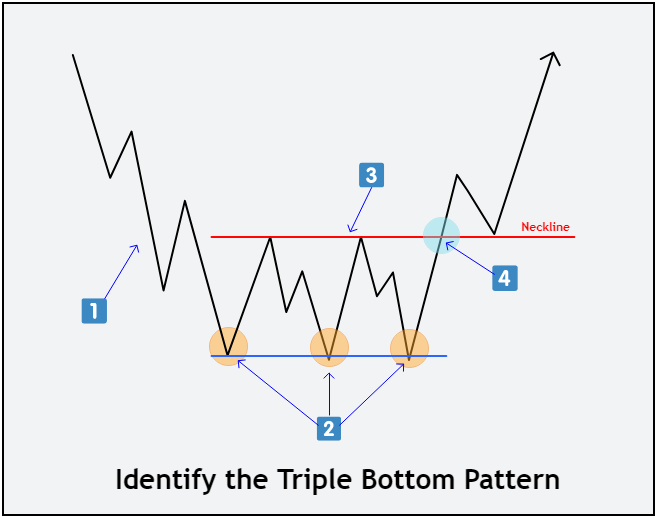
- Start by looking for a downtrend as the first sign before the triple bottom forms. Look for a series of lower highs and lower lows on the chart. The price declined due to sellers dominating the market.
- Check if you have three low points that are almost in a straight line. These low points should appear relatively equal and each low form a pattern that resembles the letter "V". It tells that sellers attempt to push the price lower 3x but they fail to do so each time, indicating weaker selling pressure and stronger buying interest.
- Draw a line connecting the two highest points between those three lows; this is called the neckline. The neckline acts as a crucial resistance that the price needs to break for the pattern to be valid.
- Confirm the triple bottom pattern when the price breaks above this neckline. It's a signal that buyers are gaining strength and that the previous downtrend may be coming to an end.
How to Trade Triple Bottom Pattern?
There are two ways to trade the triple bottom pattern. These methods are the breakout method and the pullback method.
Breakout Method
In the breakout method, you enter a buy position right after the price breaks above the triple bottom pattern's neckline. For the stop loss, you can either use the previous low or select the closest low on a smaller time frame.
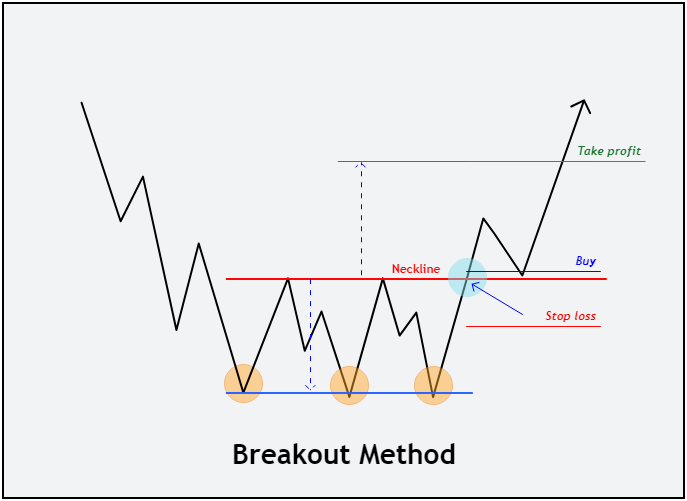
As for the profit target, we estimate it based on the distance between the pattern's high and low.
Pullback Method
With the pullback method, you don't jump into a trade right after a breakout. Instead, you enter when the price retraces to the support level that was previously acting as resistance.

For the stop loss, you can position it at the previous low. The take profit could be determined by the triple bottom pattern's range.
Case Study
To help you grasp this better, we'll give you two examples of trading with the triple bottom pattern. One using the breakout method, and the other with the pullback method.
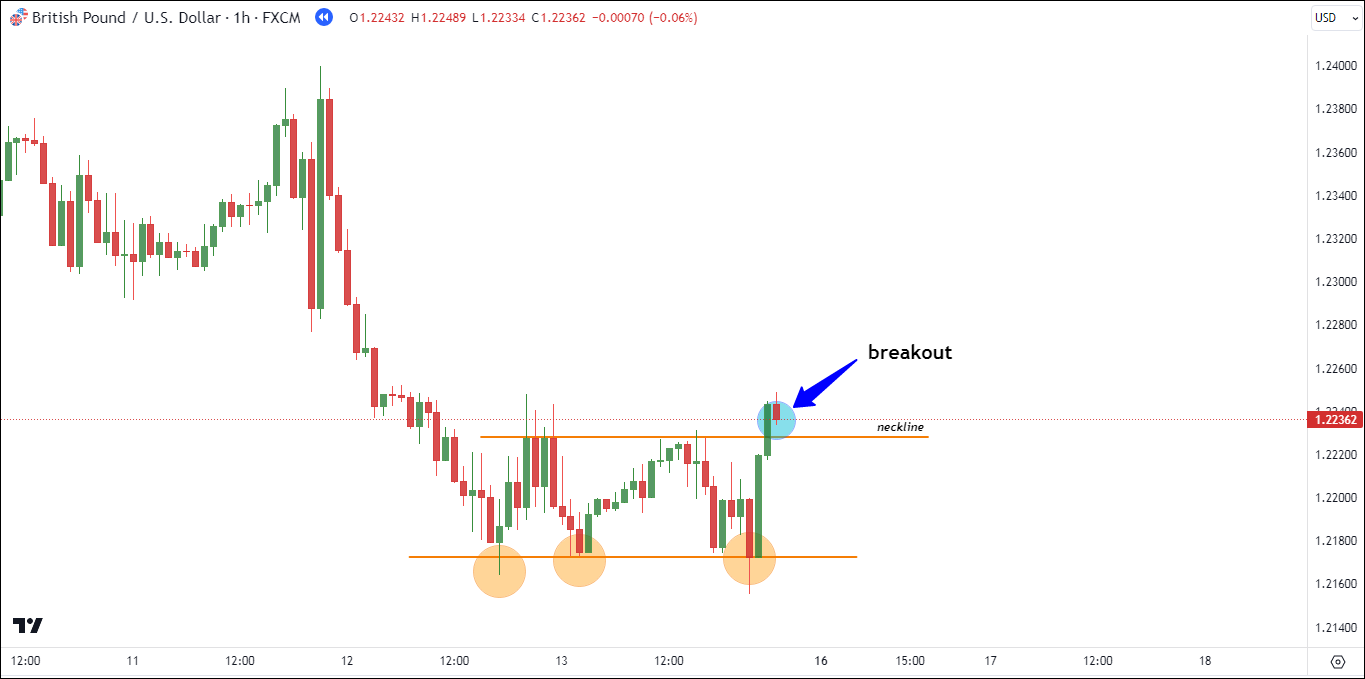
#1 GBP/USD - Breakout Strategy
In the H1 GBP/USD chart below, you can spot a triple bottom pattern forming in the price. To enter a buy position, we wait for confirmation from the price when it successfully breaks through the resistance or the neckline line.
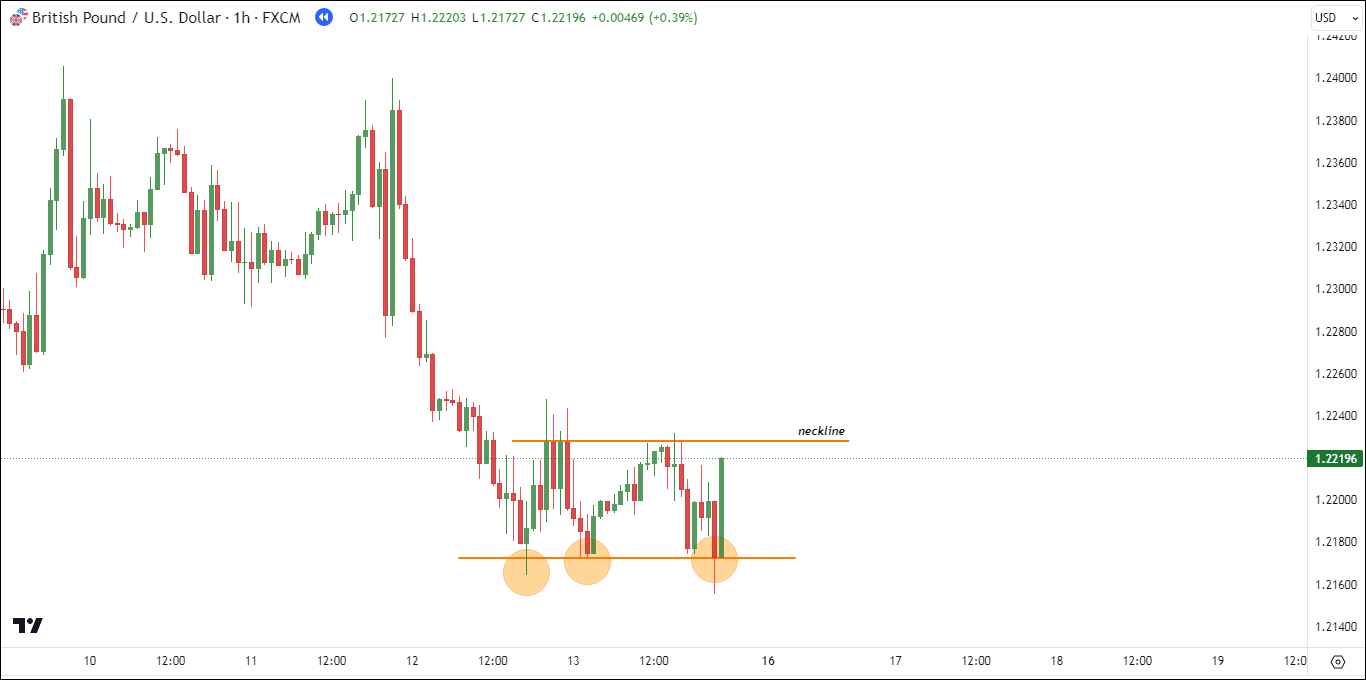
Once the price breaks above the neckline, it confirms the triple bottom pattern. It's likely that the overall trend has shifted upwards.
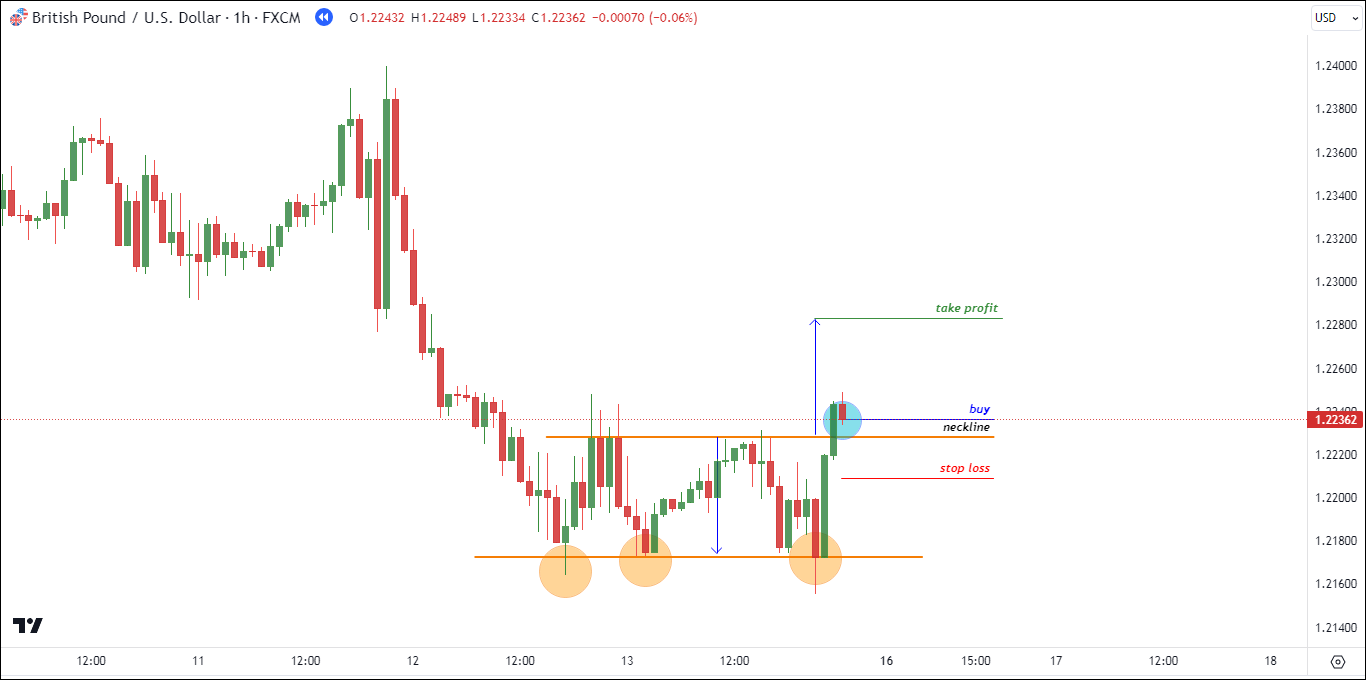
We enter a buy position at the price of 1.22364, with a stop loss set at 1.22091 (27.3 pips). Our take profit level is set at 1.22833 (46.9 pips).
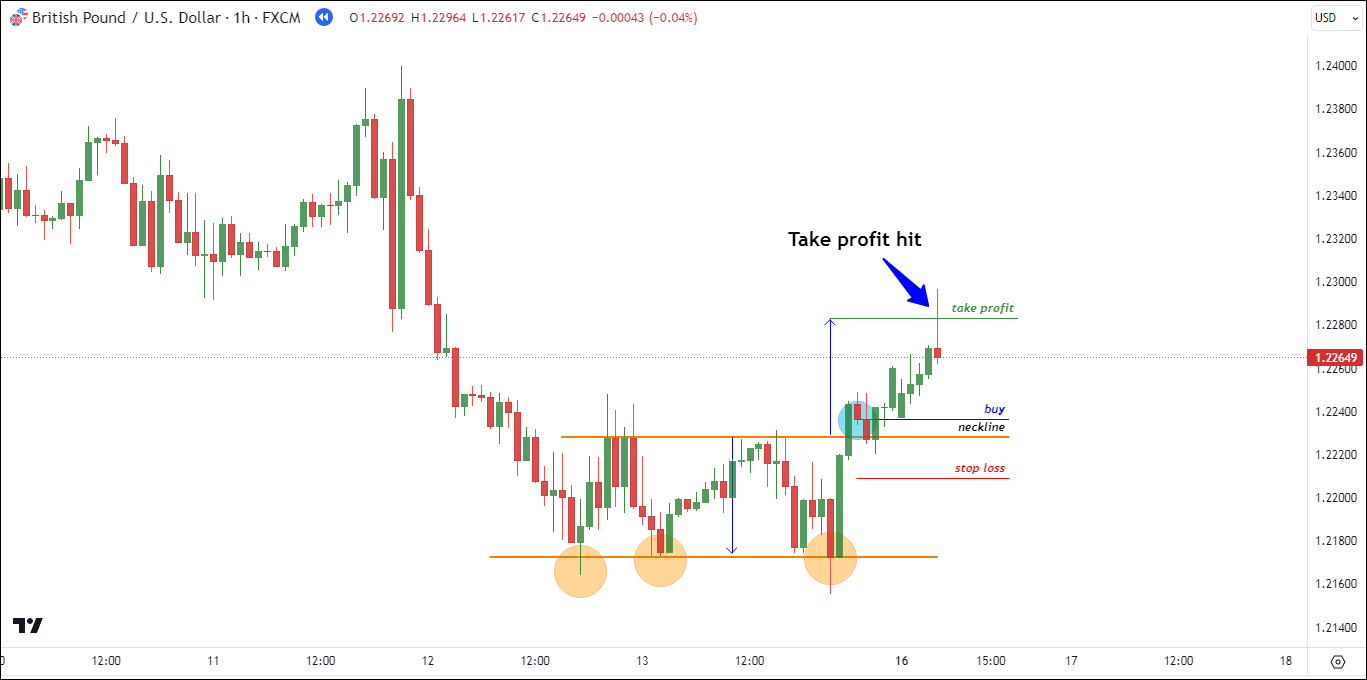
The price keeps going up until it hits the take profit level at 1.22833 (+46.9 pips). So, our buy setup for GBP/USD works out well.
#2 USD/JPY - Pullback Strategy
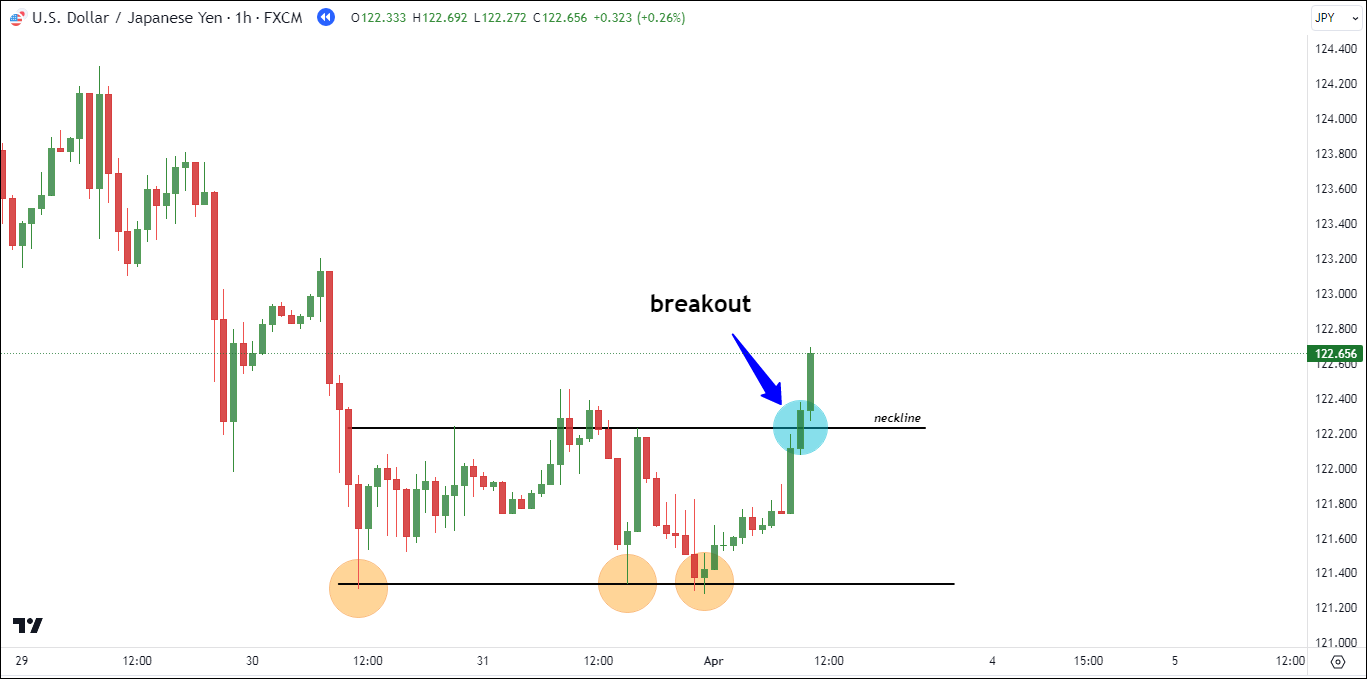
In the USD/JPY H1 chart below, you can see that the price has formed three low points. We draw a horizontal line, like a resistance line, to mark the neckline. Then, we wait for the price to go up to confirm.
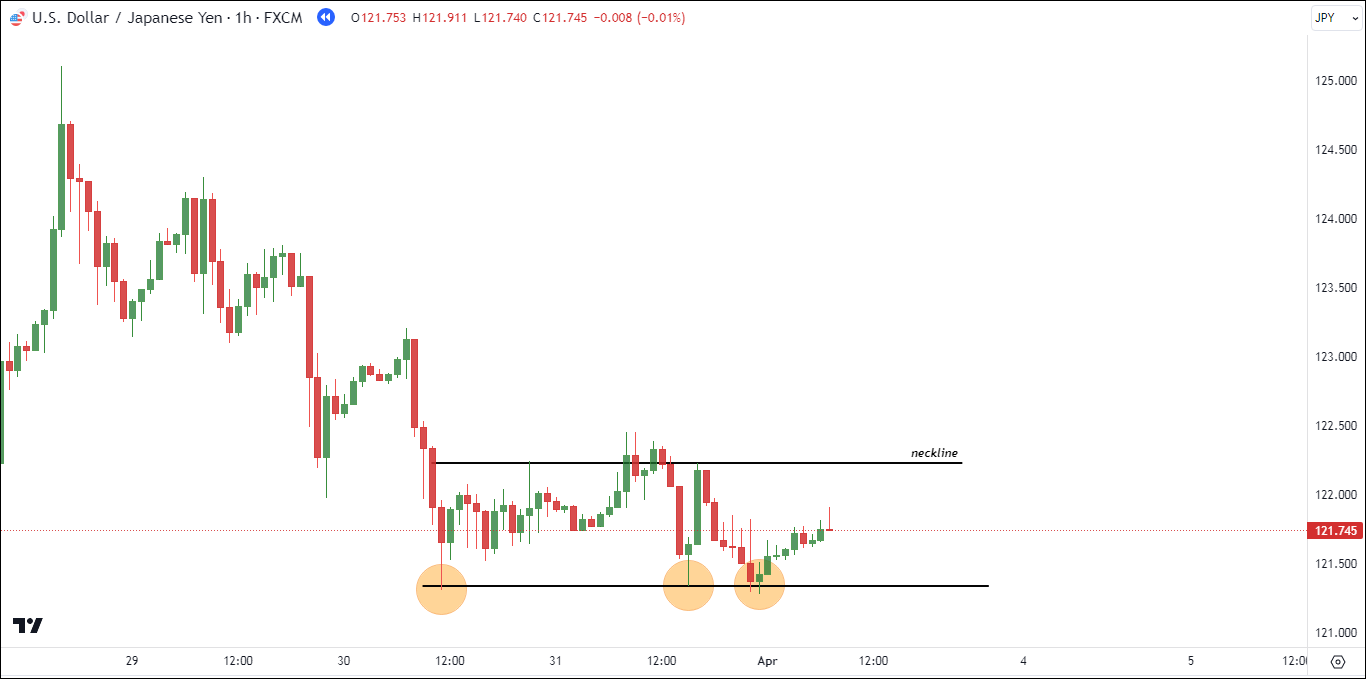
The price keeps going up and successfully breaks through the resistance level or neckline. This means the triple bottom pattern is now confirmed.
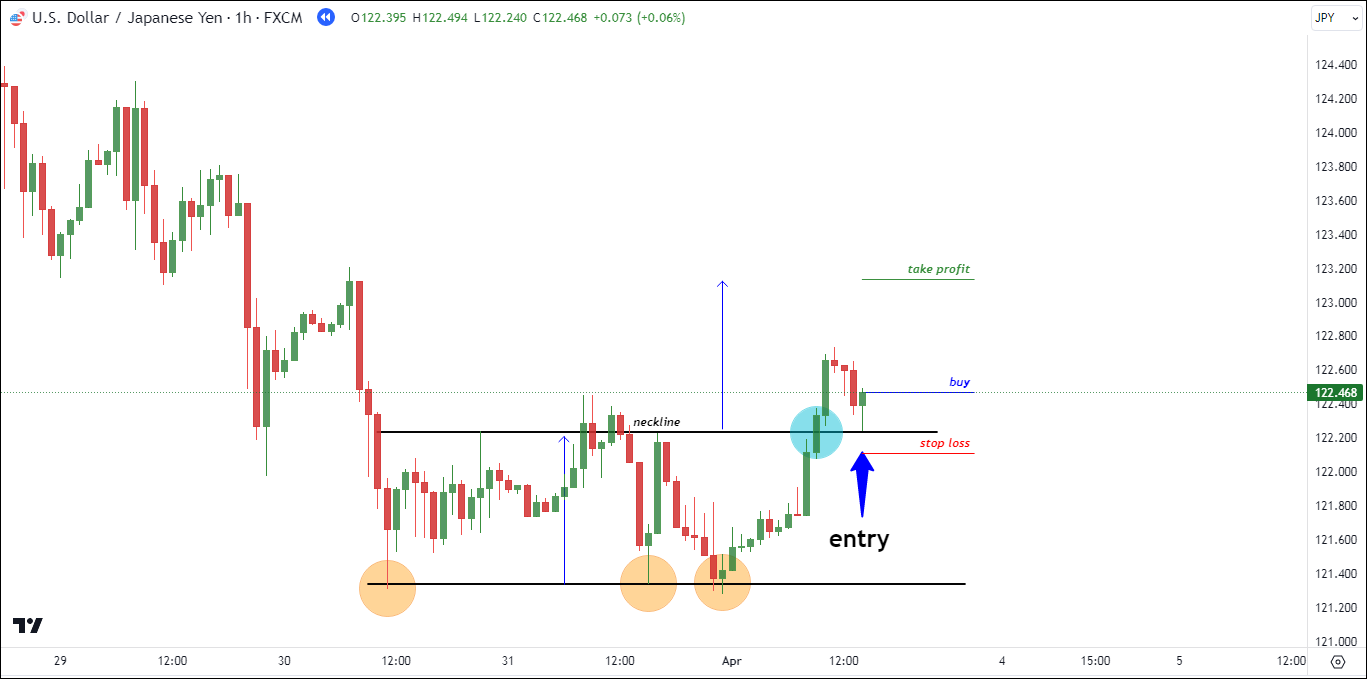
Since the pattern is confirmed, we enter a buy position when the price falls back to the neckline. We buy at a price of 122.464 with a stop loss at 122.121 (34.3 pips). The take profit level is set at 123.134 (67.0 pips).
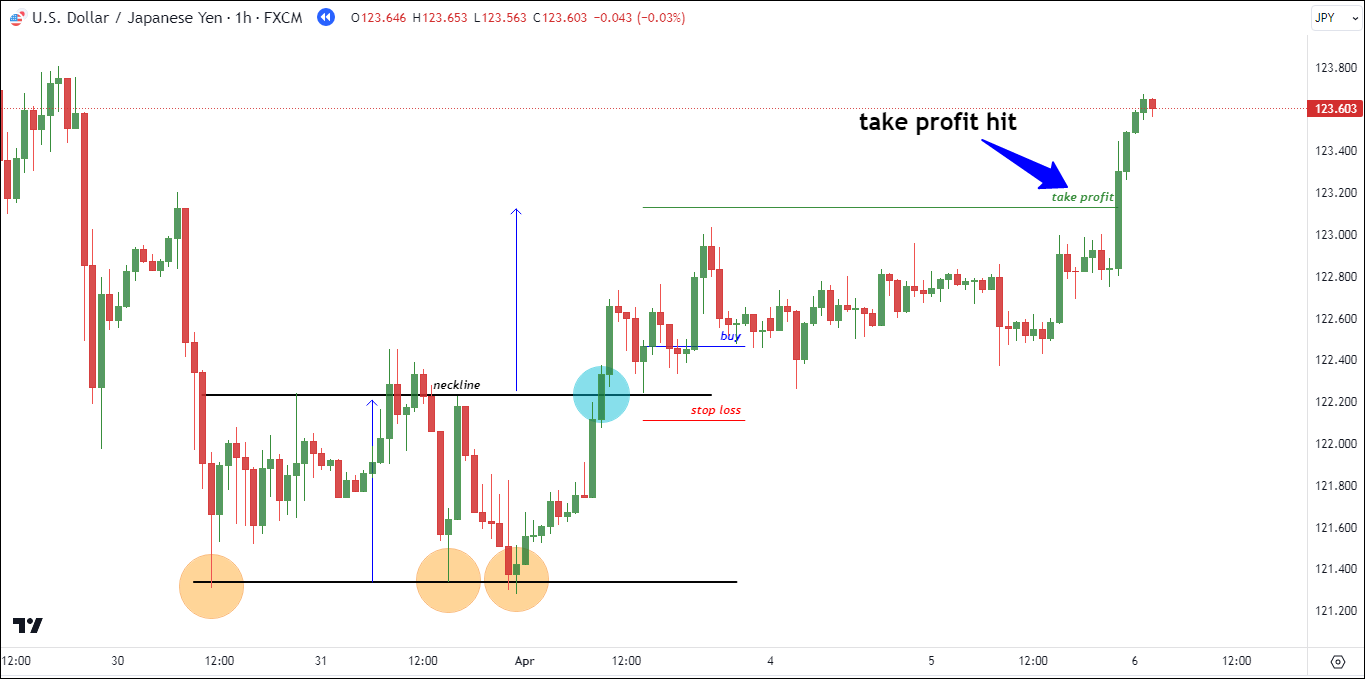
Once we enter the buy position, the price continues to rise until it reaches the take profit level at 123.134 (+67.0 pips), indicating a successful trade.
Pros and Cons Trading the Triple Bottom Pattern
Trading the triple bottom pattern, like any trading strategy, comes with its own set of pros and cons. Here's an overview:
Pros
- Clear Signal: The triple bottom pattern is easy to spot, making it simpler for traders to figure out when to enter and exit a trade.
- Risk Control: This pattern often lets traders set clear stop-loss levels, which helps them handle their risks better.
- Profit Potential: If the pattern works out as expected, it can lead to big price changes, offering a chance for good profits.
- Confirmation: It's often more trustworthy when other indicators or analyses support the pattern, making traders more confident.
Cons
- Quite rare. This pattern doesn't occur frequently in the financial markets.
- False Signals: Like any technical pattern, triple bottoms are not foolproof. Sometimes, what appears to be a triple bottom may turn out to be a false signal, leading to losses if traders act prematurely.
- Market Conditions: The success of the triple bottom pattern depends on the overall market conditions. In choppy or unpredictable markets, it may not perform as well.
- Time-Consuming: Waiting for the pattern to fully form can be time-consuming, and traders may miss other trading opportunities while waiting for confirmation.
Conclusion
From my perspective, this pattern lives up to the theory. The triple bottom is clear, highly effective, and offers high accuracy in charts. I also have found it relatively easy to identify and apply this pattern, and the results have been positive. The beginner can use and apply this pattern with ease too.
However, it's worth noting that this pattern doesn't show up in the market very often. It's unique because it demands three identical lows, which makes it less common compared to the double bottom which requires only two. Nonetheless, its rarity is one of its strengths.
It's important to note that sometimes it might give false signals, leading to losses if acted upon too quickly. Its success also depends on how the overall market is doing, so it doesn't work well all the time.
Adding the Triple Bottom Pattern to your trading strategy can be a helpful move, but remember to use it along with other tools and keep an eye on managing risks. Just like anything else, practice and learning are important for success in the world of finance. Before using it with real money, try it out in a demo account first.


10 Comments
Gabriel
Sep 26 2023
When I saw that it had an accuracy rate of 70%, I was quite impressed. It seemed like a good opportunity, so I decided to give it a shot by testing it on a few different currency pairs.
Now, I'm really interested in learning how to perform a backtest on a pattern like the triple bottom. Could you please provide a step-by-step guide on how to do this using a price chart? Since I'm eager to explore this strategy further, a clear and detailed explanation would be incredibly helpful to make sure I do the backtest effectively and accurately. Your guidance on this would mean a lot to me.
David Tristan
Sep 26 2023
Performing a backtest on a pattern like the triple bottom is a crucial step in evaluating its effectiveness as a trading strategy. Backtesting involves analyzing historical price data to see how the pattern would have performed in the past. Here's a step-by-step guide on how to conduct a backtest for the triple bottom pattern using a price chart:
Note: For this example, I'll assume you have access to historical price data for the currency pair you want to backtest.
Step 1: Gather Historical Price Data
Obtain historical price data for the currency pair you want to analyze. You can typically find this data on financial websites or through trading platforms. Ensure you have access to the following:
Step 2: Define the Criteria
Define the criteria for identifying a triple bottom pattern. Based on the description in the article, the key criteria include:
Step 3: Identify Potential Triple Bottom Patterns
Manually go through the historical price data and identify instances where the triple bottom pattern may have formed. Look for:
Step 4: Document Each Identified Pattern
Record the following details for each potential triple bottom pattern:
Step 5: Calculate Trading Signals
Determine the trading signals for each identified pattern:
Step 6: Track Trade Outcomes
Using the historical data, track how each trade would have played out based on your entry, stop loss, and take profit levels.
Step 7: Analyze Results
After analyzing multiple instances of the pattern, assess the overall performance of the triple bottom strategy by considering:
Step 8: Refine and Optimize
If your backtest results are promising, you can further refine and optimize the strategy by experimenting with different parameters, such as stop loss and take profit levels.
Step 9: Forward Testing and Implementation
Once you are satisfied with the results of your backtest, consider implementing the strategy on a demo account or with small real trades to validate its performance in current market conditions.
Daniela
Sep 26 2023
When it comes to entering the market, there are actually two main approaches to consider, as previously mentioned. These are the breakout method and the pullback method.
Now, for someone who's relatively new to trading, it's natural to wonder which of these two methods is more suitable and, if possible, what strategies or tips can be employed to enhance entry using the chosen method.
So, which method is recommended for beginners, and what specific techniques can be employed to make your entry points more effective? I would greatly appreciate your insights on this matter.
David Tristan
Sep 26 2023
Both the breakout method and the pullback method have their merits, and the choice between them depends on your trading style and risk tolerance. Here's a breakdown of each method and some tips for beginners to consider:
The breakout method enters a trade when the price confirms a pattern's validity by breaking above a significant resistance level (the neckline in the case of a triple bottom).
Tips for Effective Entry:
Recommended for Beginners: The pullback method can also be suitable for beginners, as it allows traders to enter a trade after a confirmation breakout and at a potentially better price point during a retracement.
Tips for Effective Entry:
General Tips for Both Methods:
Johnson E
Sep 26 2023
Hi, good morning!
I really like using indicators for my trading, and one that I particularly favor is the moving average. The moving average indicator is great for spotting trends in the market, as you probably know.
Now, I'm curious if it's possible to combine this indicator, perhaps in a more streamlined form, with the triple bottom pattern. If that's a workable approach, I'd love to understand how to use it effectively in my trading strategy. Any advice you can offer on this topic would be much appreciated. Thankss guysss
David Tristan
Sep 26 2023
Good morning! You can indeed combine the moving average indicator with the triple bottom pattern to enhance your trading strategy. Moving averages are versatile tools that can help you identify trends and potential entry points. Here's how you can use the moving average in conjunction with the triple bottom pattern:
As mentioned earlier, start by identifying the triple bottom pattern on your price chart using the criteria discussed in your previous questions.
Apply a moving average to your price chart. The choice of moving average type (e.g., simple, exponential, or weighted) and the period (e.g., 50-day, 200-day) depends on your trading style and preferences.
Use the moving average to help confirm the trend direction. Here's how:
Once you've identified the triple bottom pattern, consider the following ways to combine it with the moving average:
Regardless of the entry method you choose, always use stop loss and take profit levels to manage risk. You can calculate these levels based on your preferred risk-reward ratio and the volatility of the currency pair you're trading.
Another way to use moving averages with the triple bottom pattern is to employ moving average crossovers. For example, when a shorter-term moving average (e.g., 20-day) crosses above a longer-term moving average (e.g., 50-day) and the triple bottom pattern forms, it can provide a strong bullish confirmation signal.
Before implementing this strategy with real money, practice and backtest it on historical price data. This will help you gain confidence in your approach and understand how it performs under different market conditions.
Boris A
Sep 26 2023
The article I mentioned earlier talked about how this indicator is quite accurate, boasting an impressive 70% accuracy rate. However, it's not as common in the market as some other indicators, which means you won't see it as often.
Interestingly, despite its accuracy, it sometimes gives what we call "false signals." These are signals that are not accurate and can lead to losses that could have been avoided.
Given this situation, I'm interested in strategies and techniques to reduce these false signals when using the triple bottom pattern for trading. It's essential to make our trading decisions more reliable and lower the risk of unnecessary losses. Any insights or tips on this would be greatly appreciated as I work on improving my trading approach.
David Tristan
Sep 26 2023
Reducing false signals when trading with the triple bottom pattern is essential for improving the reliability of your trading strategy and minimizing unnecessary losses. Here are some insights and tips to help you lower the risk of false signals:
Wait for confirmation before entering a trade. A breakout above the neckline or a retracement to the neckline can provide stronger confirmation of the pattern's validity. Entering a trade too early can result in false signals.
Use other technical indicators or tools to complement the triple bottom pattern. Some traders combine it with oscillators like the Relative Strength Index (RSI) or the Moving Average Convergence Divergence (MACD) to confirm signals. For example, look for bullish divergence on the RSI when the pattern forms.
Pay attention to trading volume when the pattern completes. Higher volume during the breakout or confirmation can provide additional validation of the pattern's strength. A lack of volume may indicate a weaker signal.
Consider the broader market context. The success of the triple bottom pattern can be influenced by overall market conditions. It may perform better in trending markets and less effectively in choppy or range-bound markets.
Seek confluence with other technical analysis factors. This includes trendlines, support and resistance levels, Fibonacci retracements, and pivot points. When multiple factors align with the triple bottom pattern, it can increase the reliability of the signal.
Be selective in your trades. Not every potential triple bottom pattern will be of high quality. Filter out setups that don't meet your criteria for symmetry, volume, or overall pattern structure.
Backtest the triple bottom pattern on historical data to assess its performance and understand its strengths and weaknesses in different market conditions. This can help you identify when false signals are more likely to occur.
Practice your trading strategy on a demo account or through paper trading to gain experience without risking real capital. This allows you to refine your approach and learn to recognize false signals.
Implement sound trade management practices. This includes setting stop-loss and take-profit levels based on your risk tolerance and the pattern's range. Don't hesitate to exit a trade if it doesn't go as expected.
Overtrading can increase the likelihood of encountering false signals. Stick to your trading plan and avoid the temptation to enter too many trades at once.
Martin Fr
Sep 26 2023
I think the material is pretty good and covers a lot, highlighting both its strengths and weaknesses. But what I'm really keen to know more about is how you handle money management in your trading.
So, when it comes to this, can you share some tips or strategies for effectively managing your money while trading? Also, I'm curious about what you consider to be an ideal risk-to-reward ratio for this specific pattern. Your insights on these topics would be greatly helpful as I work on fine-tuning my trading strategy for better results.
David Tristan
Sep 26 2023
Here are some tips and strategies for money management, including considerations for the ideal risk-to-reward ratio when trading the triple bottom pattern:
Determine the size of your positions (the amount of capital allocated to each trade) based on your overall trading capital and risk tolerance. A common rule of thumb is not to risk more than 1-2% of your total trading capital on a single trade.
Calculate the position size for each trade based on your stop loss level. For example, if you're willing to risk 1% of your capital on a trade and your stop loss is 50 pips away, you would calculate your position size so that a 50-pip move against you results in a 1% loss.
Always use stop-loss orders to limit potential losses. The stop loss level should be determined based on your analysis, such as the pattern's range, support levels, or other technical factors. Your stop loss should be placed at a level where if the market reaches it, you exit the trade to prevent further losses.
Set take profit levels to secure profits when they reach a favorable level. Consider setting your take profit based on a risk-to-reward ratio that makes sense for your trading strategy.
The ideal risk-to-reward ratio varies depending on your trading strategy and risk tolerance. For the triple bottom pattern, a common risk-to-reward ratio might be 1:2 or 1:3. This means that you're willing to risk 1 unit to potentially gain 2 or 3 units.
Be flexible with your risk-to-reward ratio based on market conditions and the specific trade setup. Some trades may warrant a tighter risk-to-reward ratio, while others may justify a more extended ratio.
Establish clear risk management rules and stick to them consistently. Avoid taking excessive risks or increasing your position size after a losing trade (revenge trading). Maintain discipline and adhere to your predetermined risk percentage for each trade.
The primary goal of money management is to preserve your trading capital. Protecting your capital should be your top priority, as it allows you to stay in the game and take advantage of future trading opportunities.
Be mentally prepared for both winning and losing trades. Emotions can affect your decision-making, so maintain discipline and stick to your money management rules.