 Dedicated FREE FOREX VPS
 Free FOREX Virtual Private Server
 MT4 Demo Contest, Get $500
 Sign Up for an Account, Claim 60% Deposit Bonus
 Free MT4/MT5 VPS 2024
 Send E-mail and Get Free Merchandise
 $1K Refer a Friend Bonus for Pepperstone Pro clients
 Maximize Your Earnings with 100% Deposit bonus
 Trade to Win, $5,000 Monthly Demo Contest
 Claim 30% + 15% Deposit Bonus from LiteFinance
Short-term charts sometimes need a different treatment when it comes to strategy building. What if you happen to rely on MACD and try to use it in a 15-minute chart?
The best MACD strategy for 15-minute charts is the MACD triple strategy which uses multiple time frames. This strategy is based on one or more technical indicators that are subjected to parallel analysis in separate but related time frames. The higher time frames usually function as a trend filter for the signals while the lowest time frame functions as the provider of the trading signal.
How to Use the MACD Triple strategy
This MACD triple strategy can be used across several financial markets which include forex, commodities, stocks, and indices. The strategy is based on the Moving Average Convergence Divergence indicator (MACD - 12,26,9). There are three time frames used for analyzing the MACD and they are H4, H1, and M15. It can be observed that the ratio of each time frame to the next one is 4:1, in which the 4-hour and 1-hour MACDs function as trend filters, while the 15-minute MACD provides the buy and sell signals.
See Also:
Opening a Position
The 15-minute MACD gives a buy signal when there is a movement of the fast MACD leg (12) across the slow MACD leg (26) in an upward direction. When the fast MACD leg moves across the slow MACD leg in a downward direction, then the 15-minute MACD chart gives a short sell signal.
However, the signals need to be confirmed using a combined trend filter made up of the 4-hour and 1-hour MACD. If both turn out to be bullish, then only buy signals get accepted. If both indicate a bearish trend, then only sell signals get accepted. But if one is bullish while the other is bearish, all the signals get rejected.
The MACD triple strategy also includes a time filter. This means only signals within a certain timeline are accepted. For this time filter, only signals between 08:00 and 21:20 are accepted and signals outside this timeline are rejected.
Closing a Position
The MACD triple strategy utilizes a stop and a profit target in percentages. The stop is set at 0.5% from the entry price while the profit target is set at 1.5% from the entry price.
Closing open positions can be done when the reverse signal appears which is when the 15-minute MACD crosses back in the opposite direction. Also, any trading position that remains open till 21:20 is closed by the time filter at the market price.
Examples of How the MACD Triple Strategy Works
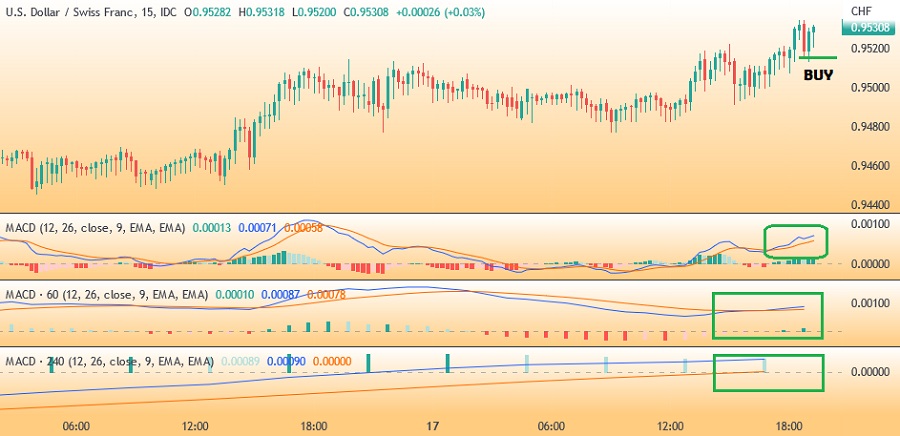
When to Buy
The chart below shows a buy signal. There are three MACDs below the main chart. The green squares that are visible in the chart indicate that both the 4-hour and 1-hour MACDs are bullish. As a result, only buy signals will be accepted. The fast leg of the 15-minute MACD moves across the slow leg in an upward direction which generates a buy signal.
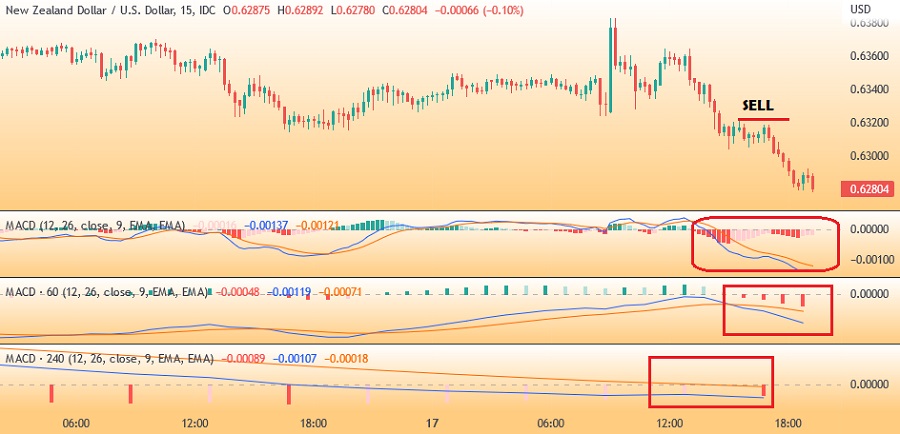
When to Sell
The chart below shows a day having a signal. There are three MACDs below the main chart. The red squares visible in the chart signify that both the 4-hour and 1-hour MACDs are bearish. As a result, only sell signals will be accepted. The last leg of the 15-minute MACD moves across the slow leg in a downward direction which generates a short sell signal.
Summary
The MACD triple strategy is typically a strategy based on multiple time frames. This combination of multiple time frames tends to yield substantial positive results in trading. However, these results can vary depending on the market and the instrument that is being traded. Therefore, traders are recommended to always backtest in a demo account for optimization of the strategy.


2 Comments
Sebastian
Jan 16 2024
I find myself a bit perplexed after reading the article about the 15-minute MACD. It suggests that a buy signal occurs when the fast MACD leg (12) crosses the slow MACD leg (26) in an upward direction, while a short sell signal is indicated when the fast MACD leg crosses the slow MACD leg downward. The article specifies the MACD settings as 12, 26, and 9.
My question is, where do these specific numerical values, particularly 12 and 26, originate? Is there a specific calculation or rationale behind choosing these particular numbers for the MACD settings? Moreover, alongside these predetermined settings, is there room for personalization based on individual preferences? Can one deviate from the standard settings and still expect the MACD to function effectively with a more tailored configuration? I'm curious about the flexibility and potential customization within the MACD framework.
Ospina
Jan 19 2024
Alright, so those numbers in the MACD settings, like 12 and 26, aren't just random picks. They actually represent the periods used in the moving averages calculation. The 12 is for the fast-moving average, and the 26 is for the slow-moving average. Then you've got the 9-period signal line to smooth things out. And it is standard in MACD!
Why these numbers? It's all about finding a sweet spot between catching short-term moves and getting a handle on longer-term trends.
Now, here's the fun part – can you tweak these settings based on your style? Absolutely! Feel free to play around with them, see what fits your trading vibe. Just remember, while customization is cool, it's wise to test your new settings thoroughly before taking them live. You want to make sure they hold up in different market scenarios.