Top Forex Indicators - Download for Free
An important instrument to help analyzing the chart, forex technical indicators are somewhat a must to be learned when you first come into this business. Even though you may end up with strategies that don't involve any technical indicator, it's still a good practice to try out some indicators every now and then.
On the other side, for technical traders keen on utilizing indicators as best as possible, exploring various types of indicators can be a necessity. Common indicators provided in the MetaTrader setup are sometimes not enough, hence the search of alternative (hopefully more advanced) indicators from other sources.
For that particular reason, we have compiled a number of top forex indicators that you can't get from your MetaTrader's selection. Don't worry, everything is available for free. You only need to choose what kind of indicator that you want, and click the download button to get it for free.
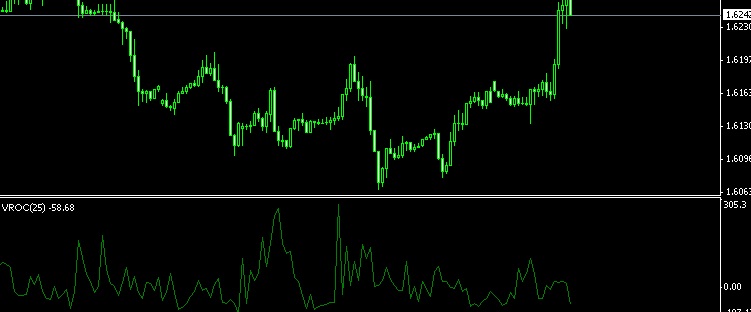
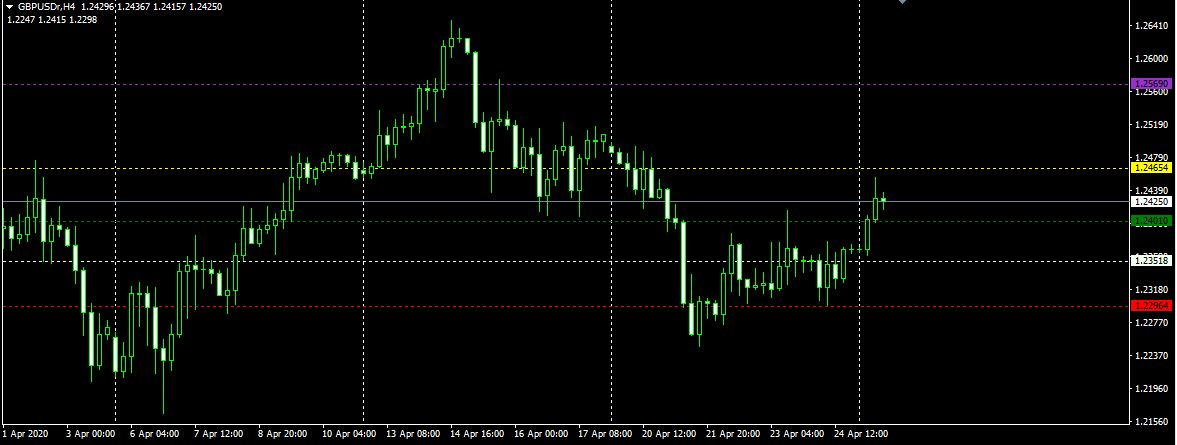
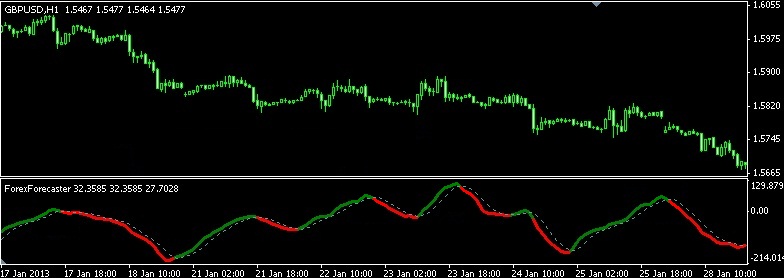
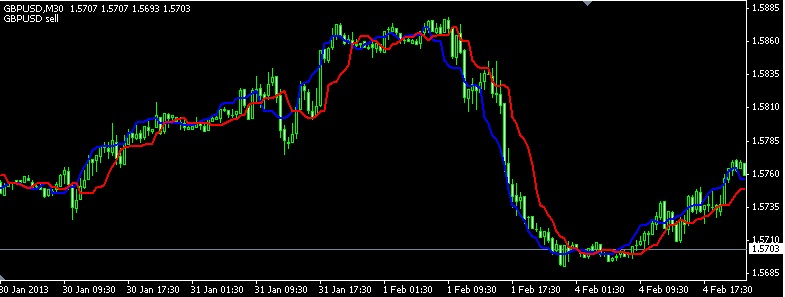
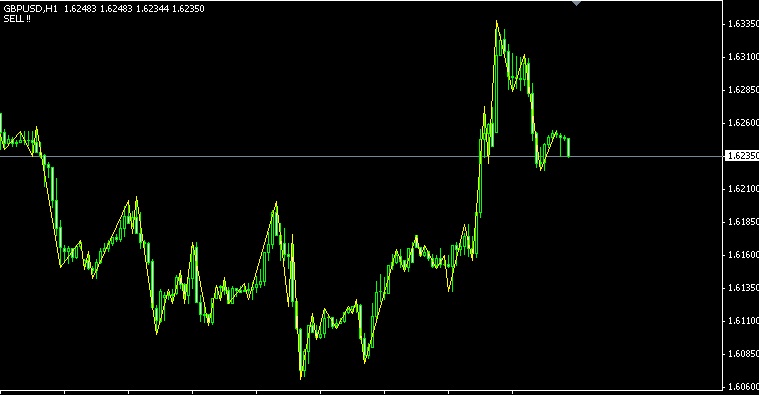
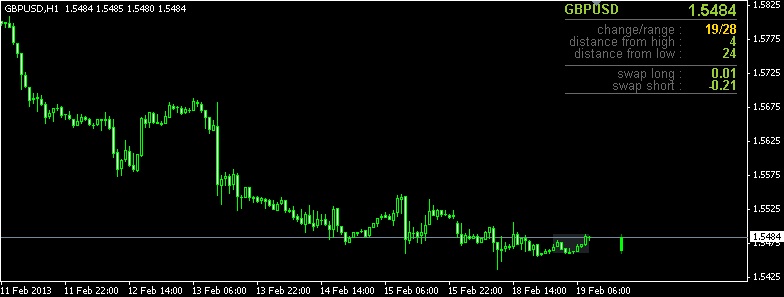
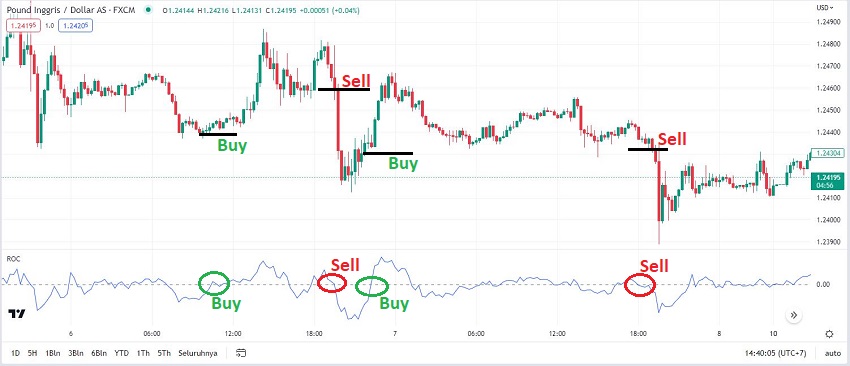
How to use RoC indicator for short-term trading?
- Select a pair, for example, GBP/USD.
- Determine a short-term time frame (M15 or M30).
- Use the RoC indicator with a period of 10 or 14.
- Wait until the RoC indicator shows a strong Buy or Sell signal.
- If RoC shows a strong decrease, you can open a Sell position on GBP/USD.
- Place a stop loss above the nearest resistance to limit losses.
- Set a profit target following your risk/reward ratio.
- Don't forget to monitor the positions.
Continue Reading at RoC Indicator for Short-term and Long-term Trading
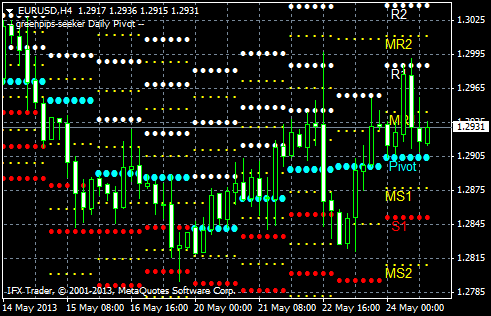
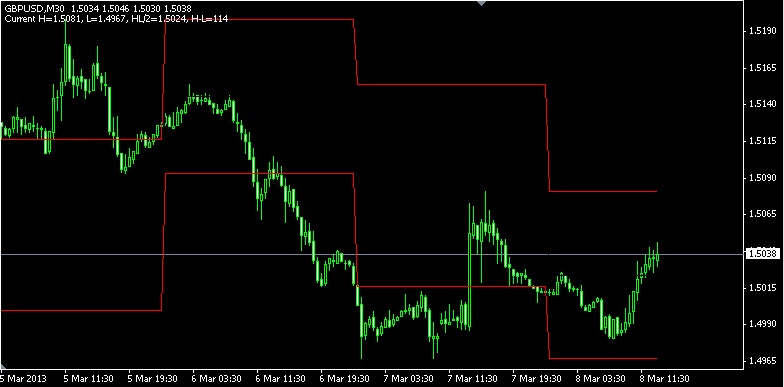
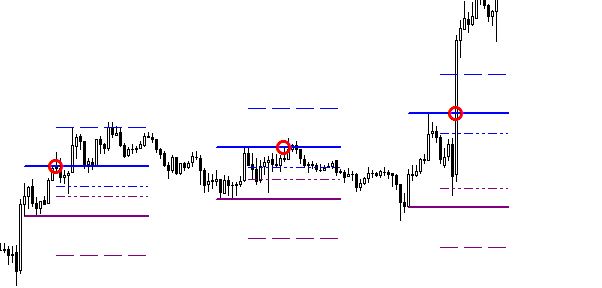
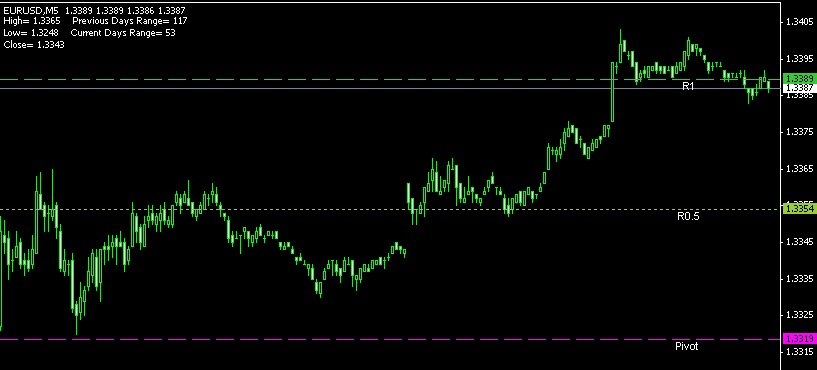
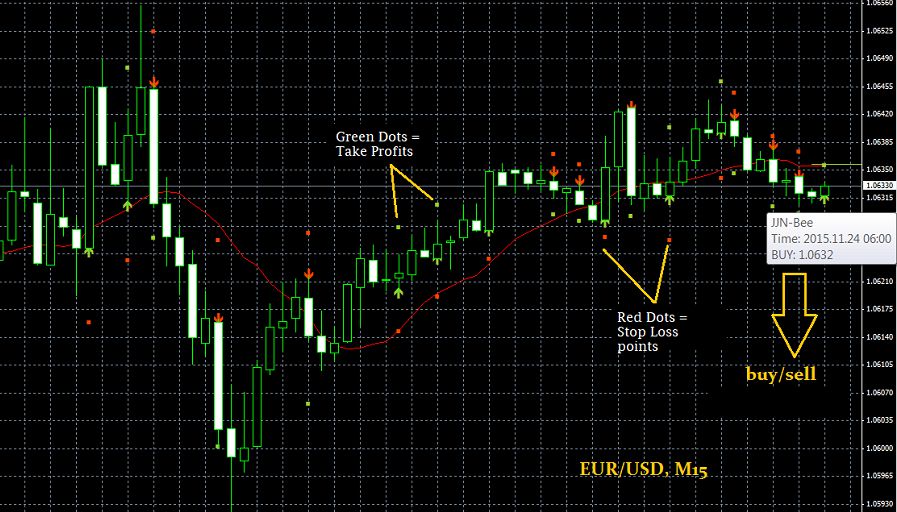
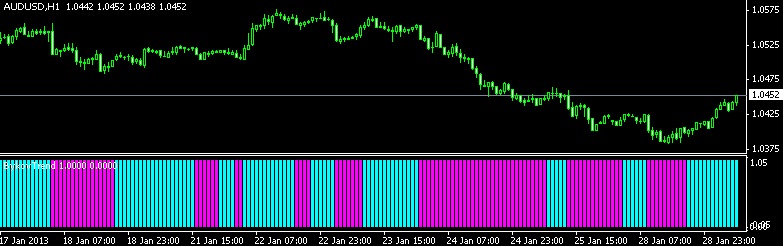
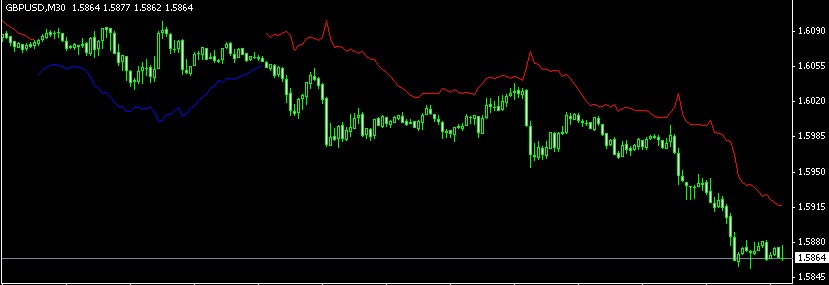
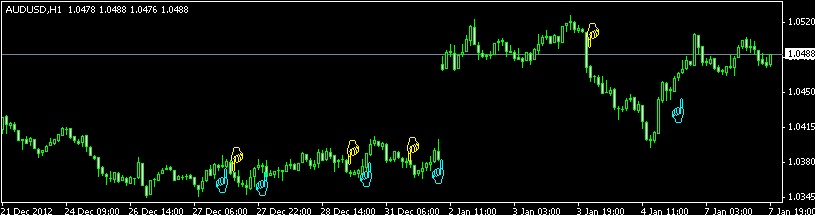
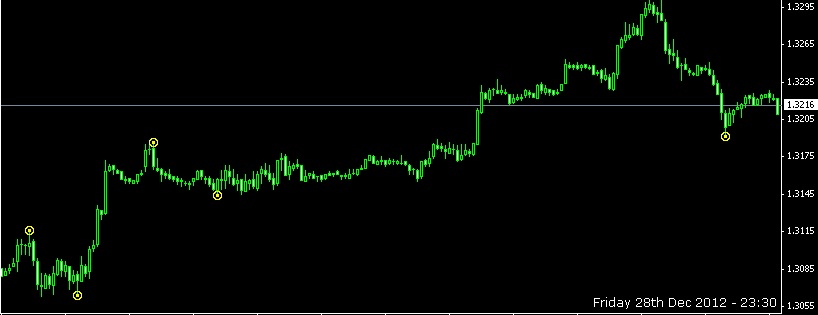
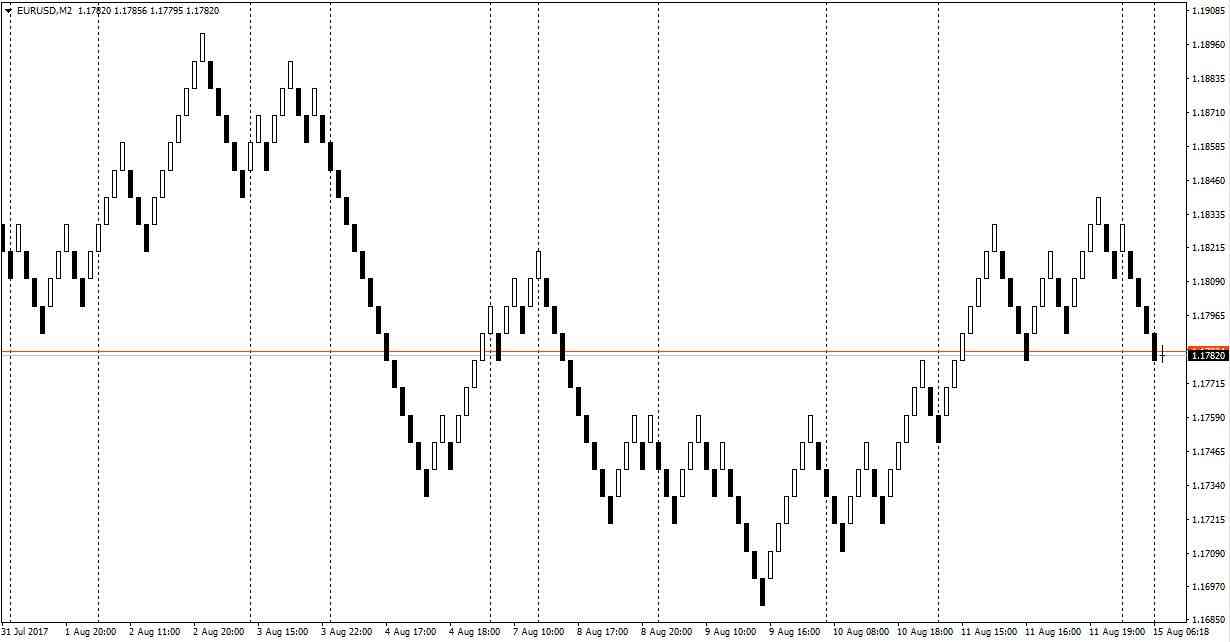
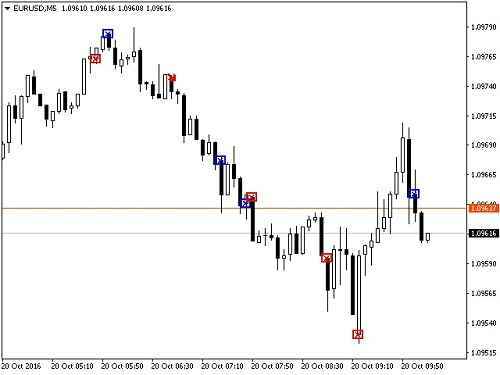
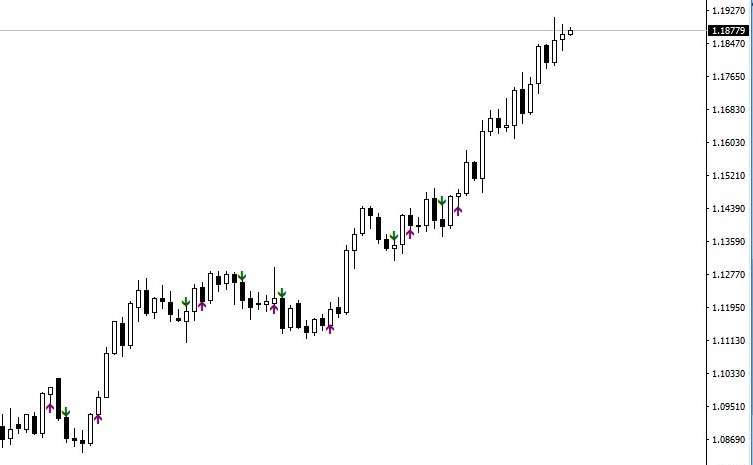
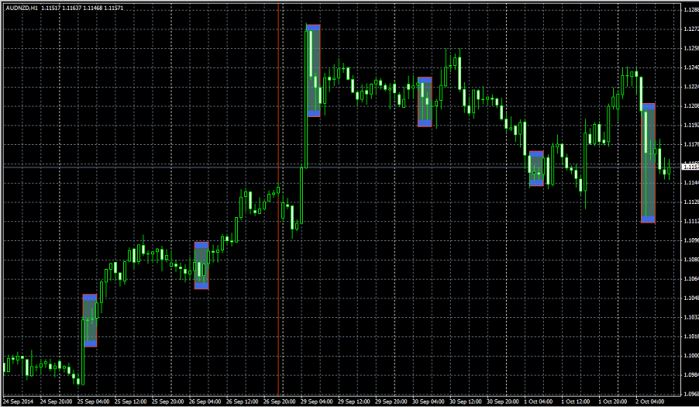
How to plan an exit scalping strategy with volume indicator?
We can target 10-20 pips profit and 5-8 pips loss. The following picture explains the scenario of opening a long position around the upper range with a 12-pip profit target and a 5-pip stop loss level.
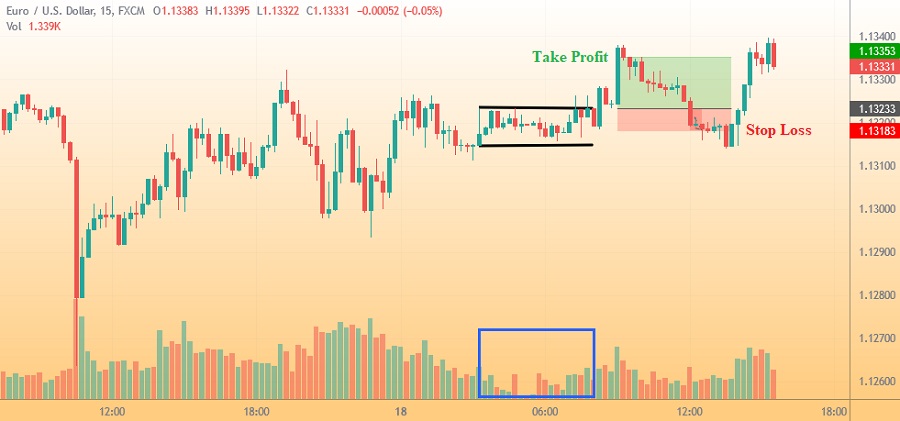
Continue Reading at Easy Scalping with Volume and Price Action Analysis
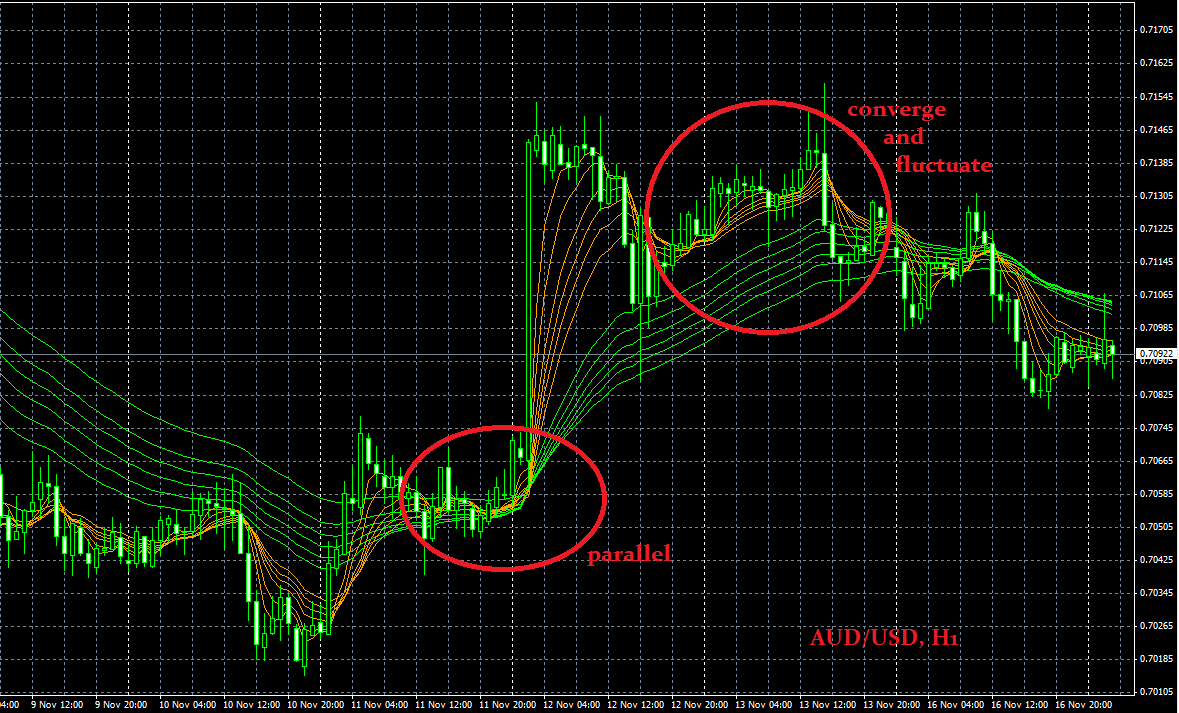
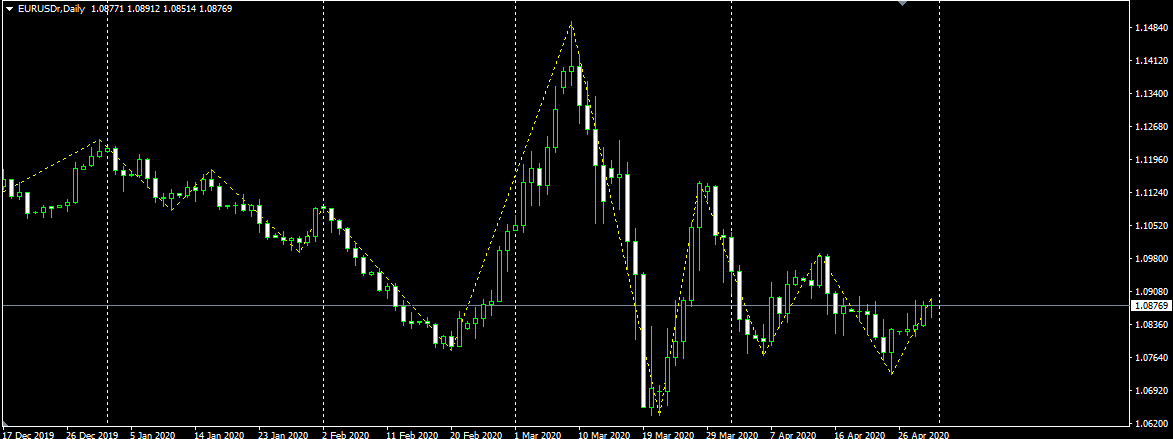
What is the key to successfully setting up an indicator?
Shorter or lower settings produce more sensitive indicators, thus generating more signals but are more prone to fake ones. On the other hand, longer or higher settings will provide rarer but more reliable signals.
Some traders argue that default settings are the best because most market participants often use them. However, if you find settings that combine current market conditions or have a good track record with other indicators, immediately backtest them to confirm their efficacy.
Continue Reading at Simple Ways to Choose the Right Indicator
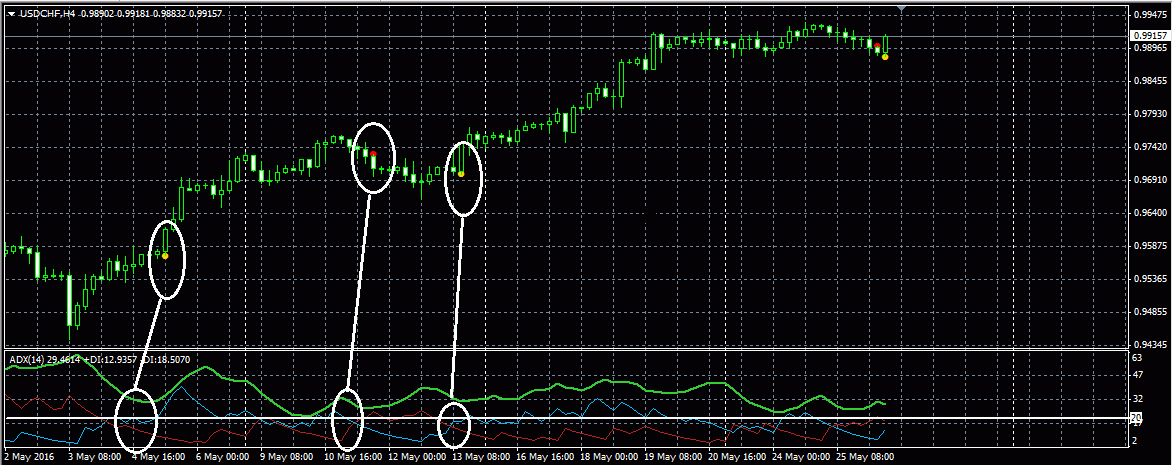
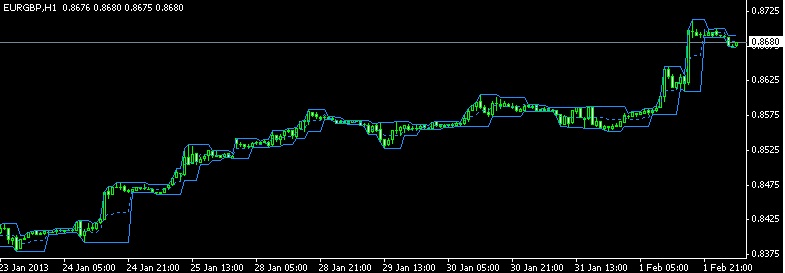
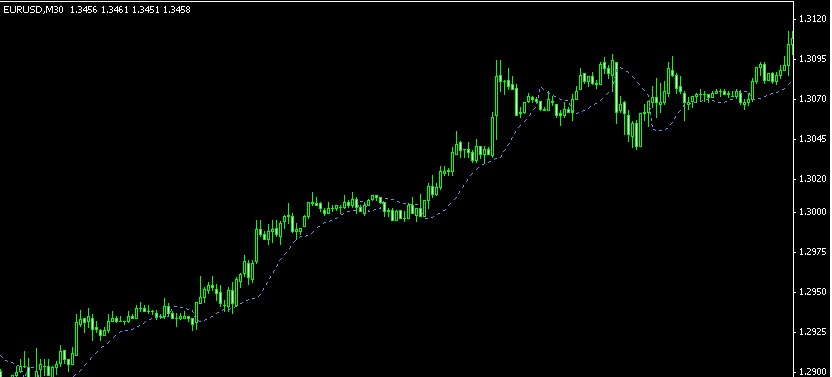
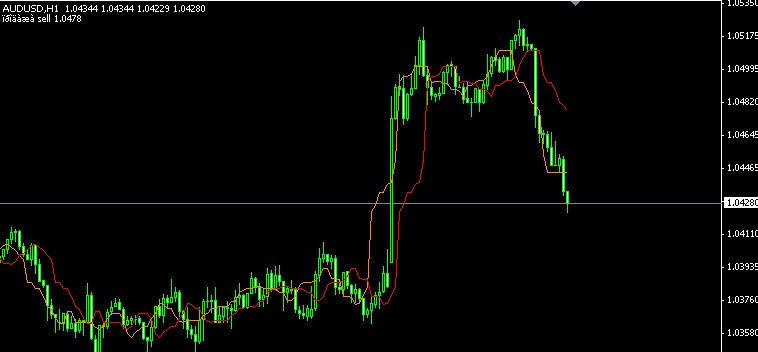
Why should we use other indicators along with 200 SMA?
This is mostly to examine how strong the trend is. This is considered necessary because a weakening trend might indicate that a trend reversal is about to occur and it provides the perfect time for exiting a current position or trade that is open.
Continue Reading at Simple 200 SMA Strategy for Beginners
Technical Analysis
-
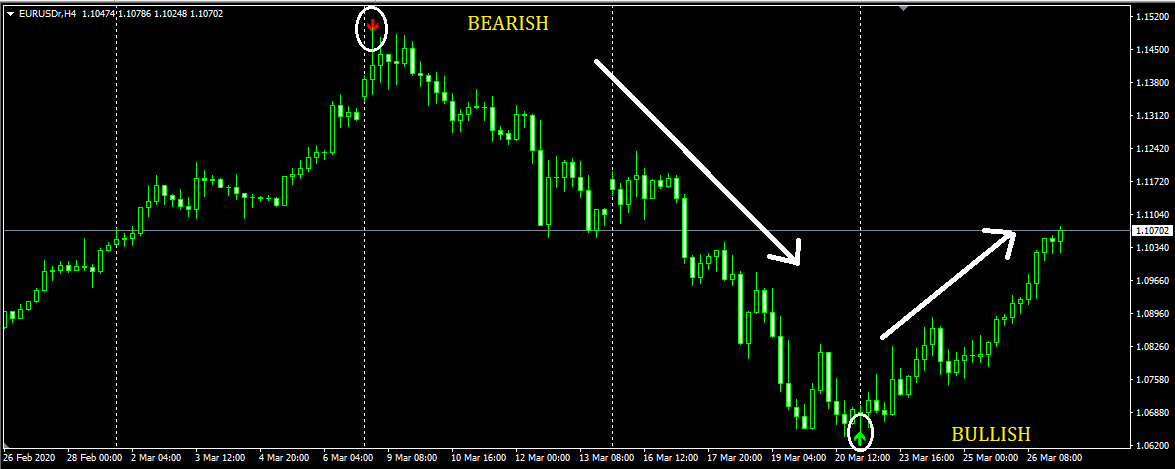
How to Determine Trend Direction with Candle Wicks
-
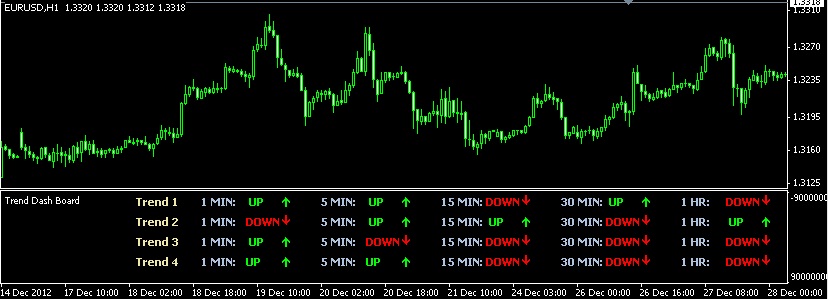
How to Combine Forex Indicators Like A Pro
-
How to Use Double Bottom and Double Top Strategy
-
3 Reasons Why 200 EMA is Important for Your Analysis
-
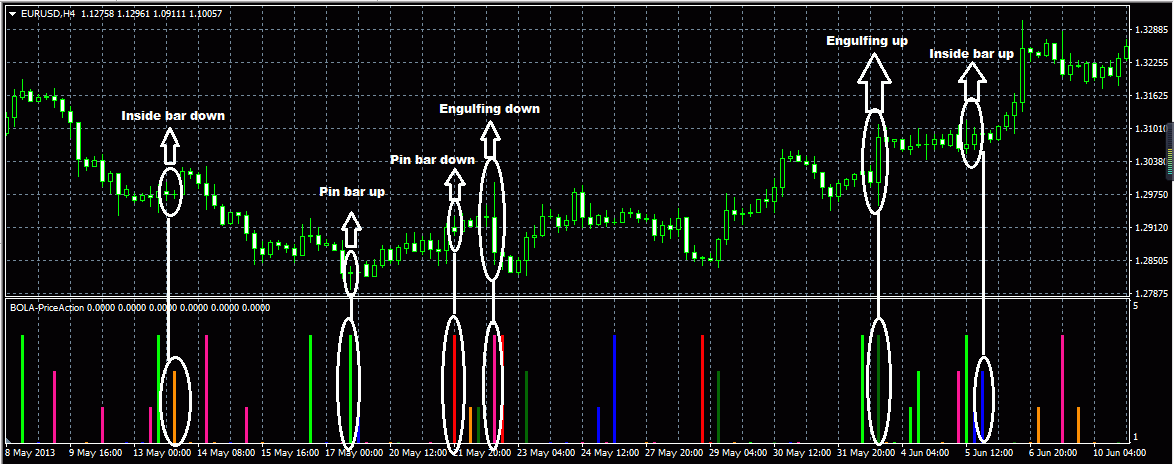
The Most Powerful Candlestick Patterns You Should Trade
-
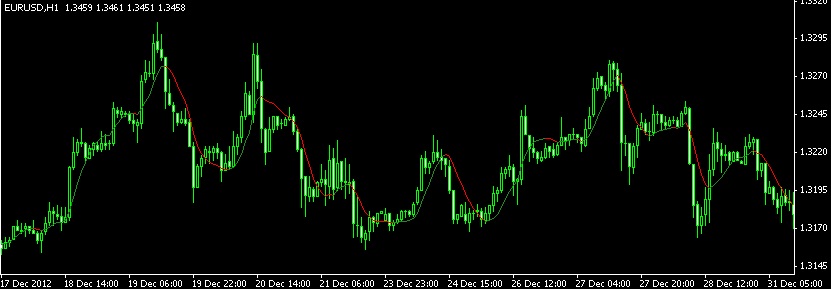
Predicting Trends Using Moving Averages In Forex Trading
-
Top Momentum Indicators for Beginner Traders
-
What are the Four Major Moving Averages?
-
Leading Vs Lagging Indicators in Forex Trading
-
Forex Technical Analysis: A Comprehensive Guide for Beginners
- More
