Dedicated FREE FOREX VPS
 Free FOREX Virtual Private Server
 MT4 Demo Contest, Get $500
 Sign Up for an Account, Claim 60% Deposit Bonus
 Free MT4/MT5 VPS 2024
 Send E-mail and Get Free Merchandise
 $1K Refer a Friend Bonus for Pepperstone Pro clients
 Maximize Your Earnings with 100% Deposit bonus
 Trade to Win, $5,000 Monthly Demo Contest
 Claim 30% + 15% Deposit Bonus from LiteFinance
Channels are one of the trading tools commonly used by traders. Besides detecting support and resistance, channels can also be used to enter and exit positions. How so?
Channels are a widely adopted concept in technical analysis that helps traders identify trends and potential trading opportunities. They are formed when the price of an asset moves within two parallel lines. The upper line indicates a possible resistance area, while the lower line signifies a potential support area.
When the asset price breaks out of the channel in the direction of the trend, it can signal that the trend is likely to continue. For example, if the price of an asset breaks out at the top of an ascending channel, it may continue moving higher.
3 Types of Channel Patterns and How to Draw Them
Channel patterns can be divided into three types: ascending, descending, or sideways. What are the differences?
Up Channel (Ascending Channel Pattern)
Ascending means "to go up". Patterns like this usually form when prices move upward, suggesting that the price trend may continue. An ascending pattern is formed when the price of an asset makes new higher highs and higher lows at the same rate.
The following chart below shows an example of an ascending channel:
In the example above, price movements create new highs and lows that form two parallel lines. In other words, an ascending channel is formed when the price of an asset moves up, and the support and resistance levels rise following the upward price movement.
An ascending channel is a bullish pattern that can be used to identify potential position entry opportunities. For example, the asset will increase if the price reaches the channel's top. Thus, traders can open a BUY position around the breakout area.
How to draw an ascending channel:
- Pay attention to price movements that consistently experience an increase or uptrend.
- Look for points where higher highs and higher lows form.
- Draw a line connecting the higher low with the higher low and the higher high with the higher high.
See Also:
Down Channel (Descending Channel Pattern)
A descending channel pattern is a price range trending downwards. It is formed when the price of an asset makes lower highs and lower lows at the same rate. The following chart shows an example of descending channels:
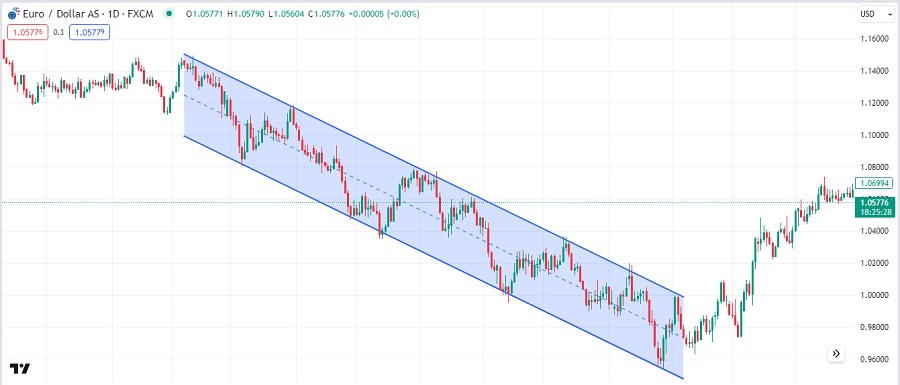
As you can see, the price is making new lows and highs to the downside. In other words, a descending channel is formed when the price of an asset moves downwards, and the support and resistance levels fall at the same rate.
Descending channels can be described when prices move in a downtrend or form highs that are lower than the previous high (lower highs), and lows that are lower than the previous low (lower lows).
The descending channel is a bearish pattern that can be used to identify potential SELL entry opportunities. If the price breaks out of the bottom of the channel, an asset will move lower, so traders can open SELL positions in the breakout area.
To draw a descending channel, follow these steps:
- Pay attention to price movements that consistently experience a decline or downtrend.
- Look for points where higher highs and lower lows are formed.
- Draw lines connecting higher low with higher low and lower low with lower low.
Sideways Channel (Horizontal Channel Pattern)
A ranging channel, also known as a sideways or horizontal channel, is a price range where the price of an asset moves within a relatively narrow band with no clear upward or downward trend. In a sideways condition, the price is moving back and forth between a horizontal support level and a horizontal resistance level, as shown in the following diagram:
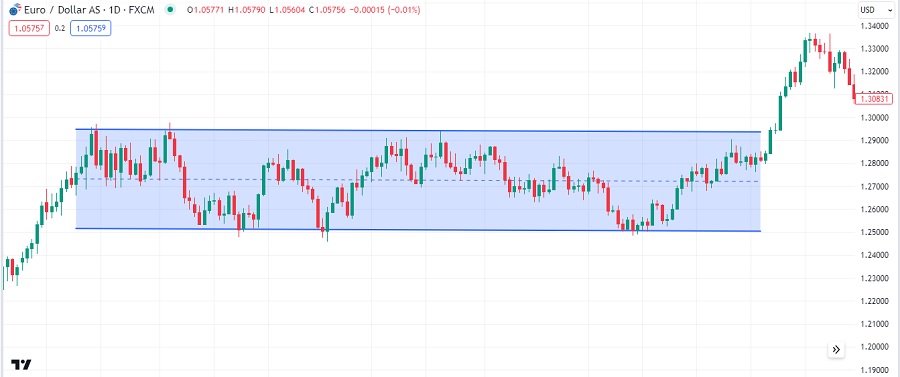
Ranging channels can be excellent times to trade if you can correctly identify the support and resistance levels. For example, you could buy the asset when it reaches the support level and sell it when it comes to the resistance level.
To draw a sideways channel, follow these steps:
- Look for a period in the price chart where the asset or security is moving neither in a clear uptrend nor a downtrend. Instead, it seems to be moving horizontally, creating a trading range.
- Identify the highest and lowest points within this sideways movement.
- Connect the highs with a straight line and the lows with another parallel line, creating a channel. These lines represent the upper and lower boundaries of the sideways channel.
- Typically, the lines should be extended beyond the current price action to the left and right to show the entire range.
- Determine the channel's critical support and resistance levels. These levels can be where the price tends to bounce or reverse.
Key Tips for Drawing a Channel Pattern
When drawing channels, it is essential to keep the following in mind:
- There are no strict rules for drawing channels, but the steeper the angle of the channel, the less reliable it will be. This is because price movements that rise or fall sharply are likelier to break out of the channel.
- The more often the channel is tested, the more reliable it is. Some traders confirm the reliability with at least two price bounces in the past.
- A channel's resistance and support lines do not indicate exact resistance or support levels but rather their range.
- The channel should be wide enough to contain most price action.
- The channel should be sloping slightly upwards or downwards. This is because sideways channels are often formed as part of a more significant trend.
It's best to avoid drawing channels with steep angles, focus on those with repeated successful tests, and remember that channel lines represent ranges of support and resistance rather than precise levels.
How to Trade Using Channel Pattern
Trading with channels usually involves selling in the resistance area, buying in the support area, and setting a tight stop level to anticipate whether the price will penetrate (break) the channel. Target (limit) levels are usually determined in the opposite area, near support or resistance.
This strategy is simple and accessible to traders of all levels. Here are the setups:
- Currency pair: Major pairs are preferred.
- Time frames: All time frames can work.
- Indicators: Channel Patterns.
Entry Rules
- Determine the direction of the trend. If the trend is bullish, the price will be making higher highs and higher lows. If the trend is bearish, the price will make lower lows and lower highs.
- Draw the channel. Connect at least two swing highs and two swing lows. The more swing points you can connect, the more reliable the channel will be.
- Identify potential entry and exit points:
- You can enter a position for long trades (BUY) when the price tests the lower trendline and bounces back.
- Otherwise, you can enter for short trades (SELL) when the price is rejected from the upper trendline.
- Confirm a trade entry before making it. You can use technical indicators like Moving Averages or Oscillators like RSI or Stochastic indicators. Additionally, you can look for confirmation by examining the candlestick formations around the resistance or support level.
Exit Rules
- You can close your long trades when the price reaches the upper trendline or breaks above it.
- You can close your short trades when the price reaches the lower trendline or breaks below.
- Depending on the direction of the trade, the lower and upper trendlines can be good references for stop loss and take profit levels.
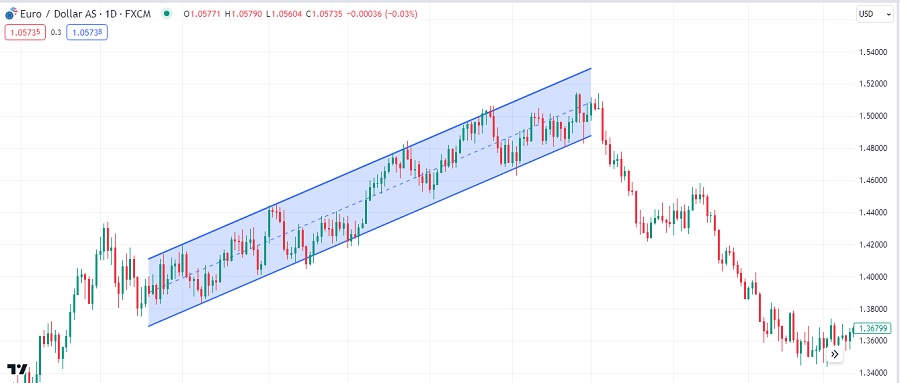
Here is an example if you trade during a downtrend:
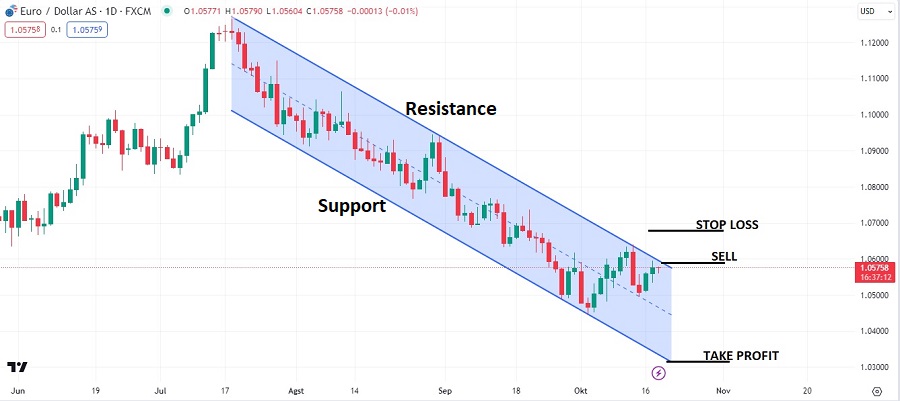
The EUR/USD chart above shows a descending channel pattern characterized by a series of lower highs and lower lows. Traders can open a SELL position around the channel's resistance line, anticipating the price bouncing downwards. Consequently, the stop loss is set above the upper line while the take profit is around the lower line.
Who Is the Channel Pattern Strategy for?
The channel pattern is a versatile trading tool that all traders of all levels can use. This pattern can also be applied to various trading instruments, including forex, stocks, crypto, and commodities. Apart from that, channel patterns are also relatively easy to learn. This makes it easy for traders to apply these tools to their strategies.
Here are some types of traders who can benefit using the channel pattern:
- Day traders: Day traders buy and sell assets within the same day. Using the channel pattern, they can assess shorter time frames to identify potential intraday trading opportunities.
- Swing traders: Swing traders hold positions for several days or weeks. They can use the channel pattern to find trading setups on daily and weekly price swings.
- Position traders: Position traders hold positions for months or even years. They can use the channel pattern to identify potential trading opportunities on monthly and yearly charts, which aligns with their longer-term trading approach.
Channel patterns are among the most straightforward trading tools. To improve their accuracy, traders can combine channel patterns with candlestick patterns. Learn more in "The Most Powerful Candlestick Patterns You Should Trade".