Dedicated FREE FOREX VPS
 Free FOREX Virtual Private Server
 MT4 Demo Contest, Get $500
 Sign Up for an Account, Claim 60% Deposit Bonus
 Free MT4/MT5 VPS 2024
 Send E-mail and Get Free Merchandise
 $1K Refer a Friend Bonus for Pepperstone Pro clients
 Maximize Your Earnings with 100% Deposit bonus
 Trade to Win, $5,000 Monthly Demo Contest
 Claim 30% + 15% Deposit Bonus from LiteFinance
Most traders prefer candlestick patterns to predict reversals. These bearish reversal candlesticks can be either single or multiple patterns.
As you know, there are several ways to view the historical prices of trading instruments, one of which is to detect reversals from candlestick patterns. Such patterns indicate a reversal of direction from an uptrend to a downtrend or vice versa. As a result, new candle formations occur in the distribution phase of the market price cycle.
Linking two, three, or more candlesticks or seeing their formation as a single pattern can help us better understand upcoming changes in market sentiment and identify potential market entry or exit points. When the pattern appears, it will be followed by a new trend. In this article, we would specifically talk about bearish reversal candlestick patterns. When you detect these patterns forming, be prepared to open a sell trade.
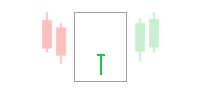
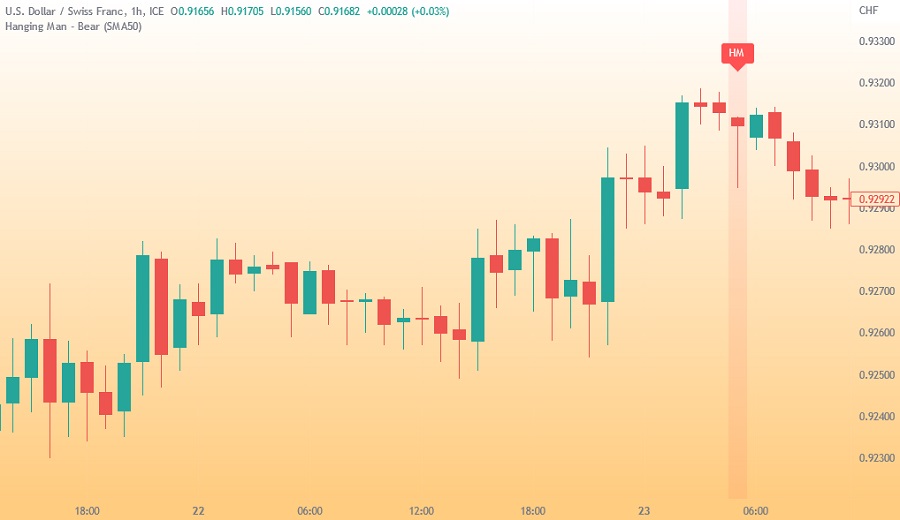
Hanging Man
The Hanging Man is a bearish reversal candlestick signal with a small body at the top of the range and a long lower shadow. The color of the body doesn't matter, but it's just that red is more bearish than green. The small body of this candle represents the small distance between the open and closed prices.
The Hanging Man pattern usually appears at the end of a bullish trend, and the bearish candlestick pattern signals weakness in the ongoing price action, indicating that the bulls had pushed the price higher but failed to push it any further. At the same time, selling interest has entered the market for the first time in a long time, resulting in a long downtrend. As the uptrend begins to weaken, buying traders may not have enough strength to keep the price higher.
Signals to watch for are a lower shadow tail that is twice the length of the body and a small or even no upper shadow, indicating that sellers pushed prices lower during the open. This condition is a good momentum to adjust long positions or enter a new short position.
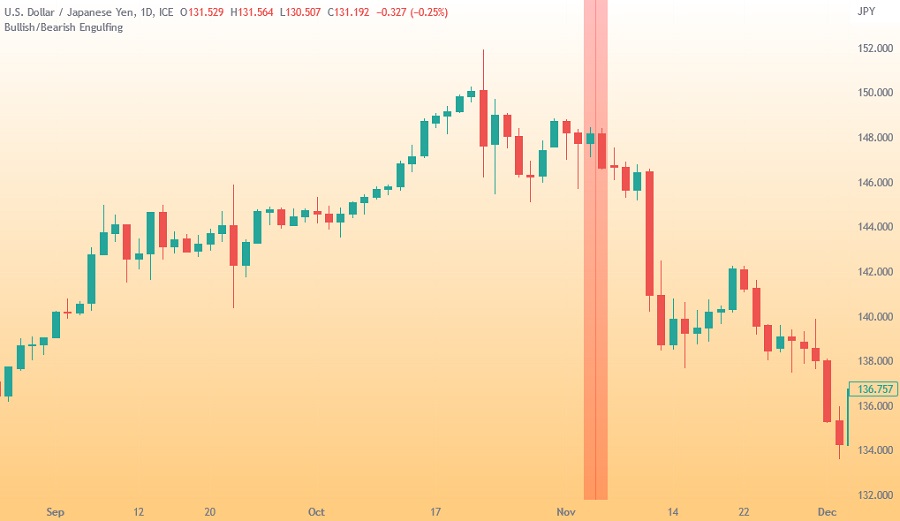
Bearish Engulfing
The bearish engulfing pattern is a pattern consisting of two candles, with the bearish candle having a long red body rather than the previous candle. This candlestick pattern indicates a reversal of an uptrend and a decline in price due to selling pressure exerted by sellers at the top of an uptrend. This pattern triggers a significant reversal when sellers enter and drop the market price.
It is important to note that the body of the second candle must completely cover the body of the first candle. The lower the price decline in the bearish candle, the stronger the reversal signal from an uptrend to a downtrend can be considered.
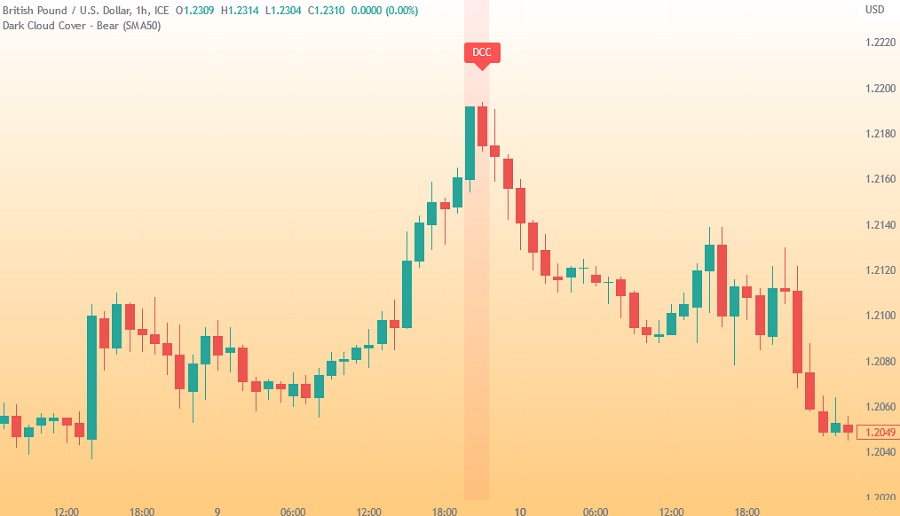
Dark Cloud Cover Pattern
The Dark Cloud Cover is a bearish reversal candlestick pattern that forms at the end of an uptrend, indicating weakness in said trend. This pattern consists of two consecutive bullish and bearish candles, where the second candle rises to cover half of the body of the first candle.
Under these conditions, prices on the market are failing to maintain the upward momentum. This could have happened for several reasons, such as the existence of impactful fundamental news that significantly affected the market.
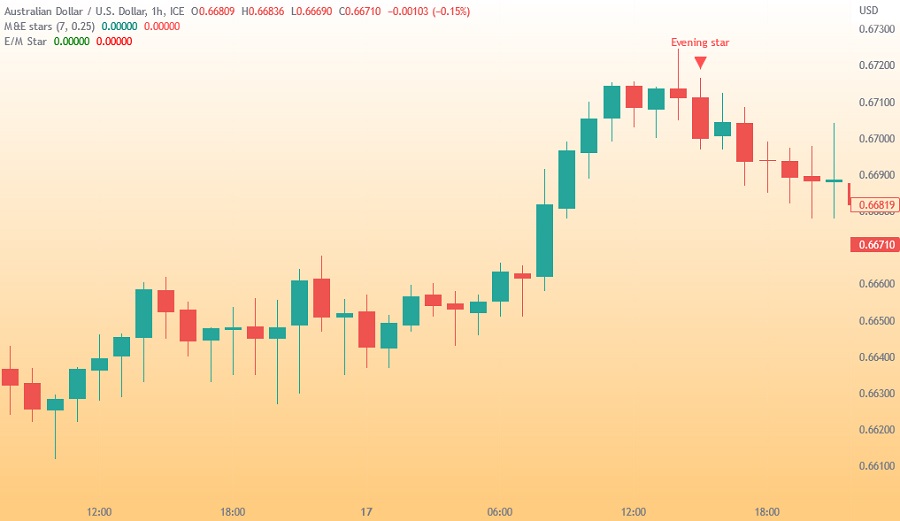
Evening Star
The Evening Star candle is a pattern that indicates a reversal from bullish to bearish. It consists of three candle formations: a large bullish candle reflecting a reversal, a doji candle with the same opening and closing prices, and a bearish candle that signals a decline in prices. This bearish candle determines whether the price experiences a reversal or not.
See Also:
The Evening Star pattern appears at the top of an uptrend and indicates that the uptrend is turning into a downtrend. The price change is usually significant and can be triggered by certain fundamental factors.
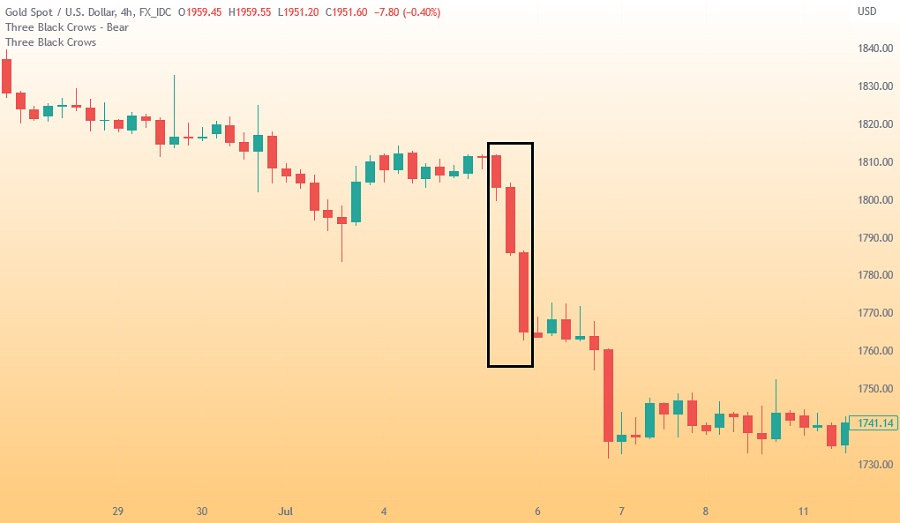
Three Black Crows
Three Black Crows are three consecutive black or red candlesticks with a lower closing price. This candlestick pattern predicts that the price will reverse after an uptrend period. All three candlesticks have long bodies with short shadows or none at all. That shows that with each trade, the selling pressure is greater than the buying pressure, so the price drop sharply. In the Three Black Crows pattern, conditions were formed because traders exerted bearish power so that prices fell for three periods in a row.
Apart from candlestick patterns, predicting reversals can be supported with other analysis methods like price patterns. Compared to candlestick patterns, price patterns analysis needs a bigger picture observation on the chart. How so? Learn one of the examples in How to Trade Reversals with Double Bottom Pattern.