Dedicated FREE FOREX VPS
 Free FOREX Virtual Private Server
 MT4 Demo Contest, Get $500
 Sign Up for an Account, Claim 60% Deposit Bonus
 Free MT4/MT5 VPS 2024
 Send E-mail and Get Free Merchandise
 $1K Refer a Friend Bonus for Pepperstone Pro clients
 Maximize Your Earnings with 100% Deposit bonus
 Trade to Win, $5,000 Monthly Demo Contest
 Claim 30% + 15% Deposit Bonus from LiteFinance
This simple guide provides step-by-step instructions on how to set up the CCI indicator and interpret its signals.
The Commodity Channel Index (CCI) is a technical indicator that measures the relationship between the current price and its average over a specified period. It is mainly used to identify overbought and oversold.
The CCI is calculated by subtracting the average price of a security over a specified period from the current price and then dividing that difference by the standard deviation of the price over the same period. The result is a number that can range from -100 to 100.
The way a trading strategy using the CCI indicator works is relatively easy, namely by taking advantage of overbought and oversold price momentum. This strategy is essential to learn because it can help traders confirm tops and bottoms to enter positions.
The CCI can be used as a standalone indicator. Still, it is often used with other technical indicators to confirm signals or provide additional insights into the market.
How Commodity Channel Index (CCI) Works
CCI is one of the built-in indicators on MetaTrader and is classified as one of the groups of Oscillator types along with RSI, MACD, etc.
Reading the CCI indicator is very simple. A CCI reading above 100 indicates that the price is overbought, while a reading below -100 suggests that the price is oversold. A CCI reading that crosses above the zero line from below signals a bullish reversal, while a crossing below the zero line from above shows a bearish reversal.
How to Calculate CCI
Here is a simple way to calculate the values of the CCI indicator with a standard period of 14:
CCI = (TP - SMA (TP,14)) / (0.015 x Mean Deviation)
- Accurate Price (TP) is calculated by averaging the values of High, Low, and Close with this formula: (High + Low + Close) / 3
- Simple Moving Average (SMA) is the average value of the TP for a specified period. In this case, the period is 14.
- 0.015: A constant used for the scaling process. By including this continuous value, the value of the CCI Indicator will always fall within a value of -100 to 100.
- Mean Deviation: Average value of SMA TP.
The CCI value is calculated by subtracting the SMA TP value from the True Price value and dividing it by the standard deviation. The result is a number that can range from -100 to 100.
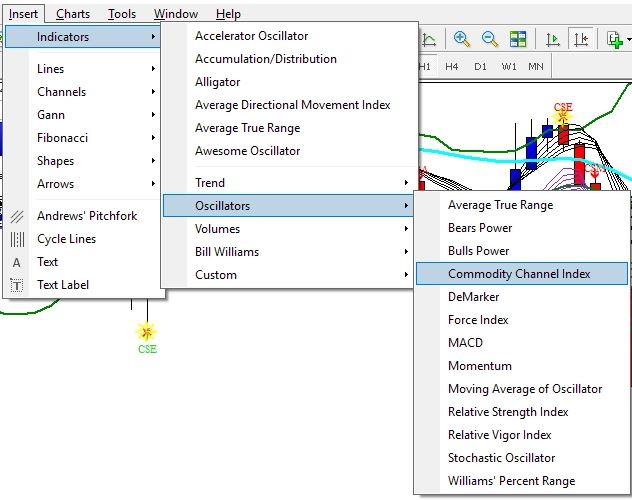
How to Apply CCI on MetaTrader
You don't need to worry if you are using MetaTrader because the indicator can be directly applied through the Insert > Indicator > Oscillator > Community Channel Index menu.
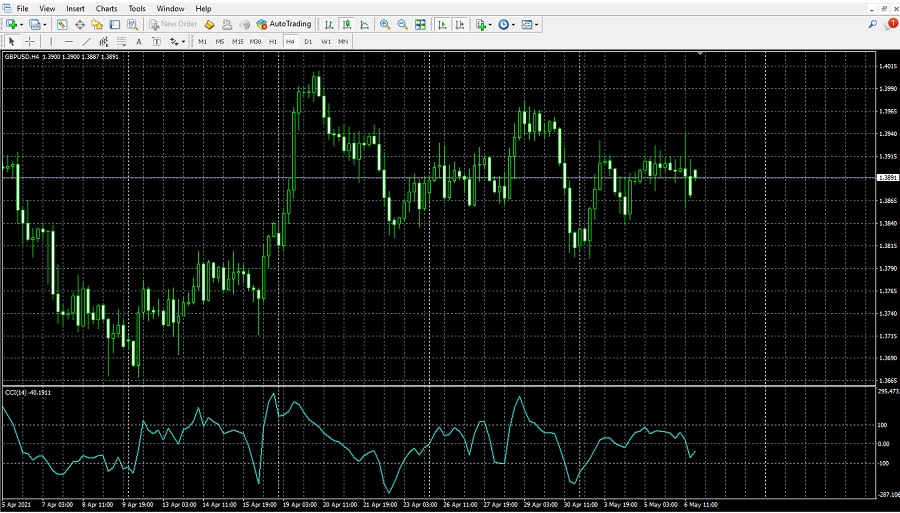
The following is the appearance of the CCI indicator on the MetaTrader 4 trading platform:
How to Use the CCI Indicator for Trading
The CCI Indicator employs diverse statistical methods to compute price averages. This indicator is helpful for various purposes thanks to its intricate calculation formula.
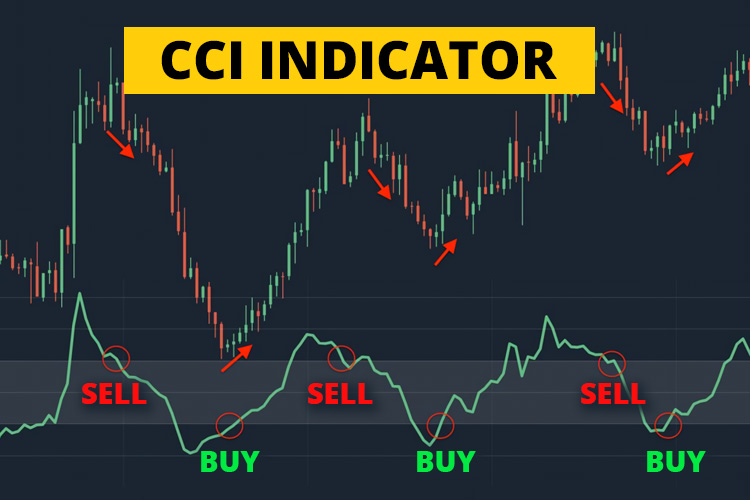
1. Overbought and Oversold Levels
The Commodity Channel Index (CCI) is a technical indicator often used to identify overbought and oversold conditions in the market. Overbought and oversold conditions are considered market saturation levels, which can signal a reversal or change in trend.
As mentioned, the CCI signal line will be above the +100 level in overbought conditions. This indicates that the market is overvalued and is likely to experience a correction.
On the other hand, the CCI signal line will be below the -100 level in oversold conditions. This indicates that the market is undervalued and is likely to experience a rebound.
The example below shows the CCI signal line in overbought and oversold conditions:
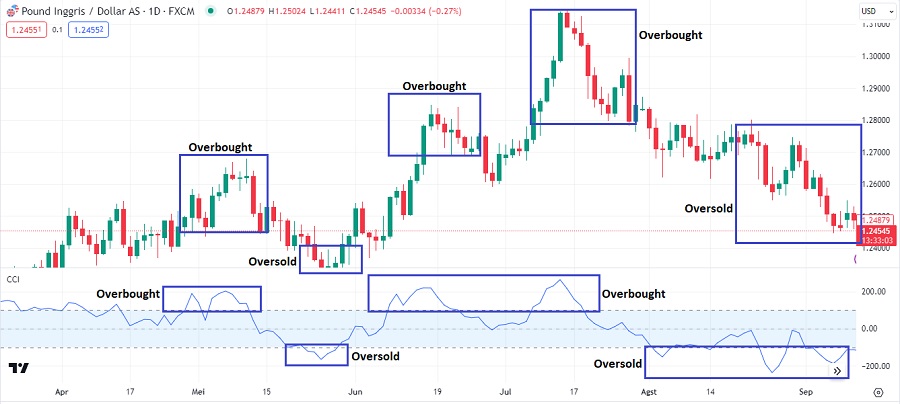
As you can see, the CCI signal line crosses above the +100 level in overbought conditions and below the -100 level in oversold conditions. These signals can be used to identify potential reversals or changes in trends.
It is important to remember that the CCI is not a perfect indicator. It can generate false signals, especially in volatile markets. As a result, it is essential to use the CCI with other technical indicators and to exercise caution.
2. Market Divergence
The Commodity Channel Index (CCI) is a momentum oscillator indicator that can be used to identify divergences in the market. Divergence is a condition where the price movement and the indicator movement do not agree with each other. This can be a sign that a trend reversal is imminent.
There are two types of divergence: bullish and bearish.
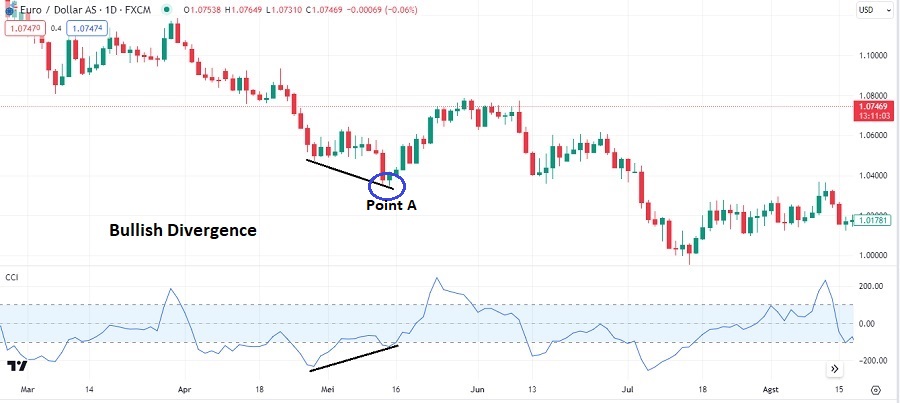
Bullish Divergence
A bullish divergence occurs when the price moves lower, but the CCI signal line makes a higher low. This indicates that the underlying downside momentum is slowing down, which could signify that the trend is about to reverse.
For example, in the image below, the price makes a lower low at point A. However, the CCI signal line makes a higher low at the same point. This is a bullish divergence signal.
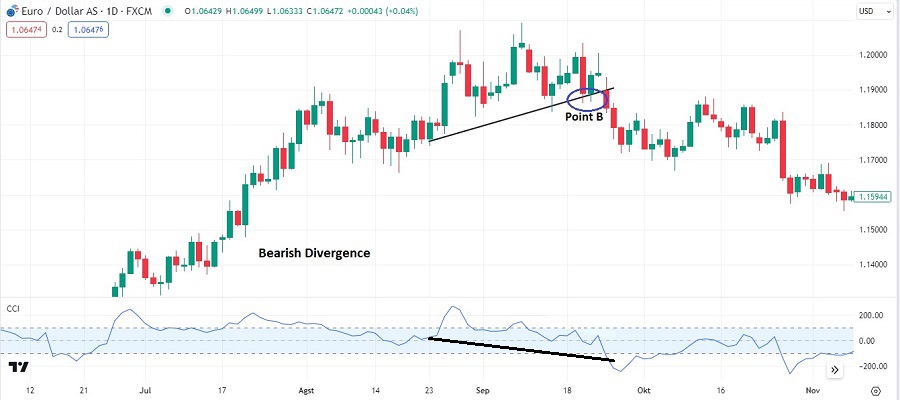
Bearish Divergence
A bearish divergence occurs when the price increases, but the CCI signal line makes a lower high. This indicates that the underlying upside momentum is weakening, which could signify that the trend is about to reverse.
For example, in the image below, the price makes a higher high at point B. However, the CCI signal line makes a lower high at the same point. This is a bearish divergence signal.
It is important to note that divergence is not always a reliable signal of a trend reversal. It is best to use divergence with other technical indicators to confirm the signal.
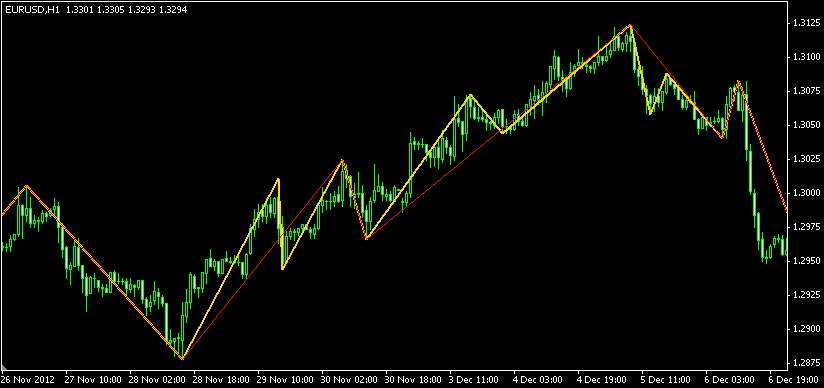
3. Identify Trend Line Breaks
Trend lines connect consecutive peaks or troughs in a price chart. They can identify the trend's direction and predict potential trend reversals.
The Commodity Channel Index (CCI) indicator can identify trend line breaks. A trend line break occurs when the price moves above or below a trend line that has been previously established.
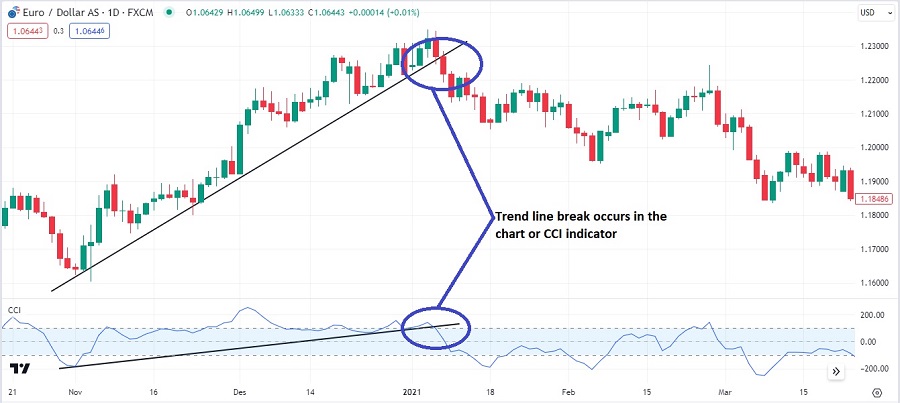
Traders can also combine the trend line break with CCI's overbought and oversold references. It could work like this:
- A CCI reading above -100 and a trend line break are considered bullish in oversold conditions. This signals that the market is about to reverse and start moving up.
- A CCI reading below +100 and a trend line break are considered bearish in overbought conditions. This signals that the market is about to reverse and start moving down.
Applying CCI on a Trade
This strategy is quite easy for anyone to use. However, before using this indicator, there are several important settings that traders need to pay attention to to get maximum results:
- CCI Period: Standard.
- Pair: Major pairs are preferred.
- Time frames: All time frames can work.
Entry Setup:
- SELL if the price is in overbought condition (above the +100 line) and the CCI line is seen crossing the +100 line from above. Make sure that the indicator line has successfully broken the line.
- BUY if the price is oversold (below the -100 line) and the CCI line crosses the -100 line from bottom to top. BUY entry can be done if the CCI line has successfully broken the -100 line.
The example below clearly shows that the EUR/USD pair is overbought, as shown by the CCI movement above +100. When the indicator line moves down and crosses the +100 line from top to bottom, it is a good indication to open a SELL position. For more details, please see the following image.
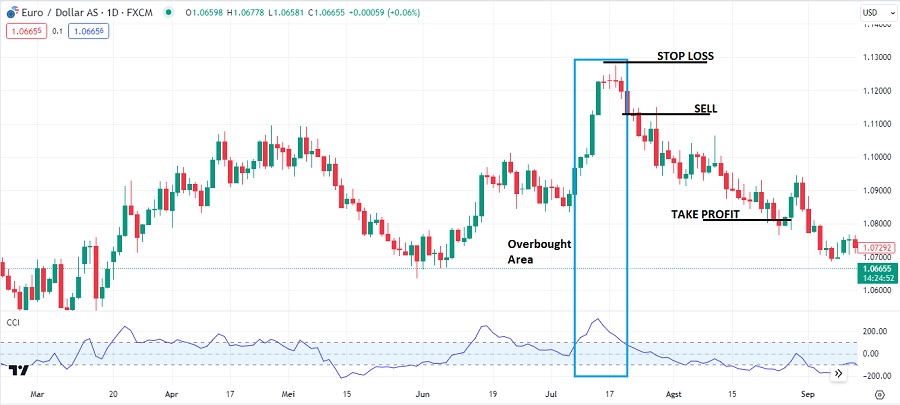
The stop loss level is set on a prominent swing high that coincides with the overbought indication from CCI. Meanwhile, the take profit is executed when the CCI line forays into the oversold area.
Conclusion
The CCI indicator is a momentum indicator used to identify extreme conditions in the market. It is a versatile indicator that can be used for a variety of trading styles, including:
- Day trading: Day traders use the CCI to identify overbought and oversold conditions in the market. They may buy when the CCI falls below -100 and sell when it rises above +100.
- Swing trading: Swing traders use the CCI to identify potential reversals in the market. They may buy when the CCI crosses above its zero line and sell when it crosses below.
- Position trading: Position traders use the CCI to identify long-term trends in the market. They may buy when the CCI is trending above its zero line and sell when it is below its zero line.
In conclusion, the CCI indicator is valuable for traders, providing insights into market trends and saturations. Integrating the CCI indicator into your trading strategy can enhance your ability to seize opportunities from price reversals.
Traders commonly use good technical indicators to maximize their trading. In addition to CCI, there is also the MACD indicator, known for its advantage in detecting trends and momentum.