Dedicated FREE FOREX VPS
 Free FOREX Virtual Private Server
 MT4 Demo Contest, Get $500
 Sign Up for an Account, Claim 60% Deposit Bonus
 Free MT4/MT5 VPS 2024
 Send E-mail and Get Free Merchandise
 $1K Refer a Friend Bonus for Pepperstone Pro clients
 Maximize Your Earnings with 100% Deposit bonus
 Trade to Win, $5,000 Monthly Demo Contest
 Claim 30% + 15% Deposit Bonus from LiteFinance
Entering trades during a correction presents a prime opportunity. Explore these pullback strategies, from trendlines to Fibonacci, to enhance your trading profits.
Pullback conditions are common in the dynamic forex market. When prices move against the main trend before resuming the dominant movement, pullbacks can be an effective tool for identifying potential entry points.
A pullback is a temporary movement within a trend. In this context, a pullback can occur when the price undergoes a correction before the trend resumes.
So, how to find opportunities from these pullback conditions? This article will discuss 5 technical methods that can be used, including:
- Trendline: Analyzing the peak and trough structure using trendlines.
- Moving Average (MA): Utilize pullback conditions when the price rebounds from the 50 EMA line.
- Fibonacci: Observing point C on the Fibonacci retracement.
- Breakout: Await a pullback following a price breakout in order to strengthen the price's confirmation.
- Trendline and Fibonacci: Combines trendlines and Fibonacci levels to achieve effective trading entries.
These five methods can be very helpful for traders to determine potential entry points during a pullback. For further explanation about the 5 methods above, you can read the following explanation.
1. Pullback Strategy with Trendline
Before identifying a pullback, traders must first establish the prevailing trend. The simplest approach to trend identification involves analyzing the peak and trough structure using trendlines. Uptrends exhibit a pattern of higher peaks followed by higher troughs, whereas downtrends demonstrate lower troughs and lower peaks.
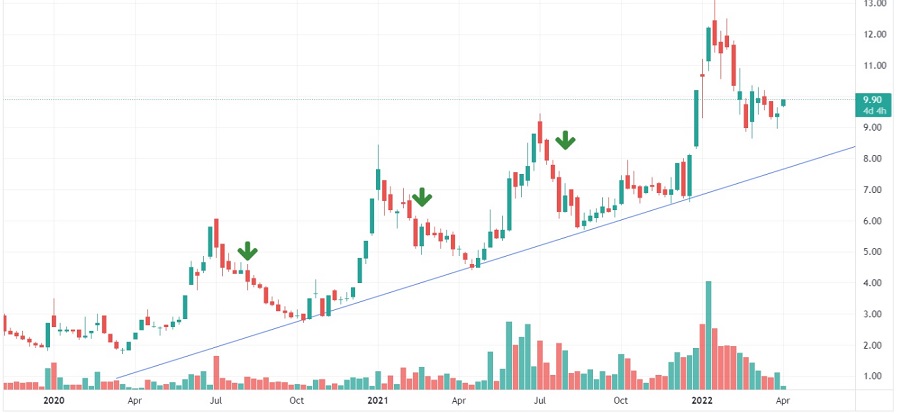
However, it's important to note that trendlines often take time to confirm. Three points of contact are required to validate a trendline.
As a result, it is recommended to implement a pullback strategy using a trendline at the third, fourth, or fifth point of contact. While trendlines are powerful tools for detecting pullbacks, it is crucial to exercise patience and allow sufficient time to confirm a truly reliable trend.
2. Pullback Strategy with MA
Moving averages are widely used indicators in technical analysis and can be effectively applied in a pullback strategy. Traders can choose from different periods, such as 20, 50, or 100, depending on their short or long—term trading style.
Short-term traders prefer shorter moving averages for quicker signals. However, it's important to be aware that shorter moving averages are more susceptible to noise and false signals.
On the other hand, long-term moving averages offer a slower-paced view and are less affected by noise. However, they may not capture short-term trading opportunities effectively.
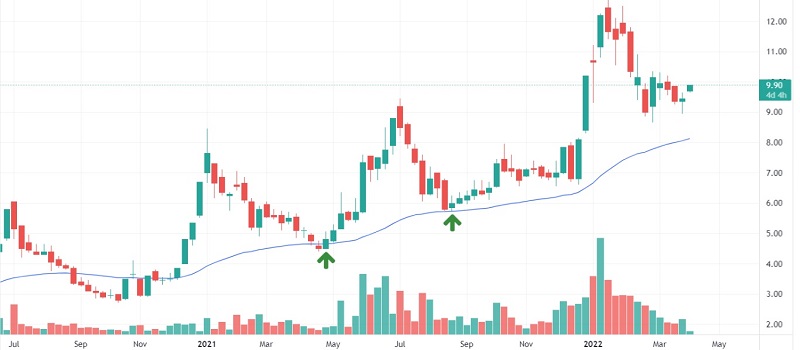
In the provided chart, the 50-period Exponential Moving Average (EMA) is shown acting as a support. Traders who initially missed a buy entry based on the bullish crossing signal can utilize pullback conditions when the price rebounds from the 50 EMA line.
3. Pullback Strategy with Fibonacci
When analyzing price movements across different assets, the use of Fibonacci levels has proven to be highly effective for implementing pullback strategies. Traders can employ this approach by patiently waiting for a new trend to establish itself and subsequently drawing Fibonacci lines A-B from the starting point to the endpoint of the trend wave. The identification of pullbacks can be done by observing point C on the Fibonacci retracement.
With a sufficient level of accuracy, it is commonly observed that prices tend to correct at either the 50% or 61.8% Fibonacci retracement level before resuming the prevailing trend, as illustrated in the provided chart.
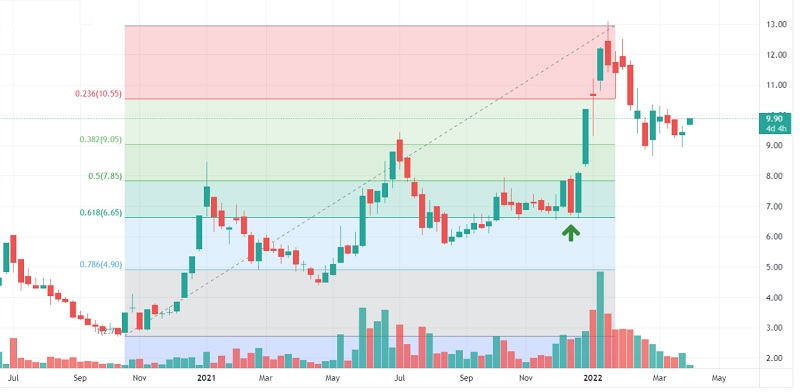
Combining Fibonacci retracements with moving averages can yield excellent outcomes. When the Fibonacci retracement coincides with the Moving Average, it indicates a higher potential for a pullback in that area.
4. Pullback Strategy After Breakout
A breakout occurs when the price surpasses a significant level, such as support, resistance, pivot, or a psychological level. This movement is often accompanied by a sharp increase or decrease in price as market participants await the price to breach the important level.
Nevertheless, traders tend to be cautious about false breakouts, which indicate that the price is once again moving within the range of the important level. To anticipate this possibility, many traders wait for a price pullback to confirm the legitimacy of the breakout.
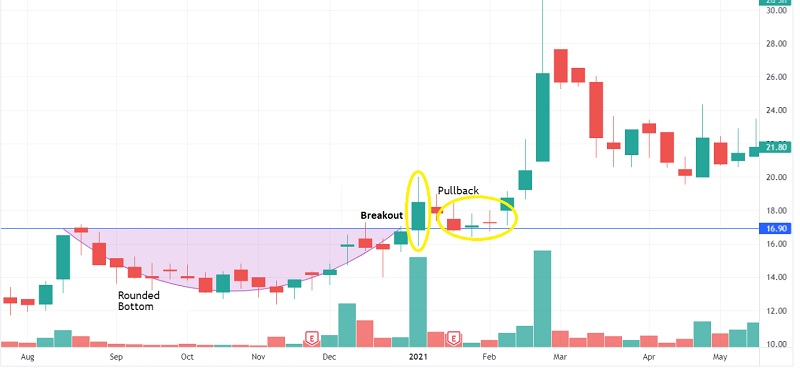
The fundamental concept is to await a pullback following a price breakout in order to strengthen the price's confirmation of the recently surpassed level. In simpler terms, if the market ascends after the price breaks through a significant resistance level, traders can wait for a buying opportunity when the price returns from the now-established support level.
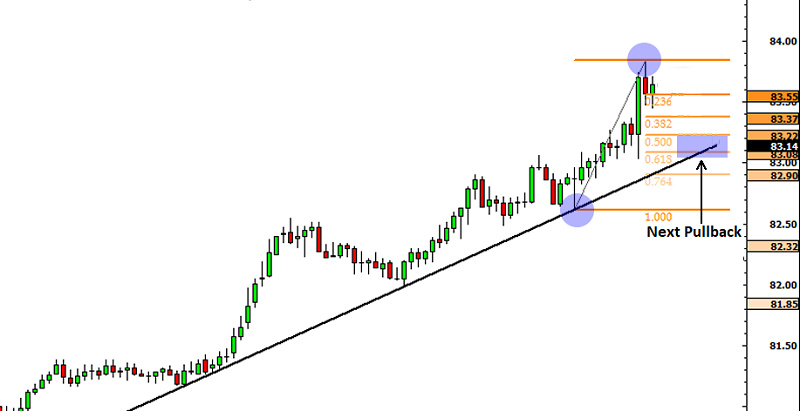
5. Pullback Combination with Trendline and Fibonacci
This pullback strategy combines trendlines and Fibonacci levels to achieve effective trading entries. The following steps outline the process:
- Identify the Trend: Determine whether the trend is bullish or bearish based on the price's high and low points.
- Select Time Frame: To minimize price noise, it is advisable to utilize 1 hour or longer time frame.
- Determine Peak Points: Find the most recent swing high and swing low points in the trend, and utilize them to draw Fibonacci retracements.
- Entry at Fibonacci Levels: Look for opportunities to enter trades when there is a retracement between the 50% and 61.8% Fibonacci levels. Traders can choose to enter at the 50% level or wait until the price reaches the 61.8% level before entering.
- Determine Exit: Set stop loss and take profit orders based on the latest swing points.
Here is an example illustrating the utilization of the trendline and Fibonacci combination technique to capitalize on pullbacks:
Bottom Line
Pullback strategies offer lucrative trading possibilities by leveraging temporary reversals within a trend. However, it's important for traders to acknowledge that each of the aforementioned strategies has its own pros and cons.
Hence, traders should be able to select a strategy that aligns with their understanding, trading style, and risk tolerance. Moreover, traders are strongly advised to consistently implement risk management techniques and execute trades based on a carefully devised trading plan.