Real-time Candlestick Update - Get the Latest Pattern
The data below is presented to make it easier for you to get candle updates in major pairs from various time frames. Thus, you don't need to manually interpret candlestick patterns on the chart to get trading signals.
| Time Frame | Indication | Candle Time |
|
NZD-USD
M30
|
|
Now |
|
|
||
|
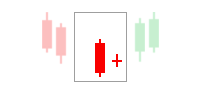
A one-candle pattern opened lower than the previous candle. The feature of the Inverted Hammer is that it has a small body and a long upper axis. The longer the upper axis and the smaller the body, the more significant the Inverted Hammer bullish signal. |
||
|
AUD-USD
Weekly
|
|
Now |
|
|
||
|
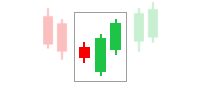
A two-candle pattern, the first candle is bearish and "engulfed" by the second bullish candle. This candle pattern indicates a weakening of the downtrend momentum which is taken over by bullish sentiment. |
||
|
USD-CHF
M30
|
|
Now |
|
|
||
|
A one-candle pattern that occurs at the top of an uptrend. The open creates a gap up from the previous candle, then closes near the low. A confirmation signal breach is obtained from the next candle that opens with a price below the Shooting Star body candle. |
||
|
NZD-USD
M30
|
|
Apr 26 2024 16:00:00 |
|
|
||
|
A one-candle pattern opened lower than the previous candle. The feature of the Inverted Hammer is that it has a small body and a long upper axis. The longer the upper axis and the smaller the body, the more significant the Inverted Hammer bullish signal. |
||
|
USD-CAD
H5
|
|
Apr 26 2024 10:00:00 |
|
|
||
|
A one-candle pattern opened lower than the previous candle. The feature of the Inverted Hammer is that it has a small body and a long upper axis. The longer the upper axis and the smaller the body, the more significant the Inverted Hammer bullish signal. |
||
|
AUD-USD
H1
|
|
Apr 26 2024 12:00:00 |
|
|
||
|
A three-candle pattern, the first candle is long bearish followed by the second candle that forms a gap down and has a small body. The third candle is a bullish candle confirming a reversal. The bigger of the third body candle reflects the accuracy of the bullish reversal signal. |
||
|
NZD-USD
H1
|
|
Apr 26 2024 12:00:00 |
|
|
||
|
A three-candle pattern, the first candle is long bearish followed by the second candle that forms a gap down and has a small body. The third candle is a bullish candle confirming a reversal. The bigger of the third body candle reflects the accuracy of the bullish reversal signal. |
||
|
AUD-USD
H1
|
|
Apr 26 2024 11:00:00 |
|
|
||
|
A two-candle pattern, it is consisting of a first long bearish candle at the end of the downtrend, the second candle has a small body with almost the same opening price compared to the closing price. If the second candle gets smaller, it means the higher the accuracy of the bullish signal. |
||
|
AUD-USD
H1
|
|
Apr 26 2024 11:00:00 |
|
|
||
|
This pattern consists of two candlesticks. The first candle is bearish and engulfs the second bullish candle. This pattern indicates that the downtrend is starting to lose momentum. Although it can increase signal accuracy, the axes of the second candlestick do not have to be in the range of the first candlestick. |
||
| Completed Patterns | ||
|
|
||
|
This pattern consists of two candlesticks. The first candle is bearish and engulfs the second bullish candle. This pattern indicates that the downtrend is starting to lose momentum. Although it can increase signal accuracy, the axes of the second candlestick do not have to be in the range of the first candlestick. |
||
|
|
||
|
A one-candle pattern that occurs at the top of an uptrend. The open creates a gap up from the previous candle, then closes near the low. A confirmation signal breach is obtained from the next candle that opens with a price below the Shooting Star body candle. |
||
|
|
||
|
A one-candle pattern that forms a gap up from the previous candle. The Hanging Man has a lower axis that is longer than the body. A bearish reversal signal is confirmed if the next candle is bearish or forms a gap down.Apa Itu Hanging Man? |
||
|
|
||
|
A one-candle pattern that closes near or at the highest price (High), thus indicating a weakening of the downtrend momentum. The longer the lower axis and the smaller the body candle, the higher the accuracy of the bullish reversal signal. |
||
|
|
||
|
A one-candle pattern that closes near or at the highest price (High), thus indicating a weakening of the downtrend momentum. The longer the lower axis and the smaller the body candle, the higher the accuracy of the bullish reversal signal. |
||
|
|
||
|
A two-candle pattern, the first candle is bearish and "engulfed" by the second bullish candle. This candle pattern indicates a weakening of the downtrend momentum which is taken over by bullish sentiment. |
||
|
|
||
|
A three-candle pattern, the first 2 candles form a Bullish Engulfing formation, while the third candle pattern is a bullish candle that confirms a bullish reversal. |
||
|
|
||
|
A one-candle pattern opened lower than the previous candle. The feature of the Inverted Hammer is that it has a small body and a long upper axis. The longer the upper axis and the smaller the body, the more significant the Inverted Hammer bullish signal. |
||


How is Heikin Ashi compared to the common candlestick chart?
For a candlestick chart, the current price signifies the latest transaction while on a Heikin Ashi chart, the current price is the latest calculation of the HA close price.
Continue Reading at The Complete Guide to Heikin Ashi EMA Strategy
How to formulate Heikin Ashi candlestick?
- HA Close: (High Low Open Close) / 4
- HA Open: (Prior HA Open Prior HA Close) / 2
- HA High is identified as the highest of three price levels seen as the prevailing high price, open price, and close price.
- HA Low is the lowest of three price levels seen as the prevailing low price, open price, and close price.
Continue Reading at The Complete Guide to Heikin Ashi EMA Strategy
Is H4 trading strategy with doji candlestick reliable?
Yes, it is. It has long been tried in the market, so its accuracy is fairly high. However, we also have to maintain strict money management and other risk-control measures. There's no 100% perfect setup, including this H4 trading strategy.
Continue Reading at H4 Trading Strategy with Doji Candlestick
What is Heikin Ashi candlestick?
Heikin Ashi is a variation of a candlestick chart that is calculated differently. Normal candlestick charts represent the opening and closing prices with the thick part of the candle (known as the real body) while the high and low prices are represented with upper and lower shadows. The patterns represent exact values of open, high, low, and close prices (OHLC) during a particular time frame without any form of data manipulation.
Meanwhile, the OHLC values of Heikin Ashi are based on the average prices of both current and prior time frames, hence, making the charts smoother to read along and allowing traders to spot the prevailing trend.
Continue Reading at The Complete Guide to Heikin Ashi EMA Strategy
Articles About Candlestick
