 Dedicated FREE FOREX VPS
 Free FOREX Virtual Private Server
 MT4 Demo Contest, Get $500
 Sign Up for an Account, Claim 60% Deposit Bonus
 Free MT4/MT5 VPS 2024
 Send E-mail and Get Free Merchandise
 $1K Refer a Friend Bonus for Pepperstone Pro clients
 Maximize Your Earnings with 100% Deposit bonus
 Trade to Win, $5,000 Monthly Demo Contest
 Claim 30% + 15% Deposit Bonus from LiteFinance
Between price action, trend, and volume indicators, which tools are best to identify trend reversals? Why finding the best tool is important?
Trend reversals are the reference point for trend traders when executing market orders. If a trend starts to move in the opposite direction, this is a signal for them to either open or close their positions. There are many trend trading strategies out there, and each one of them will tell you how to ride the trends as long as possible. However, it is also important to stress that entering or exiting the market must be done only after trend reversals occur.
Thus, the best way to keep in touch with the trends is by applying the right tools for identifying a change in the price movement. Knowing that trend reversals must be confirmed first, you need to be very discerning as the possibility of false signals always exists.
This article will discuss nine of the best tools to identify trend reversals. They can be classified into the following types:
- Price action indicators
- Trend indicators
- Volume indicators
As is the case with most trading strategies, combining different types of tools will give you a stronger indication of what is happening on the market. In other words, it is completely fine if you want to mix and match these tools.
Contents
How to Spot Trend Reversals Using Price Action
Nobody can deny the importance of price action. When the price moves upward, it moves upward. That said, you should be cautious as price action can fool you too with its seemingly sudden and random movement.
Swing Pivots
Swing pivots are drawn by connecting the swings of the price. By plotting swing pivots on the chart, you will see the price move in an ascending or descending line. It is never straight. Let's take a look at the chart below.
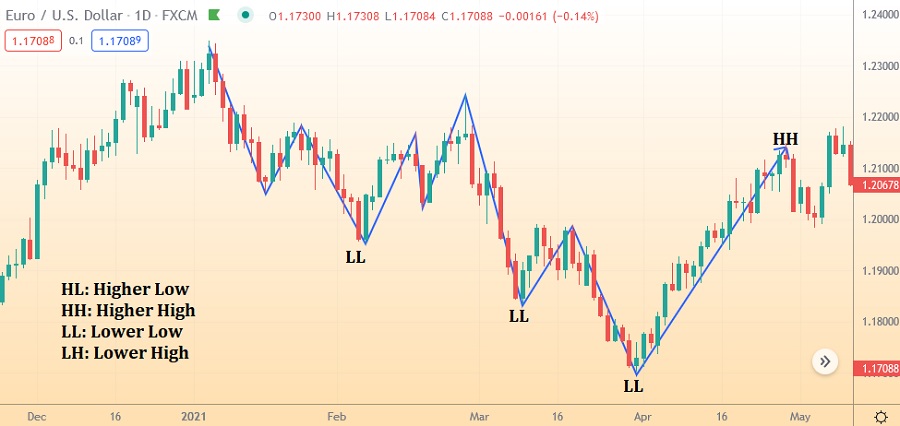
Lower lows signal a downtrend as the lines move to the downside, while a higher high indicates an uptrend can be seen by the ascending line. That is about the easiest way to interpret swings. Obviously, it won't be this easy in a real market. Thus, you need to always practice to perfect your chart reading.
Trend Lines
Trend lines are very popular among forex traders. It is not a coincidence, as trend lines are simple and easy to use and they give you a clear picture of how a trend goes. The problem is, there are many ways to draw trend lines. It is pretty common to have different trend lines on the same price action.
We advise you not to worry too much about which trend lines are correct and which are not. The key is to remain consistent with your method and carry on. Obviously, you should be objective and avoid drawing misleading trend lines just to justify your trading decision.
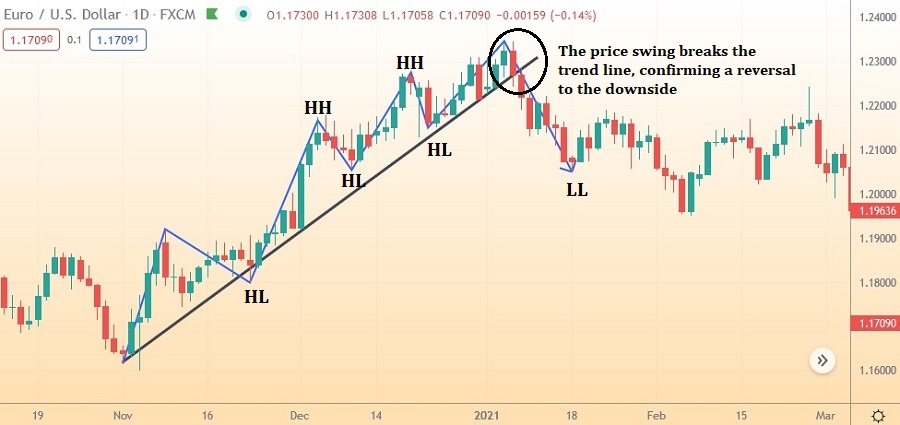
In the chart above, we use a combination of trend lines and swing pivots to spot a trend reversal. Both tools reinforce or overrule each other.
In this example, we can see there are several bullish swing pivots and the trend line signals the trend is still ongoing. Thus, if you have an open bullish position, you can continue riding the uptrend. Exit the market once the price swing breaks the bullish trend line.
Price Channels
To get price channels, a parallel line must be plotted from a trend line. A channel phase, during which two trend lines above and below the price run in parallel, is a stage where most trends can be identified. When this happens, the price will move between the two lines. You can identify trend reversals by looking for breakout attempts of the channel line. Below we provide an example.
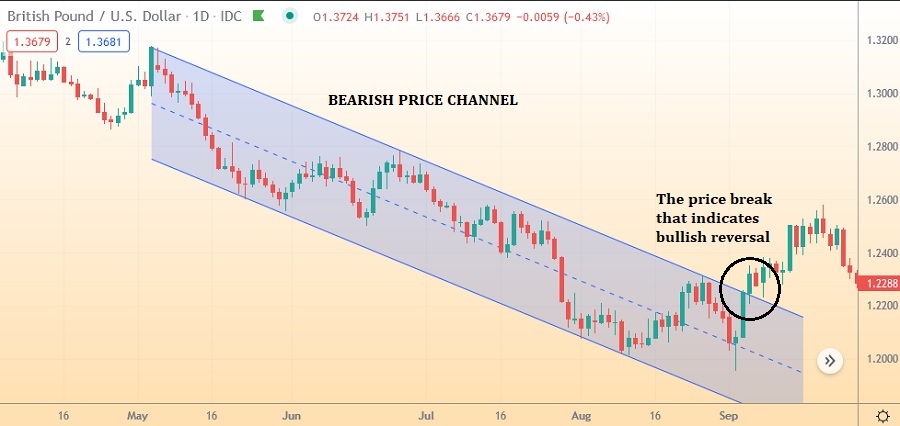
Unlike the two previous tools, price channels are leading indicators, meaning that they can predict potential reversals. This makes price channels the perfect tool for aggressive trend traders as they can open or close trading positions before the reversal even starts. But if you are more conservative, you can confirm reversals first by waiting for a break from one of the trend lines.
See Also:
How to Spot Trend Reversals with Trend Indicators
Trend traders love their trend indicators. Versatile and wide-ranging, trend indicators provide traders with various reversal signals that can appear automatically on the chart without much plotting like what price action tools need.
Moving Averages (MAs)
Moving Averages are used by beginners and seasoned traders alike. Two of the most utilized MAs for spotting reversals are the Simple Moving Average (SMA) and the Exponential Moving Average (EMA). Both are lagging indicators, but EMAs put more weight on recent prices. Therefore, the line is more easily affected by sharp price action as compared to that of the SMA's.
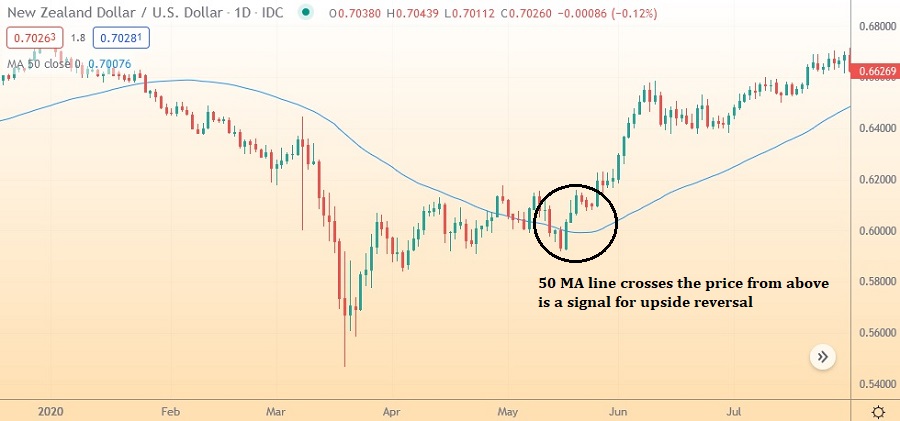
The chart above is one of the methods of applying MA. It is quite simple, actually. You only need to activate the indicator on the chart and observe the direction of the MA to spot any reversal. A 50 MA is a good indicator for beginners. As for shorter trends, you may use a shorter one such as 20 MA.
Now, if you have passed the novice stage, you should go to the next level by combining two or even three MAs with different periods. In this case, trend reversals are signaled by a crossover between the MAs. Here is the rule of thumb: If the shorter period MA crosses above the longer period MA, this indicates an uptrend will start. Oppositely, a downtrend is signaled by the shorter period MA crossing below the longer one.
Donchian Channel
The Donchian channel consists of an upper band, lower band, and middle line. The upper band is drawn from the highest high in a particular period, while the lower band is from the lowest low in the same period. The middle line is the average between the two bands.
From the chart above, the lower band flatten on several occasions. When this horizontal line is coupled with the price "pushing" the lower band, this is usually a signal for traders to go short. To confirm a reversal, you can observe whether the price has broken the middle line.
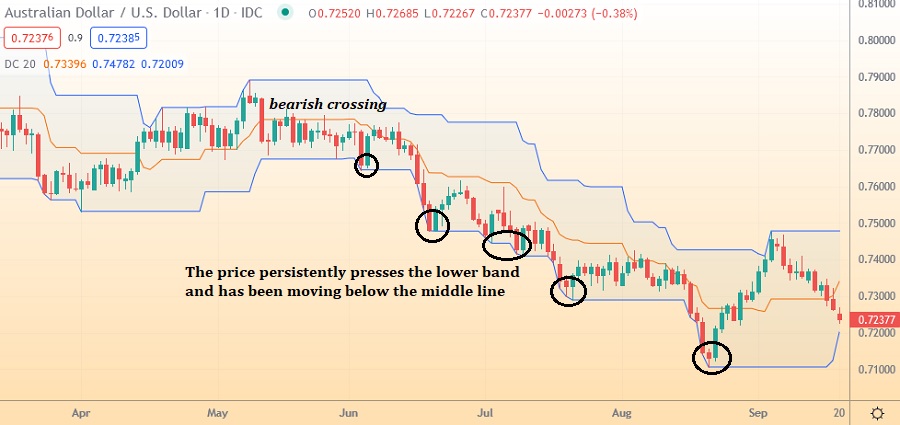
One of the main criticisms of the Donchian Channel is the fact that traders can pick a period arbitrarily. Instead of generating profits, traders may potentially fall victim to unreliable signals.
Moving Average Convergence Divergence (MACD)
The MACD uses the 9 EMA, 12 EMA, and 26 EMA in which the 9 EMA acts as the signal line and the subtraction of the 26 EMA from the 12 EMA serves as the MACD line. When plotted alongside price action, this indicator can be reliable to spot trend reversals.
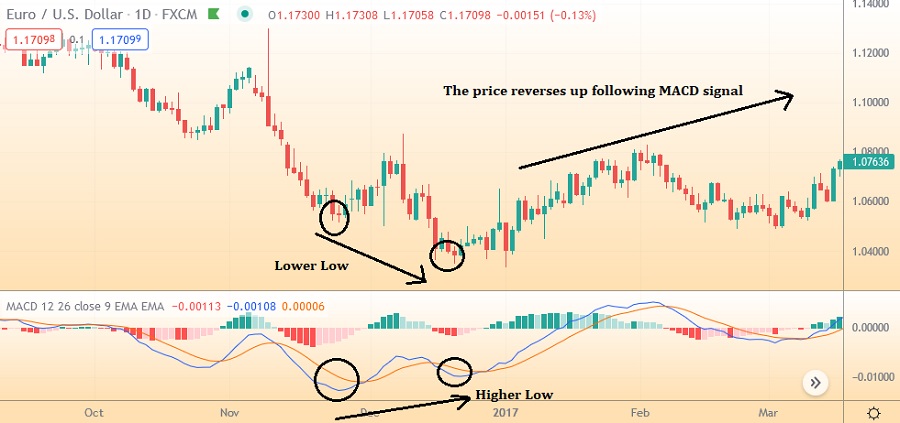
The chart above shows a lower low appears on the price action, creating a bearish situation. But when we take a look at the MACD, it actually moves against the price. Instead of moving downward, the MACD line, as well as the signal line, moves to the upside. A price divergence like this is a good indication that a new bullish trend will begin. As the MACD is calculated from EMAs, we can observe a crossover between the MACD and signal lines and use it as a confirmation for trend reversals.
See Also:
Spotting Trend Reversals by Volume Indicators
Volume indicators can be unreliable at times as they are not directly related to price action. Still, these tools are very useful for confirmation, providing traders the perfect timing to make an early entry or exit.
On Balance Volume (OBV)
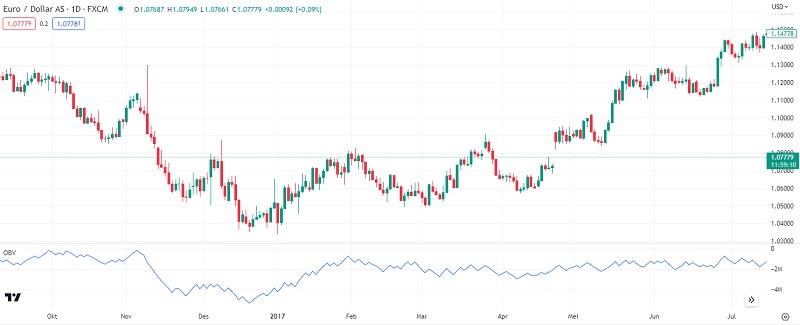
As a cumulative indicator, OBVs do not depend on the lookback period but move in accordance with the polarity of each price bar. One condition to follow is that you should just be thoughtful of its direction and disregard its values.
A bullish trend is strong when the price and OBV are rising. When the OBV starts to lose its momentum, the trend might be ending soon. The opposite applies to a bearish trend.
Volume Oscillators
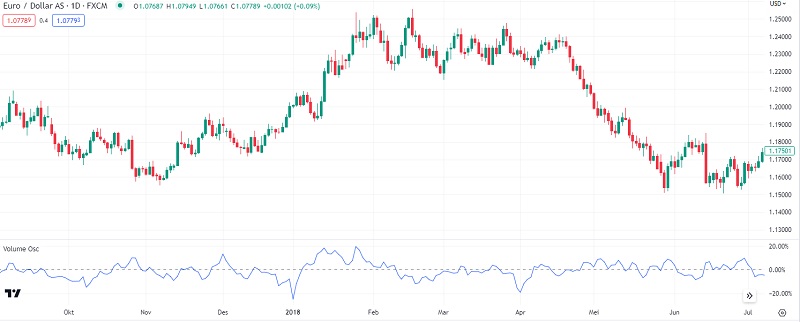
Volume oscillators work like MACD and RSI, but they are focused on volume. That's why you must not read them the way you read the traditional oscillators. In volume oscillators, positive values mean strong trends, and negative values identify weak trends. For instance, when the downtrend is decreasing gradually in volume strength, the upward moves are decreasing in volume weakness. Then, a burst of positive values would appear and mark the start of a new uptrend. This chart is not that easy to read. But with practice and experience, you will get to master it.
Extreme Volumes
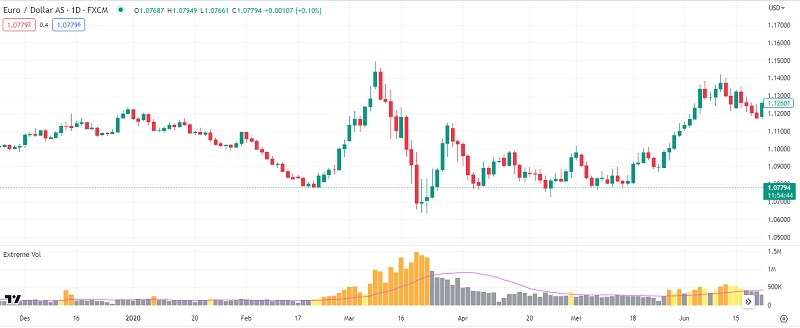
Extreme volumes occur due to traders entering the market in a large numbers after a new trend appears. For example, traders rush to open long positions after an uptrend begins. As a result, the uptrend becomes exhausted as there are no more volumes to buy. In this situation, the price will start moving downward. The same scenario also applies to uptrend reversals.
To identify at what level a volume can be considered extreme, you can use technical indicators that can display overbought and oversold levels on the volume bars. When the traders react to a downtrend by selling into the market, wait until the market goes beyond the oversold level and gets overtaken by an uptrend reversal.
Final Words
It is not far-fetched to say that spotting trend reversals is the most important aspect of trend trading. That's why you must equip yourself with reliable tools and indicators. Some of these are utilized to predict reversals, while others confirm them. If you are not into aggressive style, try entering a small position after your tools predict a trend reversal. Then, wait for confirmation from other tools before committing your position to its full size.


2 Comments
Gordon
Mar 19 2024
The article mentioned that in order to establish price channels, you need to draw a parallel line from a trend line. During the channel phase, which is characterized by two trend lines running parallel above and below the price, most trends can be recognized. During this phase, the price tends to oscillate between these two lines. Trend reversals can be identified by observing attempts of the price to break out of the channel lines. I found the concept of price channels intriguing due to its simplicity as described in the article. Consequently, I'm curious: does a breakout always occur when the price breaches the price channel? Additionally, could you guide me on how to create a price channel in Metatrader 4?
Yerin
Mar 21 2024
So, about your question on price channel breakouts, here's the deal: not every time the price breaks the channel, you're looking at a breakout. Breakouts happen when the price makes a solid move beyond the channel lines, suggesting a possible change in the trend. But watch out for false breakouts, where the price briefly jumps out of the channel but then bounces back in. They're pretty common, so keep an eye out for them.
Now, if you wanna create a price channel on MetaTrader 4 (MT4), it's a piece of cake. Just grab the trendline tool and draw two lines parallel to each other above and below the price action, capturing the trend. MT4's got all the tools you need for this – you can find them up in the toolbar or use the shortcut commands. Once you've got those lines drawn, you're all set to track the price movement within the channel and keep an eye out for any potential breakouts or reversals. Easy peasy!