 Dedicated FREE FOREX VPS
 Free FOREX Virtual Private Server
 MT4 Demo Contest, Get $500
 Sign Up for an Account, Claim 60% Deposit Bonus
 Free MT4/MT5 VPS 2024
 Send E-mail and Get Free Merchandise
 $1K Refer a Friend Bonus for Pepperstone Pro clients
 Maximize Your Earnings with 100% Deposit bonus
 Trade to Win, $5,000 Monthly Demo Contest
 Claim 30% + 15% Deposit Bonus from LiteFinance
Apart from the common Moving Average, there are other 4 technical indicators you could rely on in trend trading. What are they?
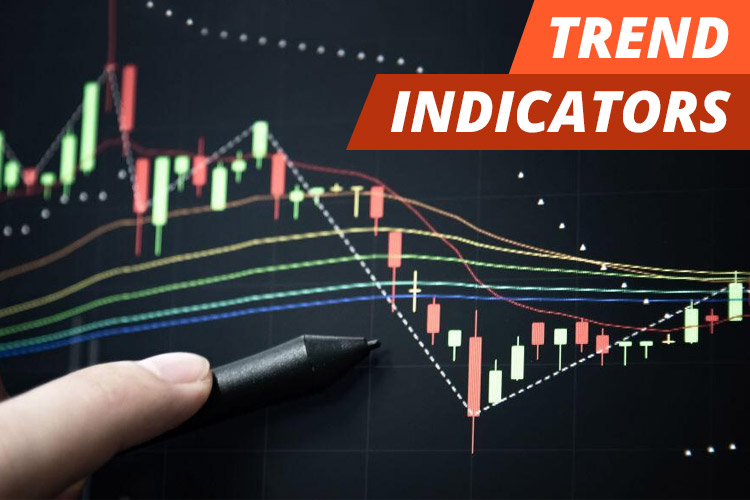
Trend indicators are technical analysis tools that help traders identify the current trend's direction and potential reversals. They are based on historical price and volume data and can be used in any time frame, from intraday to weekly or monthly.
There are many different trend indicators available, but some of the most popular and reliable ones that we're going to discuss here are:
- Price Action
- Moving Average
- Parabolic SAR
- MACD
- Ichimoku Cloud
Whether you are an experienced or a beginner trader, knowing how to use trend indicators is essential to make sound trading decisions and achieve your trading goals.
1. Price Action
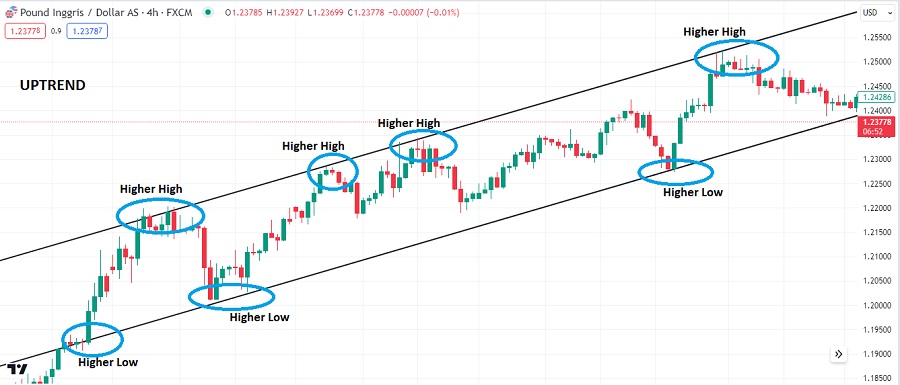
Price action is the study of the price over time. It is one of the oldest and most effective forms of technical analysis for trend identification. To use price action as a trend indicator, you need to look for the following:
- Higher highs and higher lows for an uptrend.
- Lower highs and lower lows for a downtrend.
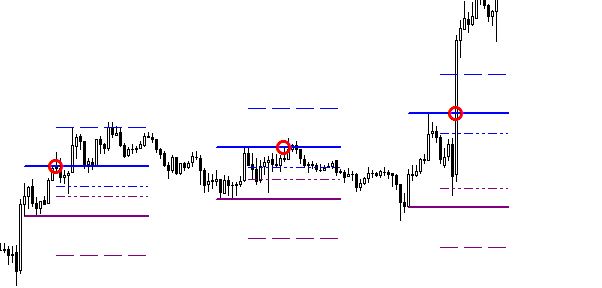
- Support and resistance where the price will likely stop and reverse. You can use these levels to identify potential trend reversals.
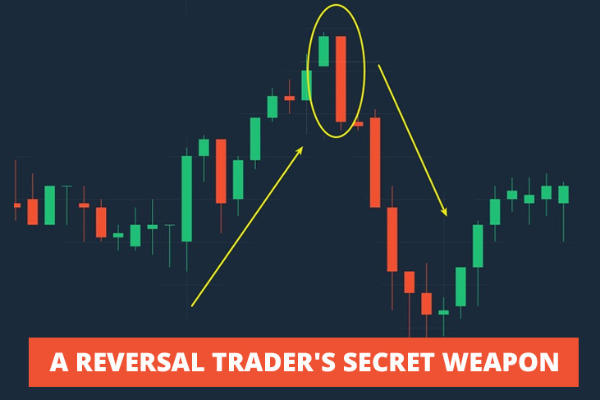
The following is an example of using price action to detect an uptrend:
Price action analysis is a popular and effective way for trend identification in the financial markets for several compelling reasons:
- Simplicity: Price action analysis is based on the idea that all relevant market information is reflected in the price itself. It doesn't rely on complex mathematical formulas or indicators, making it accessible to traders and investors of all experience levels.
- Versatility: Price action can be applied to any financial market, including stocks, forex, commodities, and cryptocurrencies. Traders can use the same principles across different assets, enhancing its versatility.
- Real-Time Information: Price action provides real-time information about market sentiment and direction. Traders don't have to wait for lagging indicators to catch up; they can respond to price movements as they happen.
- Historical Context: Price action considers historical price levels, such as support and resistance, which can help traders identify areas where price reversals or trend continuations are likely to occur.
Overall, price action analysis is popular and effective for trend identification because it provides a straightforward way to interpret market dynamics without setting any additional tools or indicators. It empowers traders to understand price movements better and adapt to changing market conditions, ultimately increasing their chances of success in the financial markets.
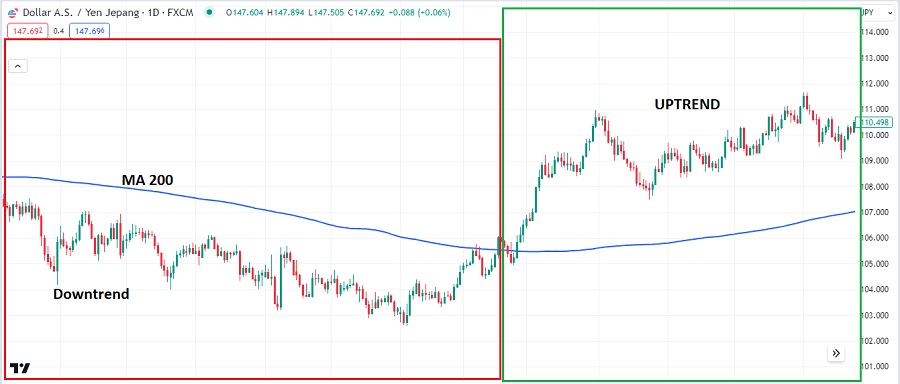
2. Moving Average
A Moving Average is a technical indicator showing the average price over time. It is one of the most popular and effective trend indicators available. To use Moving Averages for trend identification, you can look at the position of the Moving Average:
- The trend is bullish if the price is above the Moving Average line and tends to show a significant upward trend.
- The trend is bearish if the price is below the Moving Average line and tends to indicate a downward trend.
Not only for trend identification, the Moving Average can also detect a change in trend direction. The strategy combines a short-term Moving Average and a long-term Moving Average.
For example, you could use a 10-day Moving Average (MA 10) and a 50-day Moving Average (MA 50).
- A bullish signal is if the 10-day Moving Average (MA 10) crosses the 50-day Moving Average (MA 50) from below. This also indicates a change in trend from a downtrend to an uptrend.
- Conversely, the signal is bearish if the 10-day Moving Average (MA 10) crosses the 50-day Moving Average 50 (MA 50) from above. It indicates there is a change in trend from uptrend to downtrend.
Moving Averages (MAs) are a popular and effective way for trend identification because they are:
- Simple to understand and calculate. MAs are computed by averaging the closing prices over a specified period. For example, a 50-day MA is calculated by adding up the closing prices of the last 50 days and dividing by 50.
- Effective at smoothing out price data. MAs help to smooth out short-term price fluctuations, making it easier to identify the underlying trend.
- Versatile and can be used in any time frame. MAs can be used in intraday to monthly charts. This makes them useful for both short-term and long-term traders.
- Generate signals. MAs can generate both buy and sell signals, depending on their interpretation. For example, a trader might open a buy trade when the price exceeds the 50-day MA or sell when it moves below its 50-day MA.
- Dynamic Support and Resistance. Moving Averages can act as dynamic support and resistance levels. The Moving Average can support an uptrend while acting as resistance in a downtrend.
3. Parabolic SAR
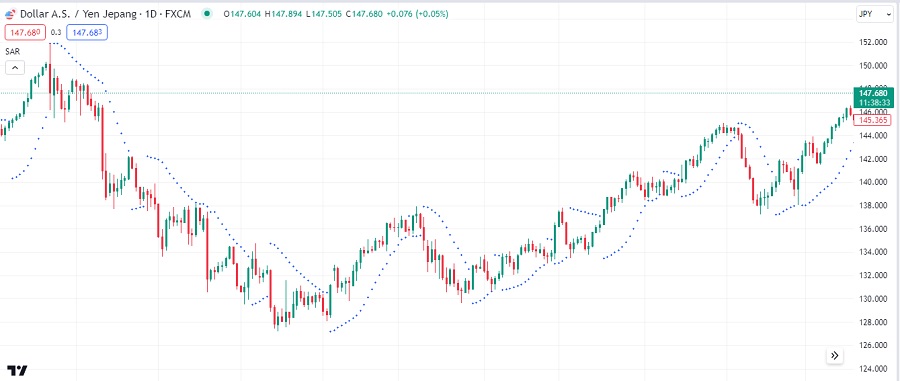
The Parabolic Stop and Reverse (SAR) is a technical indicator primarily used for trend identification and to provide potential entry and exit points in the financial markets. On the trading chart, the Parabolic SAR will appear as a series of dots above or below the price, depending on the direction of the trend.
- If the dots are below the price, it indicates an uptrend.
- If the dots exceed the price, it indicates a downtrend.
- The closer the dots are to the price, the stronger the trend.
Parabolic SAR is popular and effective for trend identification because:
- Trend-following. Parabolic SAR is designed to identify a trend's direction and stay in that trend until it shows signs of reversing.
- Self-adjusting. This indicator will automatically adjust its parameters as the market changes. This helps the indicator to stay in the trend and avoid false signals.
- Versatile. Parabolic SAR can be used on any timeframe and for any asset class.
- Dynamic Stop Loss. Traders can place a stop-loss order slightly below the SAR point, allowing for potential profit protection if the trend reverses.
4. MACD
MACD (Moving Average Convergence Divergence) is a trend-following momentum indicator that shows the relationship between two exponential Moving Averages (EMAs) of a security's price. The MACD line is calculated by subtracting the 26-period EMA from the 12-period EMA. A 9-period EMA of the MACD line is then plotted as a signal line.
MACD can be used to identify trends in any market, including stocks, forex, and cryptocurrencies. The indicator can be used on any time frame but is generally more effective on higher time frames.
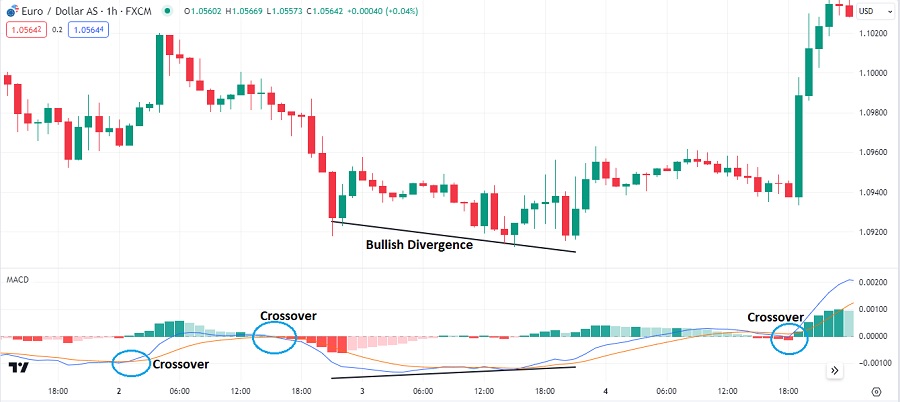
Traders use the MACD to identify trend direction, strength, and reversals. Here are some of the most common ways to identify trends with the MACD:
- Crossovers: When the MACD line crosses above the signal line, it is considered bullish and indicates a transition from downtrend to uptrend. When the MACD line crosses below the signal line, it is the opposite.
- Divergence: Divergence occurs when the MACD line and price move in opposite directions. This can be a sign that a trend reversal is imminent.
To make it easier, please see the image below:
MACD is popular and effective for trend identification due to the following reasons:
- Trend Strength. Besides trend direction, MACD includes a histogram that visualizes the difference between the MACD and signal lines. The histogram helps traders gauge the strength of a trend. A rising histogram suggests increasing momentum, while a falling histogram may indicate weakening momentum.
- Confirmation. MACD can be used with other technical indicators to confirm trade signals. Many traders combine MACD analysis with other tools like support and resistance levels, trendlines, or other oscillators to increase the reliability of their trading decisions.
- Customization. Traders can customize the MACD by adjusting its parameters, such as the length of the Moving Averages and the smoothing factor. This flexibility allows traders to adapt the indicator to market conditions and trading strategies.
See Also:
5. Ichimoku Cloud
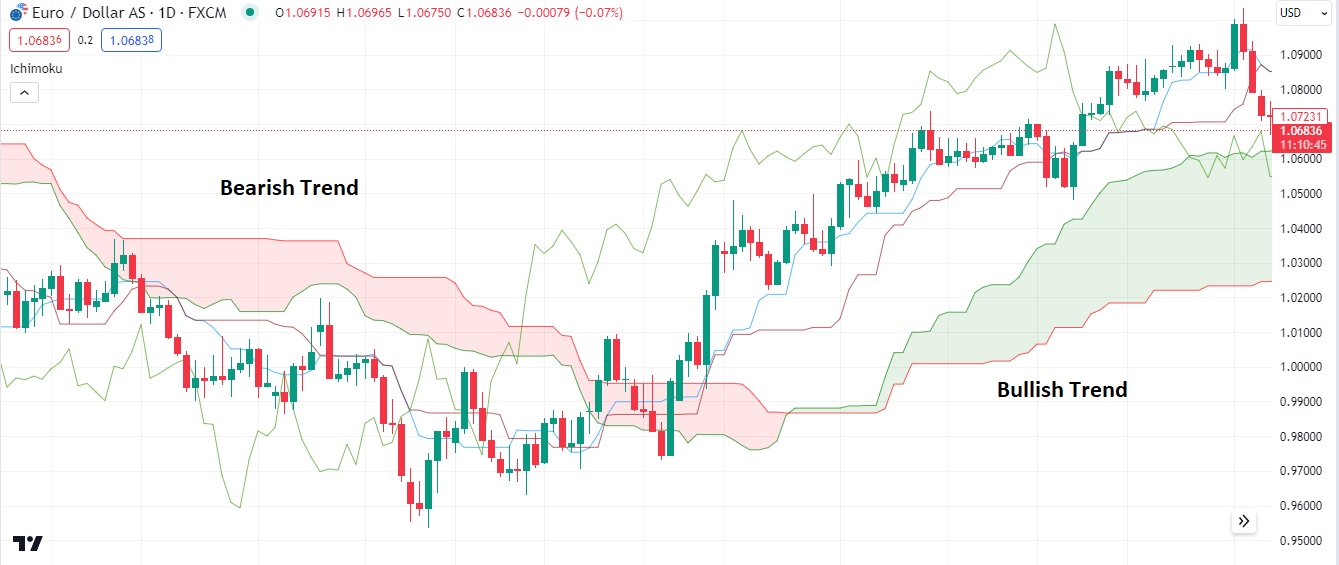
The Ichimoku Cloud, or Ichimoku Kinko Hyo, is a comprehensive technical analysis tool from Japan. It is helpful for trend identification and a broader view of support and resistance levels.
To read the trend using the Ichimoku Cloud, consider the price position relative to the cloud. If the price is above the cloud, the trend is bullish. If the price is below the cloud, the trend is considered bearish. If the price is inside the cloud, the trend is considered neutral. For more details, please see the image below.
The Ichimoku Cloud is popular and effective for trend identification because it is:
- Comprehensive. The Ichimoku Cloud is a composite indicator considering price, time, and momentum. This makes it a more comprehensive and reliable indicator for trend identification than many other technical indicators.
- Versatile. The Ichimoku Cloud can be used anytime, from intraday to monthly charts. This makes it useful for both short-term and long-term traders.
- Easy to interpret. The Ichimoku Cloud is relatively easy to interpret, even for beginner traders. The cloud provides a visual representation of the trend, and the other indicator components can be used to confirm the trend and identify potential trend reversals.
While the Ichimoku Cloud is a powerful tool for trend identification, it's important to note that it is not infallible, and false signals can occur. Traders often use it with other technical indicators and analysis methods to enhance their trading strategies.
Trading indicators serve many purposes, including trend detection and specific strategy needs, such as 15-minute scalping. To learn more about it, read "What is the Best Indicator Combo for 15-Minute Chart?"


2 Comments
Nasir Ali
Oct 8 2023
best macd settings for day trading
Kelly
Oct 8 2023
best macd settings for day trading