 Dedicated FREE FOREX VPS
 Free FOREX Virtual Private Server
 MT4 Demo Contest, Get $500
 Sign Up for an Account, Claim 60% Deposit Bonus
 Free MT4/MT5 VPS 2024
 Send E-mail and Get Free Merchandise
 $1K Refer a Friend Bonus for Pepperstone Pro clients
 Maximize Your Earnings with 100% Deposit bonus
 Trade to Win, $5,000 Monthly Demo Contest
 Claim 30% + 15% Deposit Bonus from LiteFinance
Out of all the chart patterns available, the rectangle pattern is considered accurate for trading. It signifies a brief pause in the current trend, after which the trend is expected to continue in the same direction.
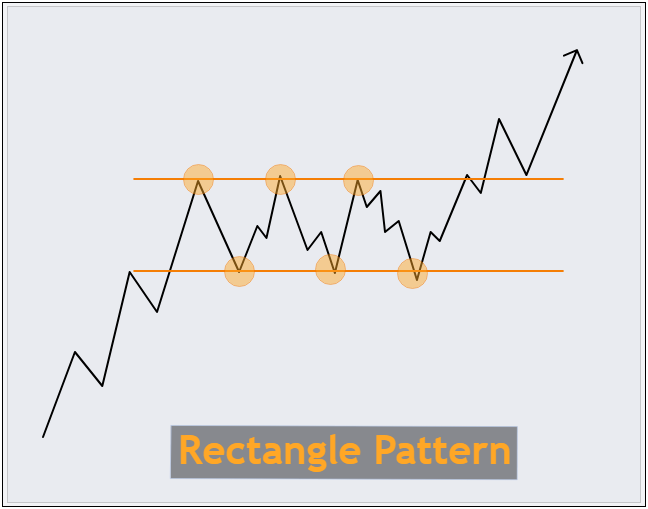
The rectangle pattern is a price pattern that moves back and forth within a specific range. It is characterized by horizontal lines that represent levels of support and resistance. These levels create a rectangular or box-like shape on the price chart, hence the name "Rectangle Pattern."
Rectangle patterns are like road signs for traders. They usually tell us that the current trend will keep going after taking a little break, but sometimes they can suggest that the trend might change its course.
Contents
How to Identify Rectangle Price Pattern
A rectangle pattern in trading has the following key characteristics:
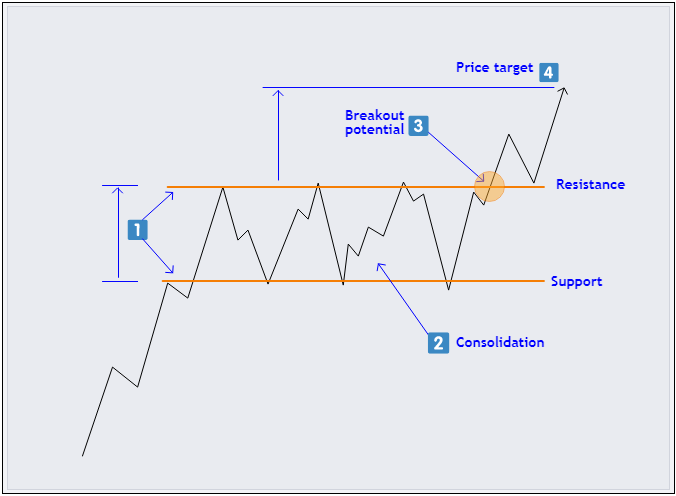
- Horizontal Lines: It's defined by parallel resistance (upper) and support (lower) lines.
- Consolidation: Prices move sideways, showing market indecision.
- Breakout Potential: Traders watch for a price breakout from the pattern.
- Price Targets: The height of the pattern used to estimate potential price targets after a breakout.
Another crucial aspect to keep in mind when dealing with rectangle patterns is trading volume. In these patterns, the trading volume is usually lower than when prices are clearly trending up or down.
This happens because there's a balance between buyers and sellers, which makes prices move sideways. Paying attention to volume will help you avoid false breakouts, which we will explain later.
Types of Rectangle Patterns
There are two types of rectangle patterns, namely bullish rectangle and bearish rectangle.
Bullish Rectangle
As the name suggests, the bullish rectangle pattern is a rectangular pattern that signals an upward or bullish price movement. When this pattern breaks out of the resistance, it can be seen as a chance to buy in the market.
The bullish rectangle pattern can act as either a continuation or a reversal pattern.
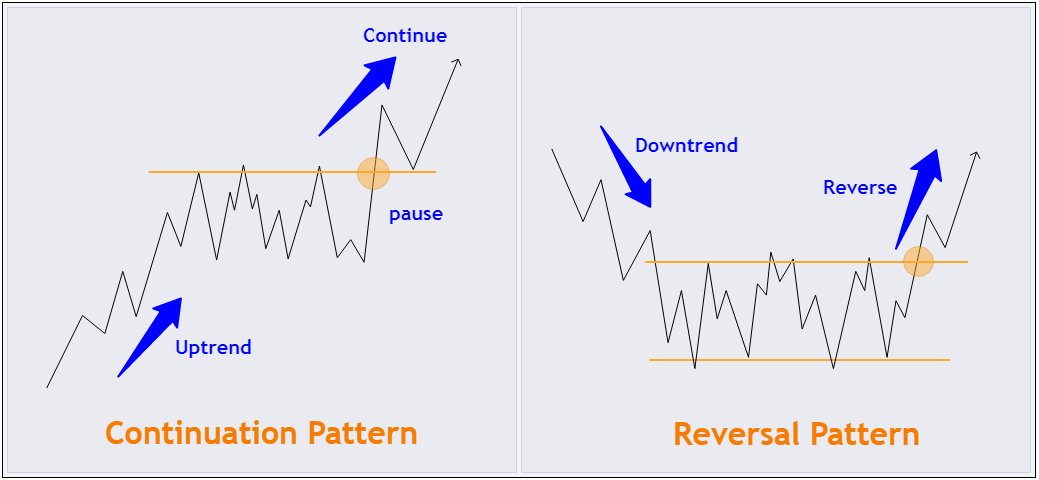
In a continuation pattern, the price was previously going up, and then it takes a pause during the rectangle formation. Afterward, there's a legitimate breakthrough of resistance, hinting at a strong possibility for the price to keep rising.
Conversely, in a reversal pattern, the price used to be on a downward trend. Then, it forms a rectangle pattern and eventually breaks through the resistance level.
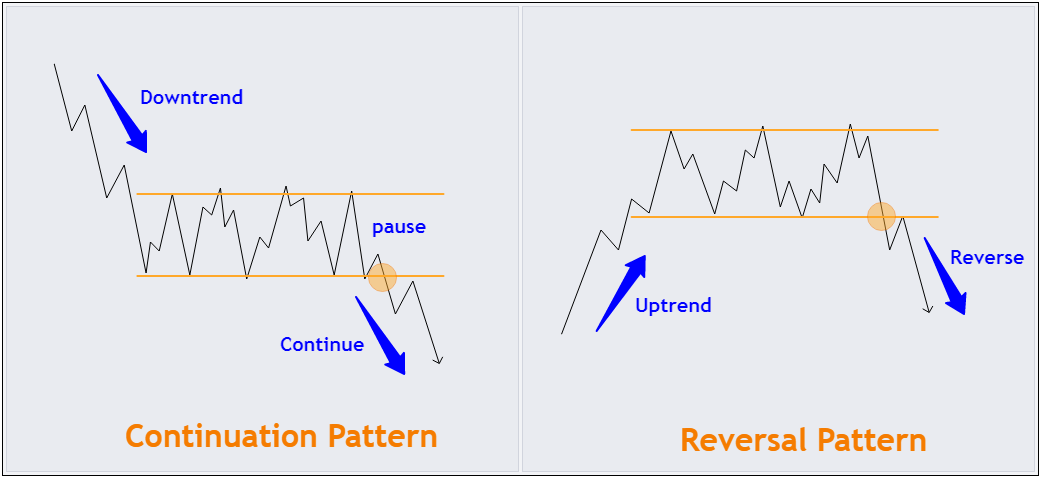
Bearish Rectangle
The bearish rectangle pattern is basically the opposite of the bullish one. It suggests the possibility of prices going down after breaking the support level. So, it's a chance to sell in the market.
Just like the bullish rectangle pattern, the bearish one can be either a continuation or a reversal pattern.
How to Trade Rectangle Pattern?
There are two ways to trade the rectangle pattern, which are the breakout and the pullback methods.
Breakout Strategy
The breakout method is the most commonly used approach in trading rectangle patterns. In this approach, you jump into your trade right after a solid breakout from the rectangle pattern.
Here are the simple steps to put this method into action.
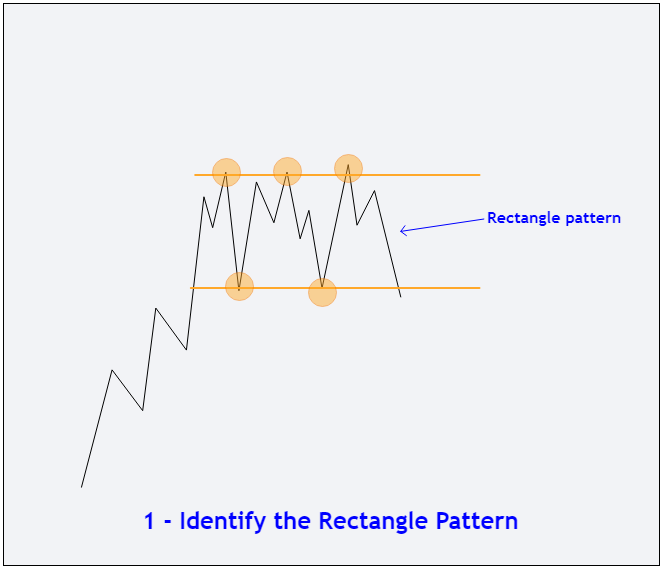
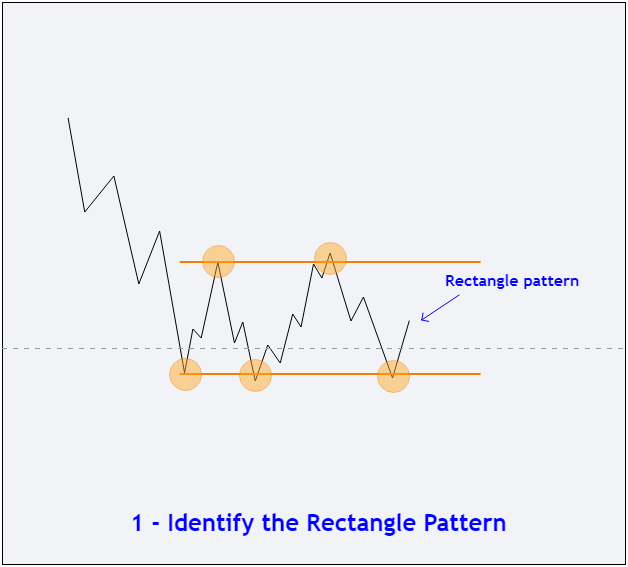
- Identify the Rectangle Pattern: Start by finding a price that's going through a consolidation phase. Look for at least two horizontal tops and two bottoms.
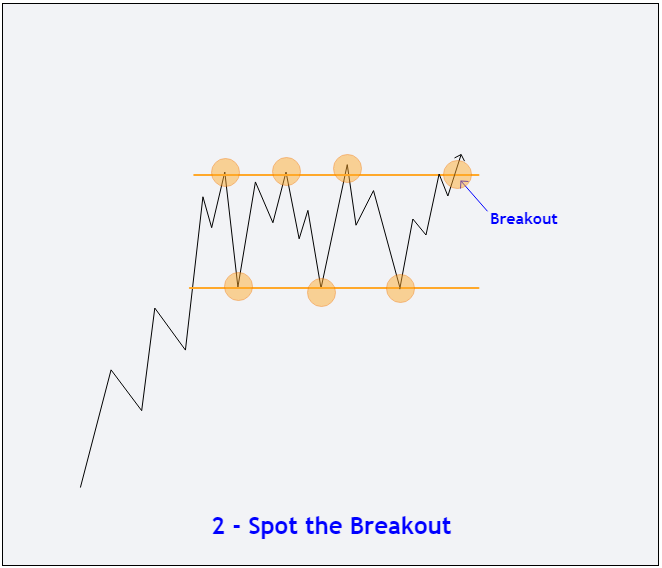
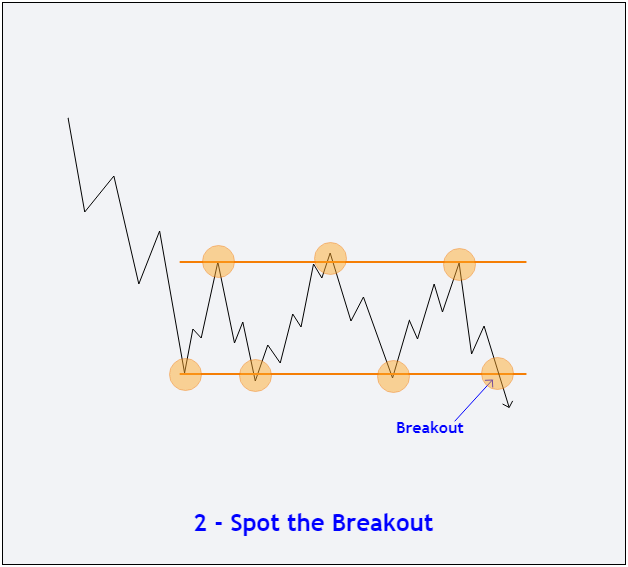
- Spot the Breakout: Watch for the price to break through the rectangle's support or resistance line.
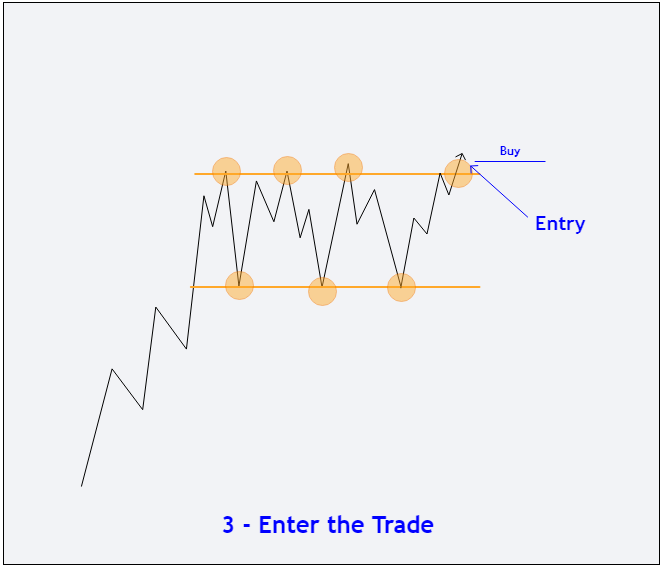
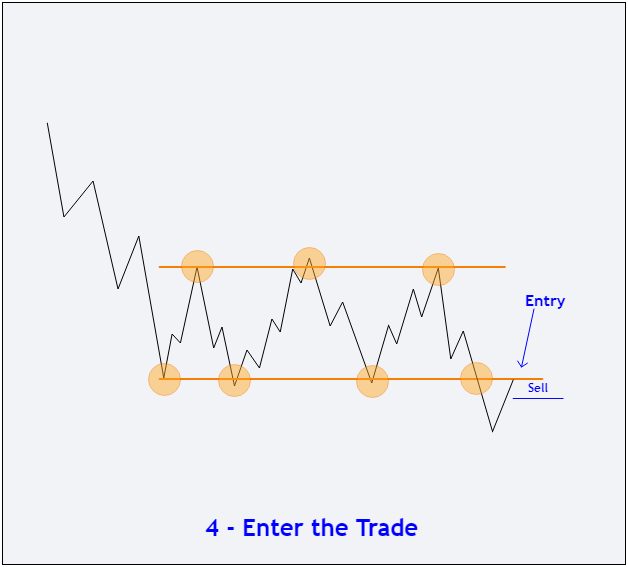
- Enter the Trade: Once you see a breakout, enter a trade in the direction of that breakout.
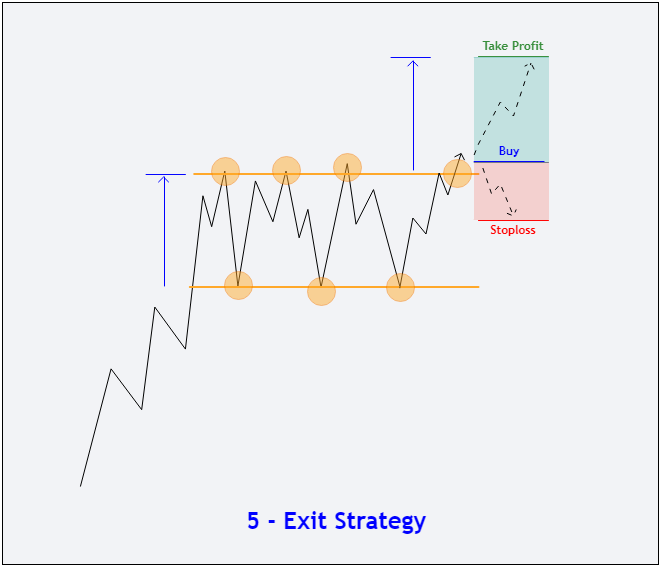
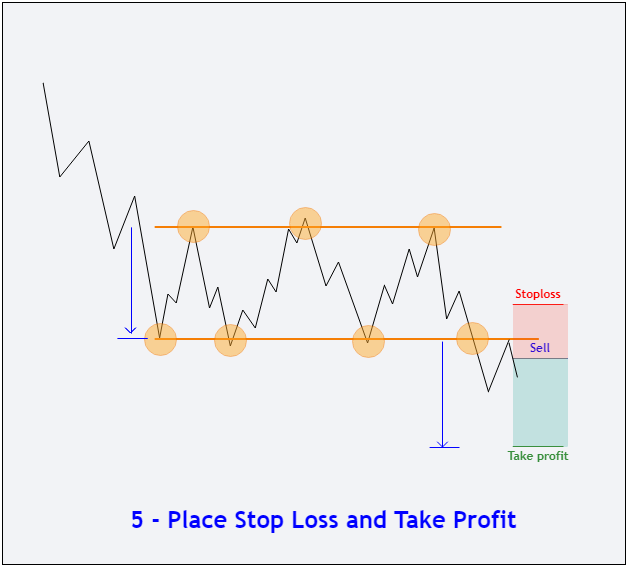
- Protect Your Trade: Place a stop loss in the middle of the rectangle's range or below the recent low price. For the take-profit target, aim for at least the size of the rectangle pattern.
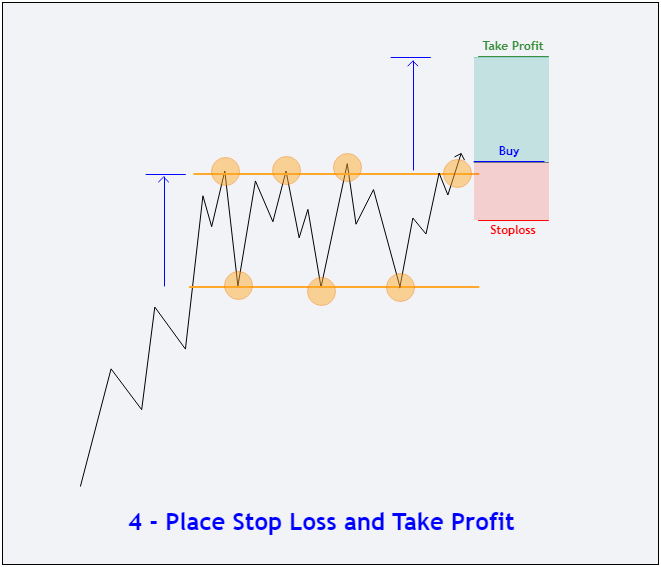
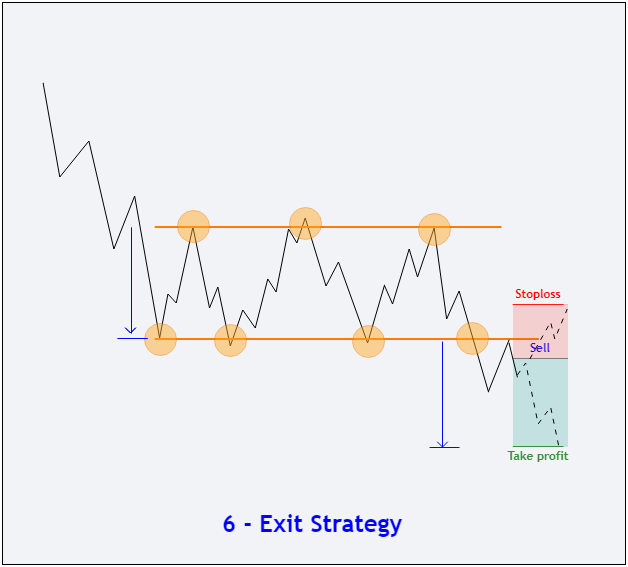
- Exit Strategy: Hold onto the trade until the price movement covers at least the pattern's size. If market conditions allow, you can aim for more profits with trailing stops.
Pullback Strategy
The pullback method is another popular approach when trading rectangle patterns. In this method, you wait for a temporary pullback in the price after a breakout, aiming to enter the trade at a potentially more favorable price.
Here's how to apply this method step by step:
- Identify the Rectangle Pattern: Start by identifying a price chart showing a consolidation phase with two horizontal tops and two bottoms.
- Spot the Breakout: Keep an eye on the price movement to spot a clear breakout from the rectangle's support or resistance line.
- Wait for the Pullback: Instead of entering the trade immediately, wait for a pullback in the price. This means a temporary reversal against the breakout direction.
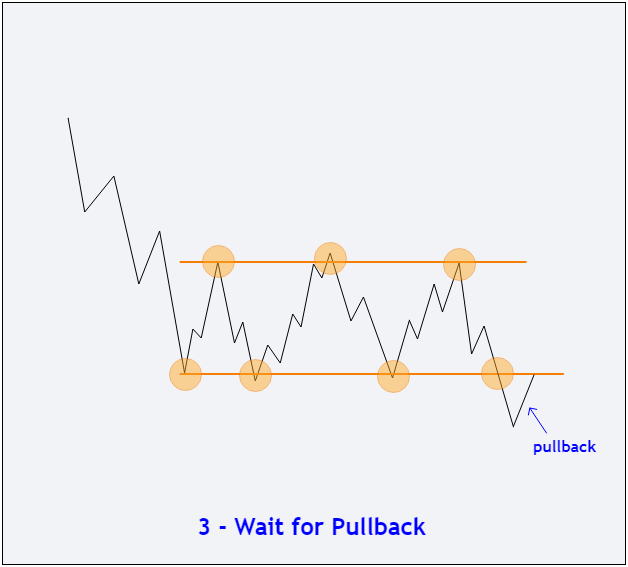
- Enter the Trade: After the pullback, when you believe the price is about to resume its breakout direction, enter the trade. This can ensure a more confirmed and reliable trade compared to entering right after the initial breakout.
- Protect Your Trade: As always, place a stop loss to manage risk. Position your stop loss in the middle of the rectangle's range or below the recent low price. For your take-profit target, set it at least as the size of the rectangle pattern.
- Exit Strategy: Keep the trade open until the price movement equals or exceeds the pattern's size. If market conditions remain favorable, you can think about pursuing extra profits.
Tips to Minimize False Breakouts
Price breakouts can be tricky. Sometimes, prices break out briefly and then bounce back to their old trading range. These are called false breakouts and can lead to losses if you rely solely on price movements.
To tell apart real breakouts from fake ones, you can use trading volume as an extra clue. When a price breakout occurs, pay attention to the trading volume that goes along with it. A genuine breakout often comes with a surge in trading volume, showing that many traders are convinced the new price direction is the real deal.
If there's a lot of trading volume supporting the breakout, it's a good sign that the price move is for real and likely to stick around. This shows that many traders are getting behind the breakout.
On the flip side, if a breakout happens with low or decreasing trading volume, be cautious. These breakouts are more likely to be false signals because there might not be enough conviction in the market to support the new trend.
Case Study
To help you understand how to incorporate rectangle price patterns in your trades better, we will provide two examples on the following charts.
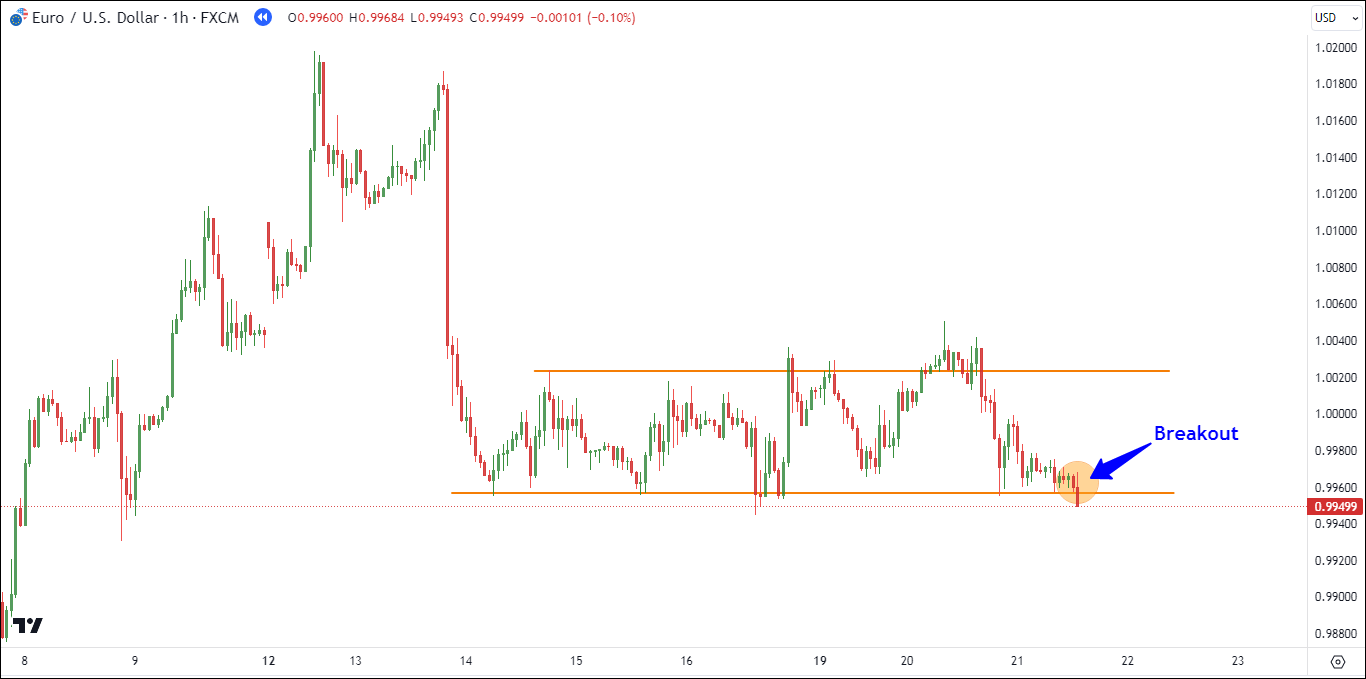
#1 EUR/USD - Sell Setup
In the EUR/USD H1 chart below, you can observe the presence of a rectangle pattern. The price was consolidating within the range of 0.9957 to 1.0023.
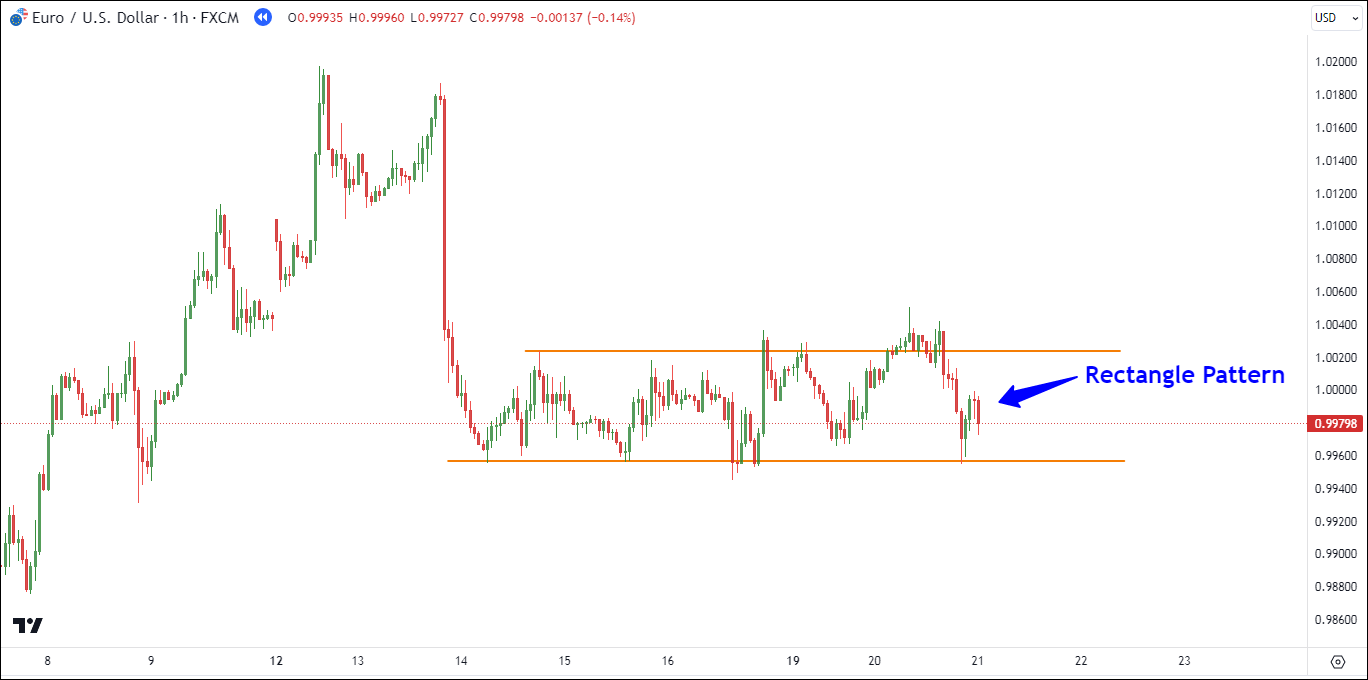
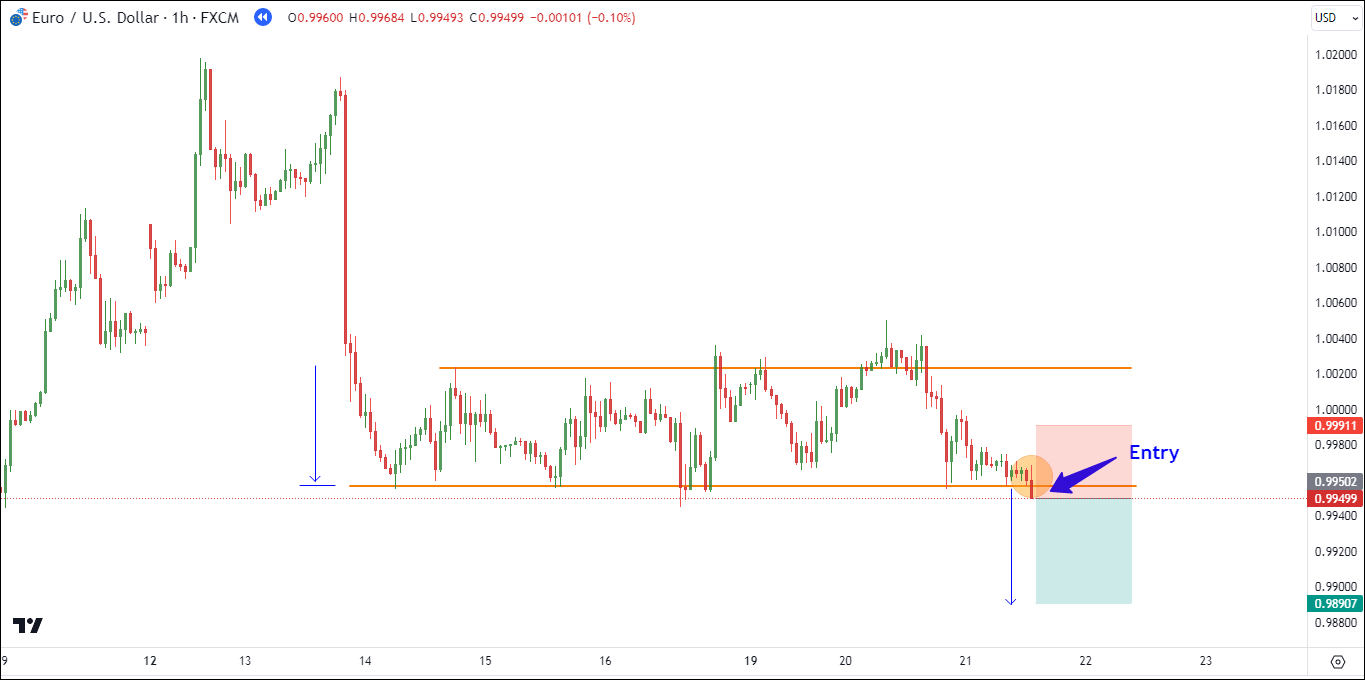
Later on, the price continued its descent until it broke through the 0.9957 support level.
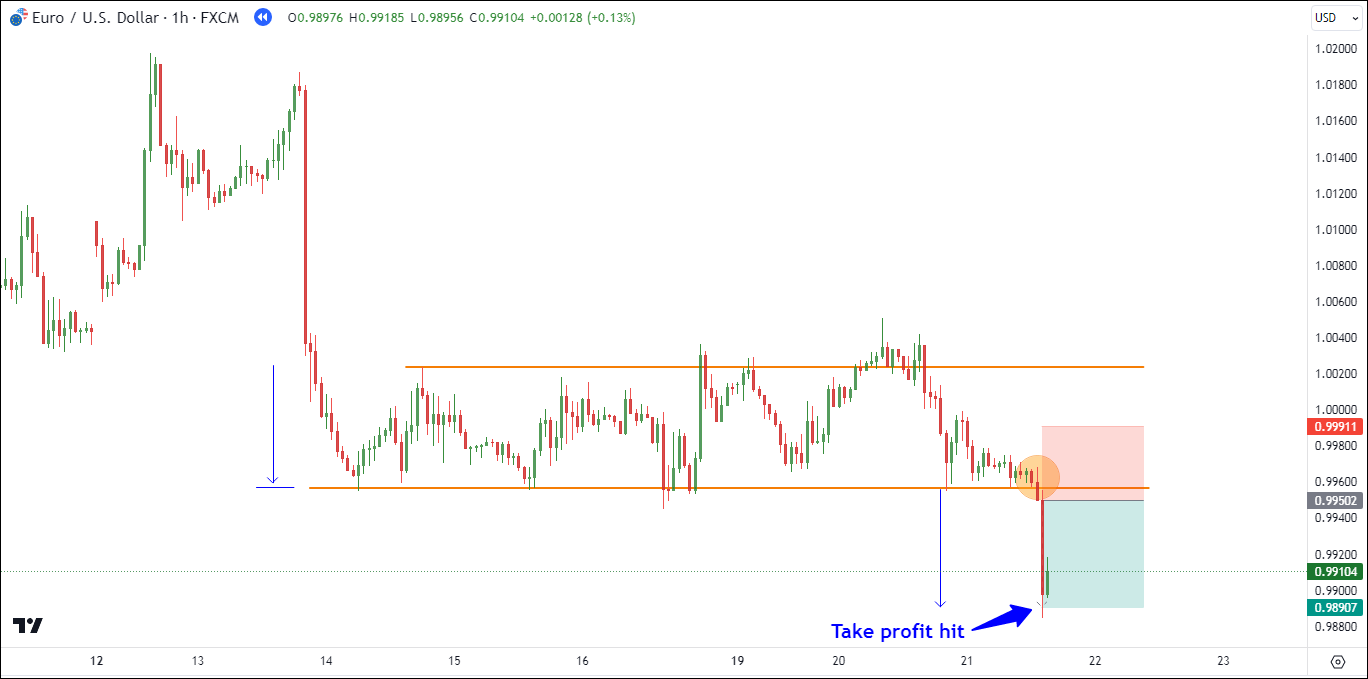
A sell position was initiated at 0.9950 with a stop loss at 0.9991 (40.9 pips), while the take-profit target was set at 0.9890 (59.5 pips).
Following the entry of the sell position, the price continued its downward trajectory, eventually reaching the take-profit level at 0.9890. This resulted in a successful gain of 59.5 pips for the sell position.
#2 AUD/USD - Buy Setup
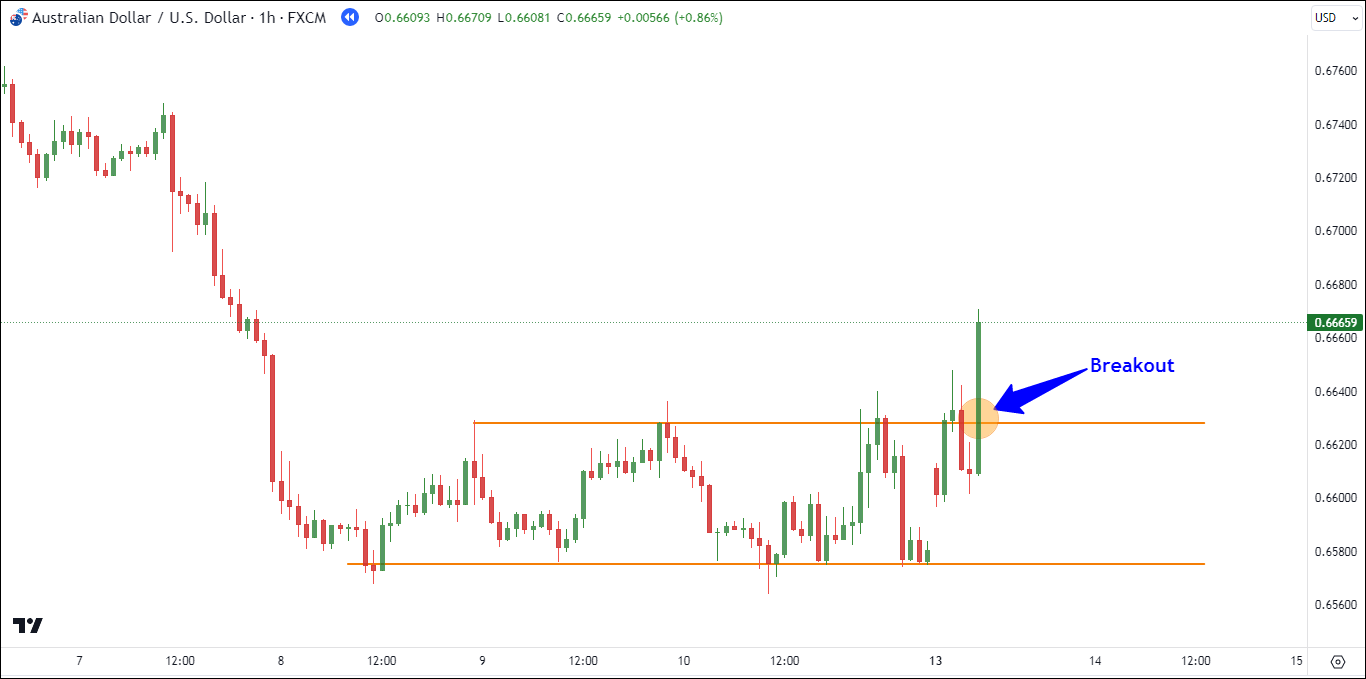
In the AUD/USD H1 chart below, you can spot a rectangle pattern forming. The price has been oscillating within the range of 0.6576 to 0.6628.
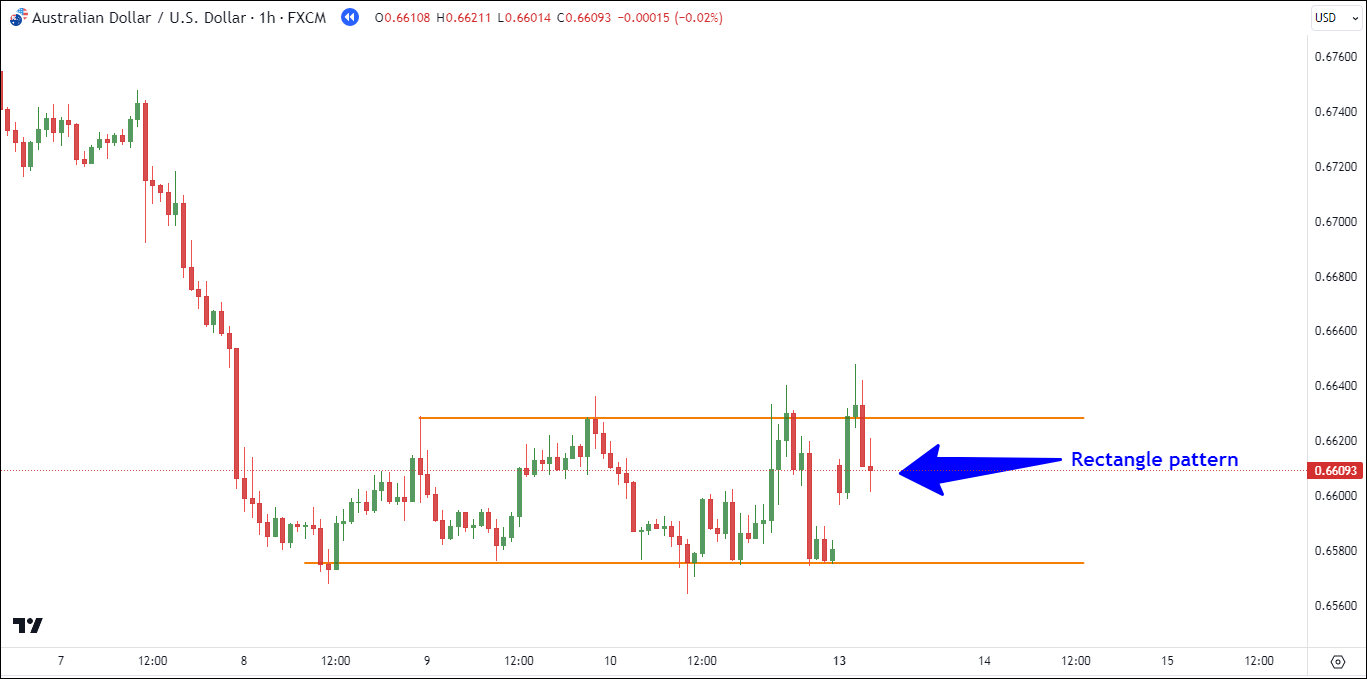
In the next stage, the price kept testing the resistance and eventually broke above it at 0.6628. Once this breakout was confirmed, it signaled a reversal into a bullish rectangle pattern.
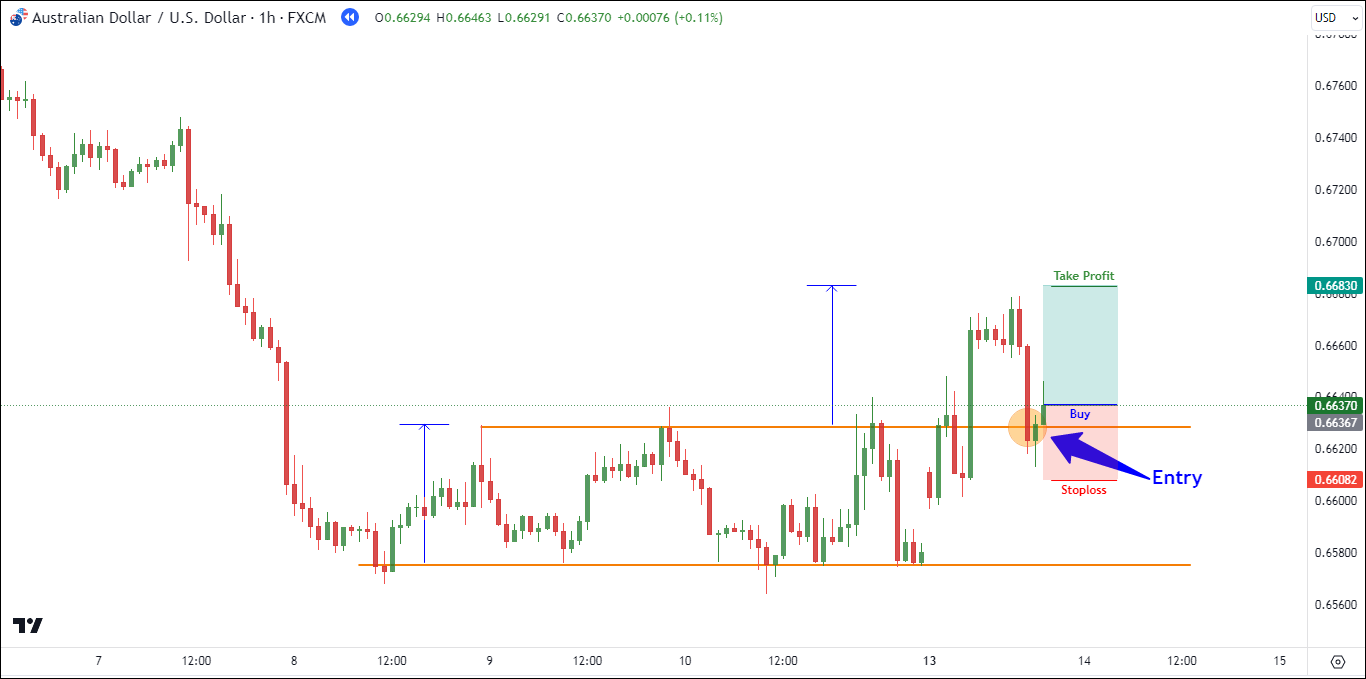
From there, we simply waited for the price to dip and test the previously strong resistance, which had now turned into a support level. As the price successfully tested this support, we entered a buy position.
We entered the trade at 0.6636, with a stop loss at 0.6608 (28.5 pips). For our take-profit target, we used the same price range as the previous rectangle pattern, setting it at 0.6683 (46.3 pips).
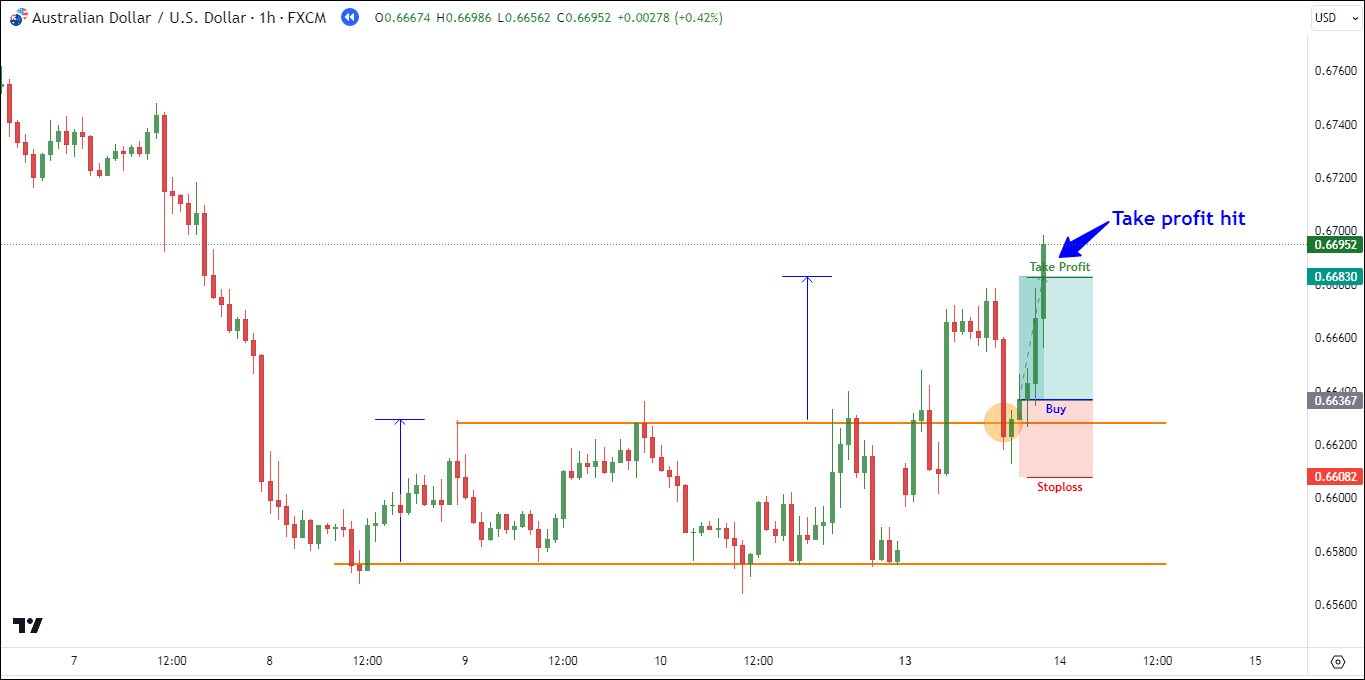
Following our entry, the price continued to rise and eventually reached our take-profit level at 0.6683 (+46.3 pips).
Final Thoughts
The rectangle pattern is a price pattern that moves back and forth within a specific range. It's like drawing a box on the price chart because there are horizontal lines at the top and bottom, showing where the price tends to stop or bounce back.
The rectangle pattern isn't inherently bullish or bearish. It depends on the trend that comes before it. If it follows an uptrend, it can be seen as bullish, indicating a potential continuation. If it follows a downtrend, it may be seen as bearish, suggesting a potential downward continuation.
Traders can use two methods for clear risk and reward planning: breakout and pullback. Additionally, paying attention to trading volume helps identify real breakouts and reduces false signals.
Nevertheless, remember trading always involves risks, so have a solid risk management plan in place and test this pattern in a demo account before using it for real.


10 Comments
Cathy
Sep 19 2023
After reading the article, I find myself favoring the pullback strategy over the breakout strategy. In my trading experience, I've consistently used pullbacks because I perceive breakouts as riskier. I am confident in using the pullback strategy.
In simpler terms, I've often observed that my stop-loss (SL) gets hit more frequently when I employ breakout strategies, making it harder to maintain profitable trades. So, which of these two strategies, pullback or breakout, typically leads to better profits or is generally considered superior? Your thoughts on this would be greatly appreciated.
David Tristan
Sep 19 2023
The choice between a pullback strategy and a breakout strategy in trading depends on various factors, including your trading style, risk tolerance, and the specific market conditions you are dealing with. There is no one-size-fits-all answer, as both strategies have their strengths and weaknesses, and what works for one trader may not work for another. Let's explore the pros and cons of each strategy:
Pullback Strategy:
Pros:
Cons:
Breakout Strategy:
Pros:
Cons:
In your case, you've mentioned that your stop-loss gets hit more frequently when using breakout strategies, which can be a common experience. Breakouts are indeed riskier because they involve entering the market when there is often increased volatility and uncertainty. If you are more comfortable and successful with pullback strategies and have a proven track record with them, it makes sense to stick with what works for you.
Ultimately, the "better" strategy depends on your trading skills, risk management, and psychological comfort with the chosen approach. Some traders may prefer the stability of pullbacks, while others may thrive on the excitement and potential for larger gains with breakout strategies.
Diana
Sep 19 2023
From the article I learned that the rectangle pattern isn't limited to just one direction; it can take on two different forms. Initially, I believed it was mainly a continuation pattern, suggesting that when it breaks, it provides an opportunity to enter in the ongoing trend's direction.
However, I've now realized that the rectangle pattern can also act as a reversal pattern. In these instances, when the price breaks out, it indicates a change in the trend's direction. This has led me to wonder which of these two variations, the reversal or continuation pattern, tends to deliver better trading results.
Based on the author's observations, which one tends to yield better results for trading, the reversal or continuation pattern?
I'm intrigued by this question because it can significantly impact trading strategies and decision-making. It would be immensely valuable to hear about the author's insights or experiences regarding the effectiveness of these two different rectangle patterns in real-world trading scenarios
David Tristan
Sep 19 2023
The effectiveness of the rectangle pattern, whether as a continuation or reversal pattern, can vary depending on market conditions and the context in which it appears. There is no definitive answer as to which variation tends to deliver better trading results, as it depends on various factors. However, I can provide some insights into both scenarios:
Rectangle Pattern as a Continuation Pattern:
Rectangle Pattern as a Reversal Pattern:
My observations and experiences may vary, and what works best can depend on their specific trading style, risk tolerance, and the assets they trade. To determine which variation tends to yield better results for your own trading, consider the following:
In conclusion, there is no one-size-fits-all answer to whether rectangle patterns are better as continuation or reversal patterns. Traders should adapt their strategies based on the prevailing market conditions and their own trading preferences, while also using proper risk management and confirmation techniques to increase the likelihood of successful trades.
Chad
Sep 19 2023
The material looks interesting, and it shows promise. However, I believe in putting things to the test in real-world situations to confirm their reliability and effectiveness before fully embracing them.
The challenge I'm facing is that I'm relatively new to backtesting. I understand that backtesting is a vital part of assessing a trading strategy, but I'm still in the early stages of becoming proficient in this area. I would greatly appreciate your guidance on how to effectively conduct a thorough backtesting process. Your insights on this topic would be highly valuable.
David Tristan
Sep 19 2023
Backtesting is indeed a crucial step in assessing the reliability and effectiveness of a trading strategy. It allows you to evaluate how a strategy would have performed in the past, providing insights into its potential performance in the future. Here's a step-by-step guide on how to effectively conduct a thorough backtesting process:
1. Define Your Trading Strategy:
Clearly outline the trading strategy you want to test. This includes entry and exit criteria, stop-loss and take-profit levels, position sizing rules, and any other relevant parameters.
2. Gather Historical Data:
Obtain high-quality historical price data for the asset or market you intend to trade. Ensure the data is complete and accurate, with timeframes matching your trading strategy.
3. Choose a Backtesting Platform:
Select a backtesting platform or software that suits your needs. Popular options include MetaTrader, TradingView, and specialized backtesting software like Amibroker or NinjaTrader.
4. Data Preparation:
Import the historical data into your chosen backtesting platform. Ensure that the data is formatted correctly and that any dividends, stock splits, or other corporate actions are adjusted for accuracy.
5. Set Up Trading Rules:
Program or input the specific trading rules of your strategy into the backtesting platform. This may involve using a coding language like MQL (MetaQuotes Language) for MetaTrader or Pine Script for TradingView.
6. Test Your Strategy:
Run the backtest using the historical data and your defined trading rules. Pay attention to the results, including metrics like profit and loss, win rate, drawdown, and risk-adjusted returns.
7. Analyze the Results:
Evaluate the performance of your strategy by examining various performance metrics. Look for areas of improvement or potential issues. Common performance metrics to consider include:
8. Refine and Optimize:
Based on the results of your backtest, consider making adjustments to your strategy. This may involve fine-tuning entry and exit rules, stop-loss levels, or position sizing. Re-run the backtest after each adjustment to see how it affects performance.
9. Out-of-Sample Testing:
Once you're satisfied with the backtested results, conduct out-of-sample testing by applying the strategy to a different period of historical data not used in the initial backtest. This helps assess the strategy's robustness.
10. Forward Testing:
- After successful out-of-sample testing, consider forward testing the strategy in real-time using a demo account or small position sizes. This provides a real-world simulation of how the strategy would perform in current market conditions.
11. Keep Records:
- Maintain detailed records of your backtesting results, adjustments, and any modifications made to the strategy. This documentation is essential for ongoing evaluation and refinement.
Brian
Sep 19 2023
I decided to give the strategy a try on my trading account, but unfortunately, it hasn't been producing positive results. The instructions appeared straightforward as I went through them. The steps were clear, and they even included practical examples illustrating how to identify trends and confirm them at specific levels. However, when it came to putting these instructions into action in the live market, it turned out to be more challenging than I initially thought.
One of the challenges I encountered was the price fluctuations after I entered a trade. For instance, even if things started with a small profit, the price frequently reversed back to its original position. Dealing with such situations can be disheartening. Furthermore, there were instances where I entered a trade and, after waiting for just an hour or two, it hit the stop loss. Managing these situations can be emotionally taxing.
I'd greatly appreciate it if you could provide some guidance on how to maintain a calmer mindset when facing such trading challenges.
David Tristan
Sep 19 2023
Maintaining a calm and disciplined mindset in the face of trading challenges is a crucial aspect of successful trading. Here are some strategies to help you stay composed when dealing with price fluctuations and unexpected losses:
1. Accept That Losses Are Part of Trading:
Understand that losses are an inherent part of trading, and even the most successful traders experience them. Embrace losses as opportunities to learn and improve your strategy.
2. Set Realistic Expectations:
Ensure that your expectations are grounded in reality. Recognize that trading involves both winning and losing trades, and no strategy is infallible. Avoid the expectation of making consistent profits in every trade.
3. Use Proper Risk Management:
Implement effective risk management techniques, such as setting stop-loss orders and position sizing based on your risk tolerance. This helps limit potential losses and protects your capital.
4. Trade with a Trading Plan:
Stick to your trading plan, and don't deviate from it based on emotions or impulse. A well-defined plan should outline your entry and exit criteria, risk management rules, and overall strategy.
5. Avoid Overtrading:
Overtrading, or trading too frequently or with larger positions than you can afford, can lead to emotional exhaustion and impulsive decisions. Stick to your predetermined trading plan and avoid excessive trading.
6. Maintain a Trading Journal:
Keep a detailed trading journal to record your trades, including the reasons for entering and exiting each trade. Reviewing your journal can help you identify patterns in your trading behavior and improve decision-making.
7. Develop Emotional Resilience:
Work on developing emotional resilience by practicing mindfulness, meditation, or relaxation techniques. These can help you stay calm and focused during stressful trading situations.
8. Avoid Revenge Trading:
If you experience a losing trade, avoid the temptation to immediately enter another trade to "recover" your losses. This can lead to impulsive decisions and further losses.
9. Take Breaks and Manage Stress:
Trading can be mentally demanding. Take regular breaks, get enough rest, and manage stress through exercise, a healthy diet, and relaxation techniques.
10. Seek Support and Education:
- Consider seeking support from trading communities, forums, or mentors who can provide guidance and share their experiences. Continuous learning and improvement can boost your confidence.
11. Backtest and Validate Your Strategy:
- Ensure that your trading strategy has been thoroughly backtested and validated in different market conditions. Confidence in your strategy can help you stay committed to it during challenging periods.
12. Review and Adapt:
- Periodically review your trading performance and adapt your strategy as needed. Be open to making adjustments based on what you learn from your experiences.
Lisa
Sep 20 2023
The material is quite impressive; the explanations are well-structured and provide intricate details.
What's particularly helpful is the inclusion of examples that are easy to grasp, making it accessible even for beginners to understand the concepts.
However, I have some lingering curiosity about this approach. Specifically, I'm keen on exploring the potential pros and cons of using this pattern as a trading strategy. A deeper analysis of these aspects would offer a more comprehensive view of its practical application in real-world trading. I'd greatly appreciate your insights on this topic.
David Tristan
Sep 20 2023
Certainly, let's delve deeper into the potential pros and cons of using the rectangle pattern as a trading strategy:
Pros of Using the Rectangle Pattern as a Trading Strategy:
1. Clear Entry and Exit Signals:
The rectangle pattern offers well-defined entry and exit points. Traders can enter a trade when the price breaks out of the pattern, providing clear signals for both long and short positions.
2. Objective Technical Analysis:
The pattern is based on objective technical analysis, making it accessible for both beginners and experienced traders. It relies on easily identifiable support and resistance levels.
3. Versatility:
The rectangle pattern can be applied to various timeframes and asset classes, from stocks and currencies to commodities and cryptocurrencies. This versatility allows traders to use it in different markets.
4. Risk Management:
The pattern allows for precise placement of stop-loss orders just outside the pattern's boundaries. This helps control risk by defining the maximum acceptable loss for a trade.
5. Trend Identification:
Depending on whether it acts as a continuation or reversal pattern, the rectangle can help traders identify ongoing trends or potential trend reversals, enhancing trading opportunities.
6. Visual Clarity:
The pattern's visual clarity makes it easy to spot price charts, reducing the likelihood of missed opportunities.
Cons of Using the Rectangle Pattern as a Trading Strategy:
1. False Breakouts:
One of the primary challenges with rectangle patterns is the potential for false breakouts. Prices can break out briefly and then reverse, leading to losing trades.
2. Whipsaws:
Whipsaws occur when prices move rapidly in both directions around the pattern's boundaries, causing traders to enter and exit positions frequently. This can result in frustration and losses due to increased trading costs.
3. Market Conditions:
The effectiveness of the rectangle pattern may vary depending on market conditions. It may perform better in range-bound or consolidating markets but less effectively in strongly trending markets.
4. Confirmation Required:
To increase the reliability of rectangle patterns, traders often use additional technical indicators or price action signals for confirmation. This can complicate the trading process and lead to delays in entering trades.
5. Emotional Discipline:
Maintaining emotional discipline is essential when trading rectangle patterns. Traders may become impatient or anxious when waiting for breakouts, leading to impulsive decisions.
6. Backtesting Required:
To use the rectangle pattern effectively, traders should conduct thorough backtesting to understand its historical performance in different market conditions. This can be time-consuming and requires a good understanding of backtesting techniques.