 Dedicated FREE FOREX VPS
 Free FOREX Virtual Private Server
 MT4 Demo Contest, Get $500
 Sign Up for an Account, Claim 60% Deposit Bonus
 Free MT4/MT5 VPS 2024
 Send E-mail and Get Free Merchandise
 $1K Refer a Friend Bonus for Pepperstone Pro clients
 Maximize Your Earnings with 100% Deposit bonus
 Trade to Win, $5,000 Monthly Demo Contest
 Claim 30% + 15% Deposit Bonus from LiteFinance
What are the best EMA periods if you scalp in small time frames? This particular strategy could give you an insight to the best EMA crossover in a 5-minute chart.

Exponential Moving Average is a type of Moving Average that gives greater weight or importance to the more recent price in a chart. The smaller the EMA number, the more responsive it is to the latest price.
The strategy we're going to be talking about today revolves around having an EMA crossover. Now you may be wondering what this even means.
To put it simply, we're going to be using two different EMAs in this strategy. Each of them will have its own line going through the chart, and when the two EMA lines cross over each other, it would be known as an EMA crossover.
Using EMA Crossover Strategy on 5-Minute Chart
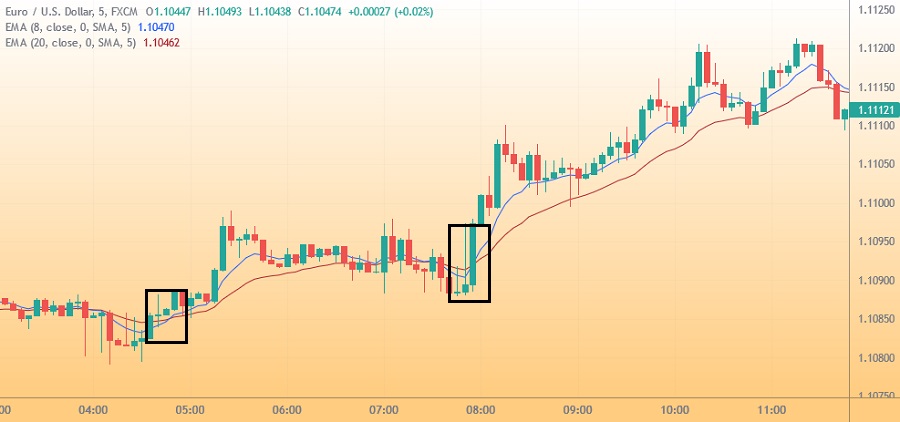
Now that we've understood what an EMA crossover is, let's get into our strategy. We're going to be using two EMAs on a 5-minute chart. We're going to be depending on their crossover points in order to execute our positions.
The two EMAs we're going to be using are 8 EMA and 20 EMA. Let's understand how to perform this strategy on a long trade and a short trade.
See Also:
Long Trade
A long trade is where you enter a trade in a BUY position. To enter a long trade with this EMA crossover strategy, we're going to have to wait for the two lines to crossover while the market is moving in an ascending pattern. Once this happens, we enter the trade.
To exit a long trade with this EMA strategy, we're going to wait to see when these two lines crossover while the market is moving in a descending pattern. Once this happens, we exit the trade.
Short Trade
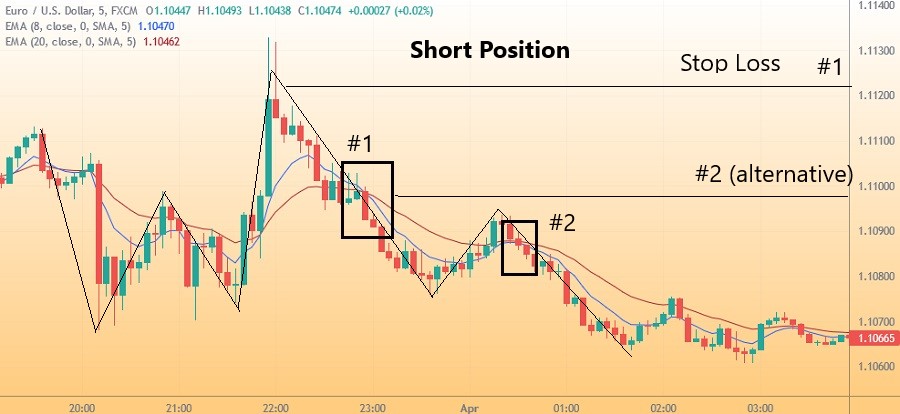
A short trade is where you enter a trade in a SELL position. It uses the same method we just went over above but just done the opposite way. To enter a short trade, we have to wait for the EMA lines to crossover while the market is descending.
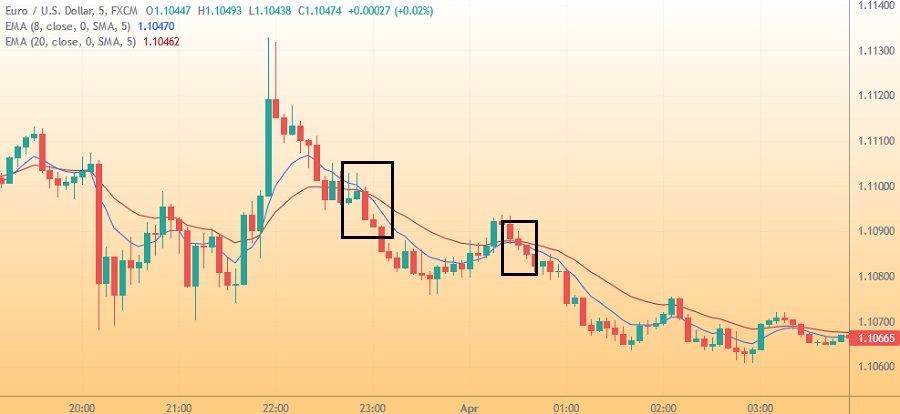
Similarly, to exit a short trade, we have to wait for the EMA lines to crossover while the market is ascending.
Stop Loss and Take Profit
Setting stop loss and take profit levels using the EMA Crossover strategy on a 5-minute chart effectively is crucial for managing risk and maximizing profits in trading. Here are some tips to help you set these levels:
- Stop Loss:
Traders can set a stop loss level below the entry point for a long position or above the entry point for a short position. One of the easiest ways to determine a stop loss level is by the previous swings.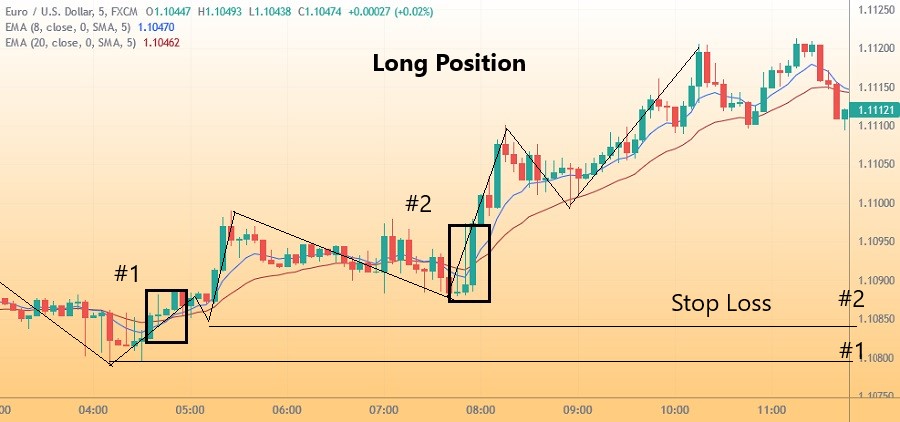
- Take Profit:
Traders can set a take profit level above the entry point for a long position or below the entry point for a short position. Similar to determining the stop-loss level, you can also identify the take-profit points using the previous swings.
EMA Crossover Strategy with Other Indicators
Many traders use a combination of EMA crossover with other indicators to increase the accuracy and reliability of their trading signals. Adding additional indicators can provide extra confirmation about the trend direction, market conditions, and potential entry or exit points.
Some commonly used indicators in conjunction with EMA crossover include:
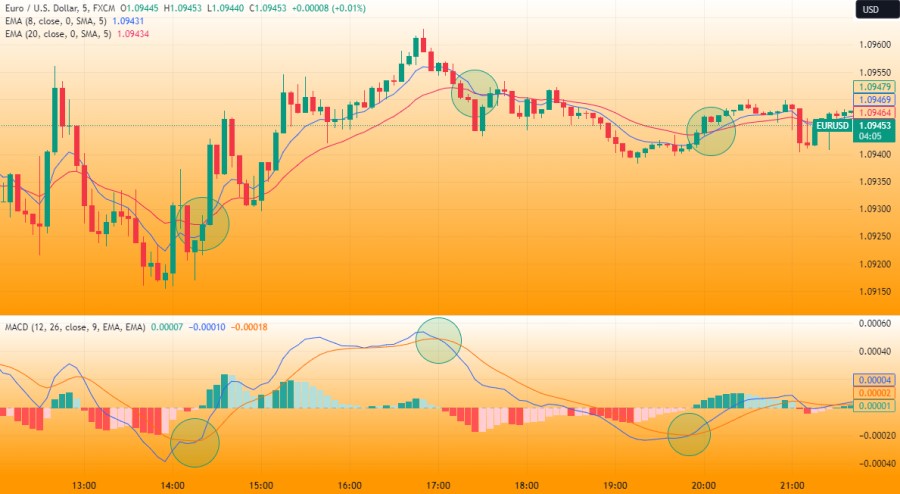
1. EMA Crossover with MACD (Moving Average Convergence Divergence)
MACD combines moving averages with oscillator components. The combination of EMA crossover and MACD provides a strong confirmation signal. If both indicators experience a crossover simultaneously, the reversal signal will become even stronger.
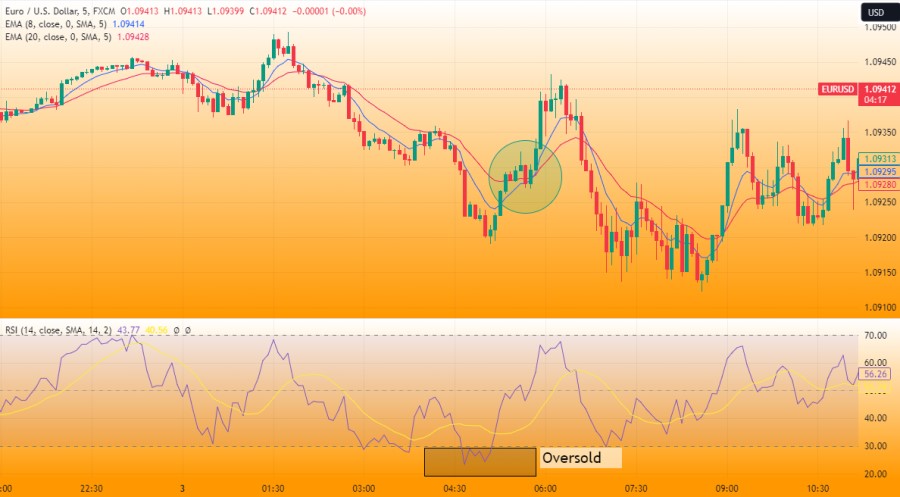
2. EMA Crossover with RSI (Relative Strength Index)
RSI is a momentum indicator that measures the strength and weakness of price trends. The combination of EMA crossover and RSI can provide confirmation signals. As shown in the image below, the oversold signal from RSI is followed by an EMA crossover, which confirms a bullish transition.
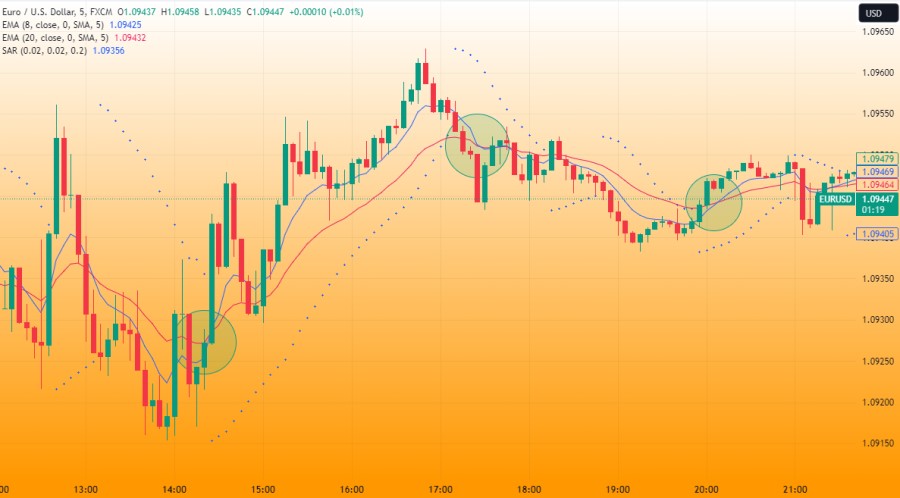
3. EMA Crossover with Parabolic SAR
Parabolic SAR is a trend indicator that provides stop-and-reverse signals. If there is an EMA crossover followed by a change in the direction of the Parabolic SAR dots, it indicates a strong reversal.
Pros and Cons Trading with EMA Crossover
Trading with EMA crossover has both advantages and disadvantages, which are important to consider before incorporating this strategy into your trading approach.
| ✔️Pros | ❌Cons |
|
|
In addition to 8 and 20 EMA lines, there is a certain EMA period that is well known for its reliability in signifying price trends. Learn about it further in 200 EMA Trading Strategy, Simple Yet Powerful.


5 Comments
Vincent
Nov 22 2023
in the article, it said that EMA, or Exponential Moving Average, is a specific type of moving average that places a higher emphasis on recent prices in a chart. The lower the EMA number, the more it reacts to the latest price changes. Wondering why it's so responsive? Well, that's because it gives more weight to recent data, capturing shifts in the market quickly. Now, why is EMA a go-to in trading? It's popular because traders find it effective in identifying short-term trends. You've probably noticed different traders using varying EMA numbers like EMA 200 or EMA 8 and 20. The reason for this variation is that traders choose the EMA period based on their trading strategy and time frame. For instance, this article opts for EMA 8 and 20 for a 5-minute chart, showcasing the flexibility of EMA in adapting to different trading styles and preferences.
Hans
Nov 26 2023
The reason why EMA (Exponential Moving Average) is more responsive to the latest price is because it gives greater weight to recent data points in a chart. The formula for calculating EMA emphasizes the most recent prices, making it quicker to react to changes in the market.
EMA is widely used in trading because of its effectiveness in identifying short-term trends. Traders often encounter different EMA numbers like EMA 200, EMA 8, or EMA 20. The choice of EMA period depends on the trader's strategy and time frame. For example, in the context of a 5-minute chart, this article suggests using EMA 8 and 20, demonstrating the adaptability of EMA to various trading styles. You can read more about EMA in this article : A Trader's Guide to EMA Strategy
Tom
Nov 27 2023
Hey, so EMA is basically a moving average. If you're using EMA 200, it's like averaging out prices from the past 200 days. Take this scenario: we're checking out the closing prices of a stock over the last five days:
It's cool because EMA gives more weight to recent days, reacting faster to price changes. This example is straightforward, but in the real trading game, traders play around with different EMA periods to catch trends and make smart moves.
Irawan
Jan 21 2024
After reading the article, I realized that trading with the EMA strategy isn't as complicated as some other indicators like ichimoku-hyo. The gist is, you can spot trading opportunities when EMA lines cross with MACD or when EMAs cross each other, and by checking RSI for overbought or oversold signals. There's also something about parabolic SAR, but I'm a bit fuzzy on that.
Now, I'm curious about the upsides and downsides of the EMA strategy, especially the downsides. The article mentions that EMA crossovers can give false signals, especially in choppy markets, leading to those annoying whipsaws where prices swing back and forth across the EMAs. Can you give me some examples of these pesky false signals?
Sam
Jan 24 2024
Hey, let me break it down for you in simple terms. False signals in the EMA (Exponential Moving Average) crossover game are like when your GPS messes up and leads you to the wrong place. It's when the trading signals that the strategy throws at you end up being totally off, messing with traders' heads on whether to buy or sell. (read : How to Avoid False Signals in Forex?)
Picture this: