 Dedicated FREE FOREX VPS
 Free FOREX Virtual Private Server
 MT4 Demo Contest, Get $500
 Sign Up for an Account, Claim 60% Deposit Bonus
 Free MT4/MT5 VPS 2024
 Send E-mail and Get Free Merchandise
 $1K Refer a Friend Bonus for Pepperstone Pro clients
 Maximize Your Earnings with 100% Deposit bonus
 Trade to Win, $5,000 Monthly Demo Contest
 Claim 30% + 15% Deposit Bonus from LiteFinance
Trading with EMA does not only focuse on its crossovers but also price retests. The stop loss is also not to be determined carelessly. Find more guides on trading with an EMA strategy in this article.
EMA stands for Exponential Moving Average. It is a tool for technical analysis, the most popular technique used by many traders. This article will guide you to the steps on how to apply the EMA strategy easily. This knowledge can make your trading successful if you can be consistent with the implementation in the long term.
See Also:
Why EMA?
The moving average is an effective indicator that can be used for various markets. Therefore, the exponential moving averages are popular among traders. Generally, the EMA strategy is applied to find the best predominant trend in the market. It is commonly used worldwide and works successfully in all markets including forex, stocks, currencies, indices, even the cryptocurrencies market (such as Bitcoin). Furthermore, EMA Strategy works in any time frame. You choose the best chart on your own and trade with EMA. In shorts, EMA is applicable in all markets, making it easier to be used by all traders, both beginners and professionals.
The EMA Formula
Frequently, the pattern revealed is hard to see by the traders. It is quite unfortunate as the pattern can actually predict the upcoming trend in the market. In this case, EMA saves you from the confusion in monitoring the very fast price fluctuation in the market. It presents a simpler and smoother look at the price to derive the trend.
EMA is presented on the price chart as a dynamic line moving in accordance with the price movement. It is actually built of a mathematical formula that provides information on an average price in a certain period of time. However, the formula of EMA is usually more focused on the most updated price.
There are 3 stages of calculating the EMA formula:
- Use the SMA for the starting point to get the EMA value.
- Use a multiplier that makes the moving average put more focus on the most recent price.
- Finally, divide the result of the sum by a certain period.
The example below shows the calculation of a 20 EMA:
Initial SMA = 20-period sum / 60
Multiplier = (2 / (Time periods + 1) x 100 % ) = (2 / (20 + 1) x 100% ) = 0.0952 (9.52%)
EMA = {Close – EMA(previous day)} x multiplier + EMA(previous day)
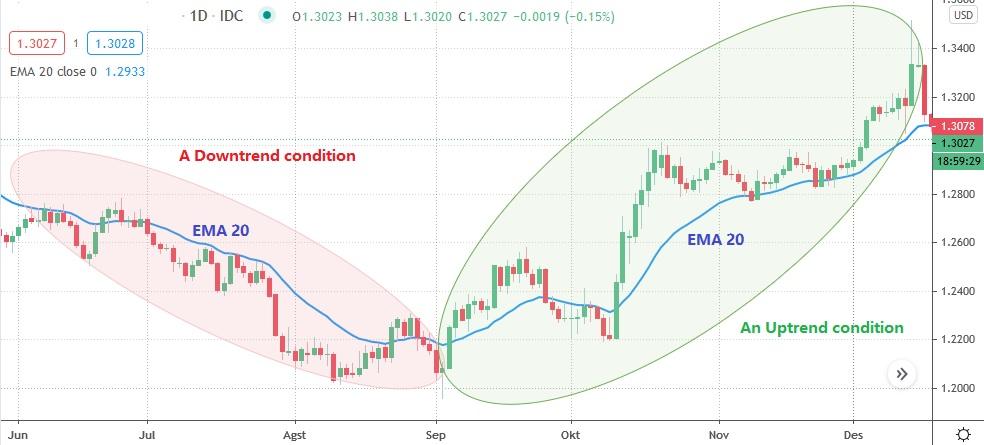
There is an agreement that when the price moves above the moving average, it indicates an uptrend position. On the other hand, if the price is trading below the line, it means the price is in a downtrend.
See Also:
Developing an EMA Trading Strategy
EMA strategy itself consists of two elements. First, use two EMAs as a filter to make an entry for predicting the new trend. Second, use one moving average with a shorter or longer period to trigger the setup. This strategy will remove all of the subjectivity that might happen. Here are the steps you can follow to apply the EMA strategy.
1. Setting up the chart for EMA 20 and EMA 50
The very beginning step is setting up your chart with the right moving average. Postpone identifying the EMA crossover at the next stage if you haven't established this step. Note that the EMA uses in this strategy are two lines with 20 and 50 periods. So, open up your trading platform, find a chart of your favorite pair and time frame, then set the EMA 20 and EMA 50 on the chart.
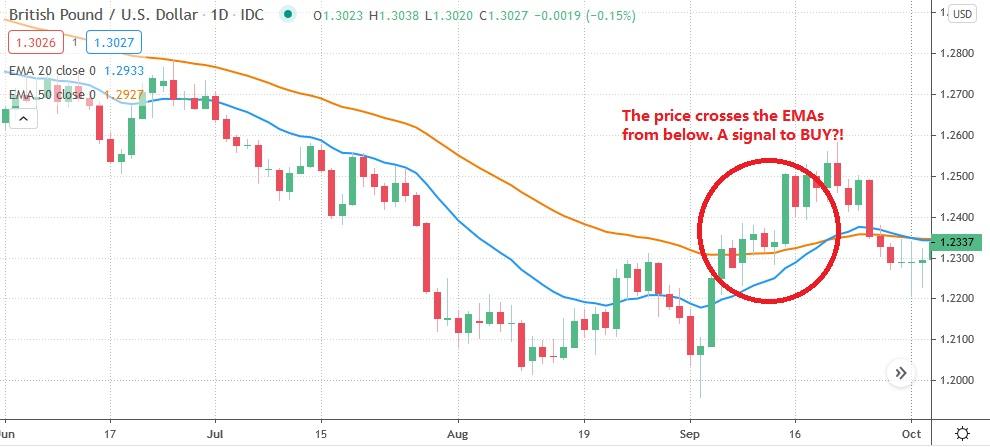
2. Wait for the crossovers.
You should wait patiently for the crossover between the price and the EMA lines. As mentioned before, an uptrend (bullish) condition is when the price crosses above the EMAs, while a downtrend (bearish) outlook is when the price crosses below the EMA lines. As the market tends to show false breakouts, you need more confirmation signals to enter the market. Hence, you can't skip the next points.
3. Wait for the price to test the zone between the two EMAs at least twice.
After the crossover, you need to be patient in waiting for the confirmation. Why? Because you need to ensure that the price has tested the area between the EMA 20 and EMA 50 before triggering a long or short position. Furthermore, the test needs to happen at least twice if you want a strong signal.
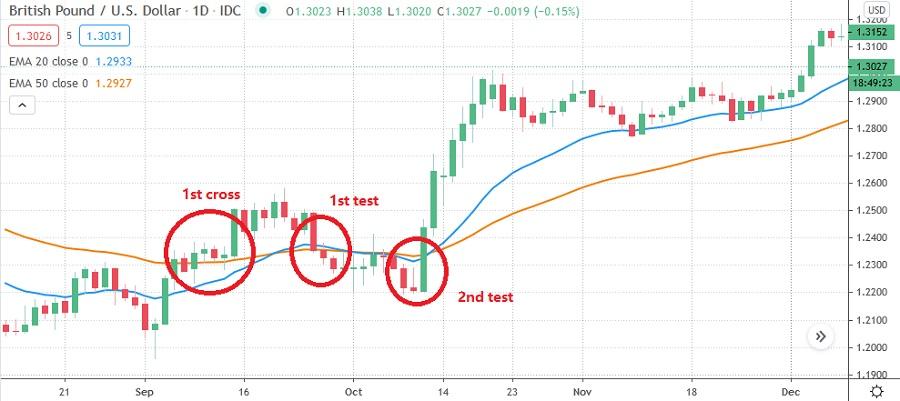
When the price is between the two EMAs, it doesn't mean the price has to trade in between the two moving averages. All you need is the whole price pattern between both EMAs. If the price is only at the EMA 20 as the shorter moving average, the retest will still work. To help you shape better patience, keep in mind that there is no too-high-price to buy or too-low-price to sell.
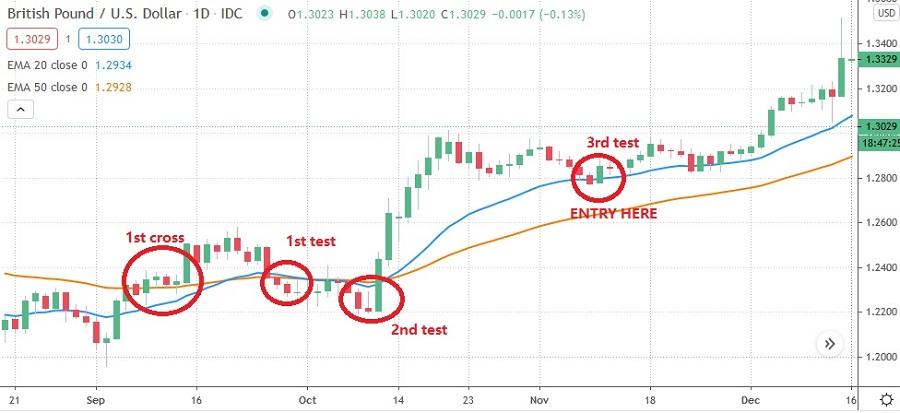
4. Open a trade when the EMA zone is between 20 and 50 at the third retest.
When the price is successfully retested in the zone between EMA 20 and EMA 50 for the third time, it means you can buy or sell at the market price. From the three retests, you then can draw some useful conclusion that the momentum is already strong enough to push the market higher or lower. Your next task is to place the right stop loss to protect your trade from unprecedented risks.
5. Set the Stop Loss 20 pips from the EMA 50.
If the EMA crossover has been defined and you have ensured that the price has tested the lines at least twice, you will know that the trend is indeed moving upwards. The trend will stay at the position as long as it trades above both EMAs. So in the cases of unpredictable market changes, you can set the stop loss 20 pips from the EMA 50, or you can add 20 pips more to be safer.
6. The exit should be adjusted to your own profit target.
To keep your profit/loss ratio intact for the long term, you need to set a good ratio between the stop loss and the profit target. Most traders are recommended to have a higher than 1:1 ratio. For instance, if you have a 1:2 ratio, you will set a profit target that is twice bigger than the stop loss. With the 50 pips stop loss rule defined above, then your profit target should be 100 pips from the entry level. Of course, you can lower the target if you think that the momentum is not quite strong or when you think that your capital would not be sufficient to hold a position with a 100 pips target.
Besides the abovementioned strategies, you may try other strategies that still use moving averages as follows:
a. Moving Average with price action signals.
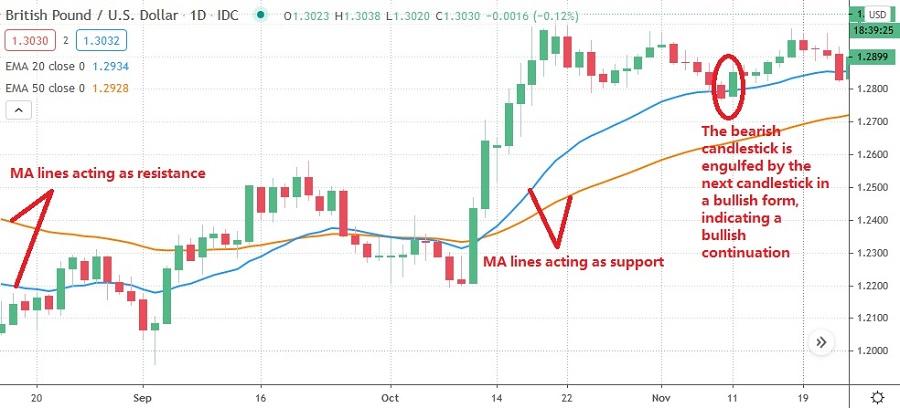
This strategy only uses one indicator of moving averages. It is used as dynamic support or resistance. If the price moves and breaks the MA (moving averages) from below, the MA will function as the support. If the closing price bounces from the MA line, it will indicate that the price will continue its bullish trend.
It also happens in reverse, in which the price breaks the MA from above would mean the MA will function as resistance. If the closing price bounces from MA, it shows that the price returns to its bearish trend. For confirming the pullback signal of moving averages as dynamic support and resistance, you can use a price action signal.
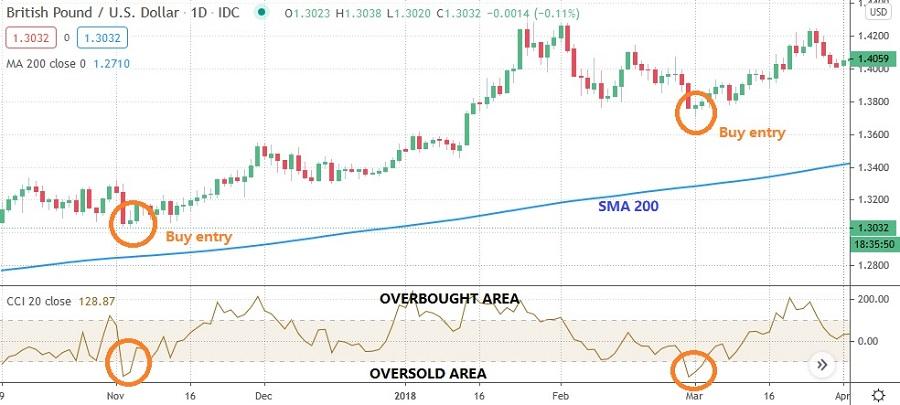
b. Moving averages as a trend filter
This technique is simple. In this case, MA functions as a trend filter to help you get the general outlook of the price. If the price moves above the MA curve, it means the bulls are in control. Conversely, when the price moves under the MA curve, it shows the bears are more dominant.
The technique is normally applied with SMA 200. So, to open a position you need one more strategy as the entry confirmator. In this case, you can use Stochastic, CCI, or W%R. How is the implementation? It's very simple. When the price moves above SMA 200 and is in an uptrend, you have to look only for buy opportunities. If you use a CCI Indicator, set your buy position only when the indicator is gearing up from its oversold area.
All in all, moving averages and especially its EMA variation allow traders to define the current market situation more easily. Applying the MA-based strategies can lead you to better entries and exits. If you are interested in another interesting strategy involving this powerful indicator, take a peek at Practical Use of Moving Averages: EMA-20 and EMA-60 Crossover.


6 Comments
Micah
Jun 10 2023
Do the Exponential Moving Average (EMA) and Moving Average Convergence Divergence (MACD) serve similar purposes? It appears that these indicators play distinct roles in analyzing market trends. It's fascinating to observe how both indicators contribute to traders' decision-making processes, offering valuable resources to navigate the ever-changing market landscape. Whether you're new to trading or an experienced trader, having a solid understanding of the functions of EMA and MACD can greatly benefit your trading journey, acting as an extra set of eyes to monitor market trends. What are your personal thoughts on using these indicators? Do you have a preference for one over the other, or do you find them equally useful in your trading strategies?
David
Jul 6 2023
@Micah: Absolutely! The Exponential Moving Average (EMA) and Moving Average Convergence Divergence (MACD) are distinct indicators that serve different purposes but can be valuable resources for traders.
The EMA focuses on identifying and emphasizing recent price data, giving more weight to recent periods. It helps traders gauge the current trend and potential support or resistance levels. On the other hand, the MACD combines moving averages to reveal potential changes in trend momentum. It consists of two lines—the MACD line and the signal line—plus a histogram that visualizes the difference between the two.
Both indicators can provide insights into market trends, but personal preferences may vary. Some traders may prefer the simplicity and clarity of the EMA, while others may appreciate the additional information provided by the MACD, including trend strength and potential entry or exit points.
In my opinion, both indicators have their merits, and it's important to choose the one that aligns with your trading style and preferences. Some traders even combine both indicators to gain a comprehensive view of the market.
Ogura
Jul 7 2023
When it comes to trading, I've heard that setting the right ratio between stop loss and profit target is crucial for maintaining a healthy profit/loss ratio in the long term. I've also come across the recommendation that most traders should aim for a higher than 1:1 ratio. Could you shed some light on why this ratio is significant and how it contributes to a trader's overall success?
Additionally, I'm curious about the specific impact of a 1:2 ratio, where the profit target is set to be twice as big as the stop loss. How does this particular ratio help traders in achieving their goals and ensuring a favorable profit/loss ratio?
Nicky
Jul 9 2023
@Ogura: Hey! When it comes to trading, getting the right balance between your stop loss and profit target is super important for long-term success. It's all about maintaining a good profit/loss ratio. Most traders recommend aiming for a ratio higher than 1:1. This means that your profit target should be bigger than your stop loss. Why is this ratio so crucial? Well, it's all about making sure that your potential profits outweigh your potential losses. With a higher ratio, even if you have some losing trades, you can still come out ahead in the long run because your profitable trades will make up for it.
Now, let's talk about the 1:2 ratio specifically. This ratio means that your profit target is set to be twice as big as your stop loss. It's a popular choice among traders because it gives you a nice balance. By aiming for a profit that's double the size of your potential loss, you create a favorable profit/loss ratio. Even if you don't win every trade (which is normal), you can still make money because your wins will outweigh your losses. It gives you some
Andrew G
Apr 20 2024
Hey! So, basically, EMA is a big deal in trading worldwide, wether it's forex, stocks, or even cryptocurrencies like Bitcoin. The article talks about how effective it is across all markets. But I'm wondering, why is it so accurate? Is it all about technical analysis, or is there more to the story? hope there is an explanation about my question! thank you!
Cheyna Lionell
Apr 23 2024
Hey there! So, let me explain to you with simple term about EMA. So, here's the deal with EMA (Exponential Moving Average): it's super on point because it gives more importance to recent price changes, so it's like it's always in tune with what's happening right now in the market. People dig it because it helps predict where prices might head next based on past movements. But it's not like a crystal ball, you know? Its accuracy also depends on stuff like how crazy the market's feeling that day and how many folks are trading. So, while it's handy to have in your trading toolbox, it's not the only thing you should rely on. Mixing it up with other tools and strategies is the way to go for a solid trading game. More about EMA, you can read in this article : 3 Reasons Why EMA Important