 Dedicated FREE FOREX VPS
 Free FOREX Virtual Private Server
 MT4 Demo Contest, Get $500
 Sign Up for an Account, Claim 60% Deposit Bonus
 Free MT4/MT5 VPS 2024
 Send E-mail and Get Free Merchandise
 $1K Refer a Friend Bonus for Pepperstone Pro clients
 Maximize Your Earnings with 100% Deposit bonus
 Trade to Win, $5,000 Monthly Demo Contest
 Claim 30% + 15% Deposit Bonus from LiteFinance
Among all chart patterns out there, here are the patterns that really matter. They have been statistically proven to perform the best and thus deserve to be labeled as the most reliable price patterns.
Price patterns are specific patterns created by price movements on a chart that can be used to predict a trend direction. In general, chart patterns can be classified into two types. Continuation patterns are price patterns that signal an ongoing trend will continue. Oppositely, reversal patterns signal a trend reversal.

A test was conducted by Samurai Trading Academy to reveal what patterns are the most reliable statistically. More than 200,000 patterns were tested in the experiment with 10 years' worth of data. Here is the result.
Contents
1. Head and Shoulders Patterns
The head and shoulders patterns are reversal patterns. They finish first in this rank with an impressive record of over 80% success rates for both bullish and bearish versions. The head and shoulders pattern is successful 83.04% of the time, while the inverted head and shoulders pattern is slightly better at 84.44%.
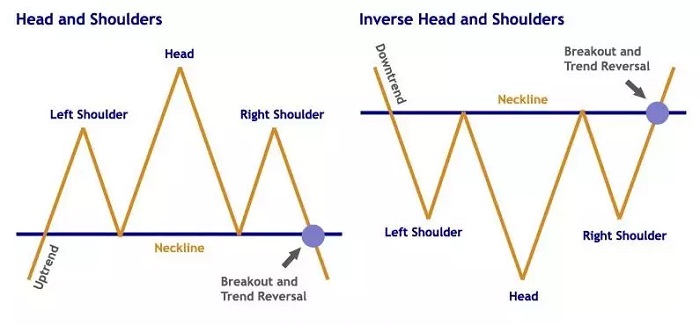
Head and Shoulders Pattern
- A bullish trend is followed by three consecutive rounding tops.
- The three rounding tops consist of two outer swing highs (the shoulders) flanking a higher high (the head).
- The shoulders highs do not need to be of similar value to be classified as this pattern. However, the closer they are, the stronger the signal.
- Likewise, the swing lows points do not necessarily have to form a straight horizontal neckline.
- The price breaks below the neckline and it is a success when the price moves down from the neckline by the same distance as the neckline to the head.
Inverted Head and Shoulders Pattern
- A bearish trend is followed by three consecutive rounding bottoms.
- The three rounding bottoms consist of two outer swing lows (the shoulders) flanking a lower low (the head).
- The shoulders lows do not need to have similar prices; however, the signal is more powerful if they are closer.
- Moreover, the neckline created by the swing highs may be sloped instead of horizontal.
- The price breaks above the neckline and if it moves from the neckline by the same distance as the neckline to the head, the pattern is successful.
2. Rectangle Patterns
In the second position, we have the rectangle patterns. They are more or less the channel patterns without slopes, meaning that the trendlines are horizontal. Also, the continuation patterns are related to the double/triple patterns in which the success of either type of pattern is the failure of the other. In terms of success rate, the bullish rectangle pattern is 78.23% and the bearish rectangle pattern is 79.51%.
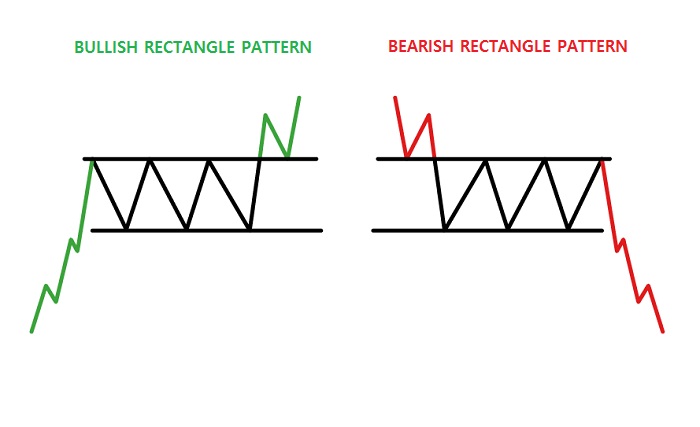
Bullish Rectangle Pattern
- An ongoing uptrend is followed by a series of two or more nearly identical highs and lows.
- As a result, it creates two parallel horizontal trendlines that can act as the support and resistance levels.
- In the case of the double/triple top pattern, the price will break below the swing low point (lower trendline or support). However, this does not occur in the bullish rectangle pattern. Instead, the price breaks above the swing high points (upper trendline or resistance).
- The pattern is considered a success if the distance of the price movement from the breakout point is the same as the width of the rectangular pattern.
Bearish Rectangle Pattern
- An ongoing downtrend is followed by a series of two or more nearly identical highs and lows.
- Two parallel horizontal trendlines are created (support and resistance).
- The price breaks below the lower trendline. If this never occurs and the price breaks above the upper trendline instead, it will be classified as the double/triple bottom pattern.
- The pattern is considered a success if the distance of the price movement from the breakout point is the same as the width of the rectangular pattern.
3. Triple Top/Bottom Patterns
The triple top/bottom patterns are what their name implies. These reversal patterns are basically the double top/bottom patterns with an additional rounding top/bottom. Wider rounding top/bottom means the signal is more reliable. The triple top pattern records a success rate of 77.59%, below the triple bottom pattern with 79.33%.
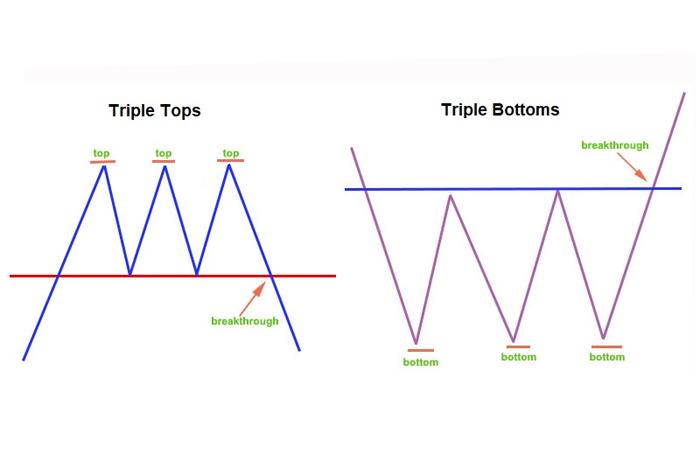
Triple Top Pattern
- An ongoing uptrend is followed by a double top pattern.
- The third rounding top occurs with a nearly identical high with the other two highs.
- The second swing low is formed, which is also nearly identical to the first swing low.
- The price continues to move to the downside until it breaks below the swing low points (lower trendline).
- The pattern is considered a success if the distance of downtrend from the breakout point is the same as the distance from the third high to the second swing low.
Triple Bottom Pattern
- An ongoing downtrend is followed by a double bottom pattern.
- The third rounding bottom occurs with a nearly identical low with the other two lows.
- The second swing high is formed, which is also nearly identical to the first swing high.
- The price continues its upward movement until it breaks above the swing high points (upper trendline).
- The pattern is considered a success if the distance of uptrend from the breakout point is the same as the distance from the third low to the second swing high.
4. Double Top/Bottom Patterns
The double top/bottom patterns are reversal patterns. Interestingly, the test result for these patterns is quite unusual as there is a significant margin of success rate between the double top pattern (75.01%) and double bottom pattern (78.55%).
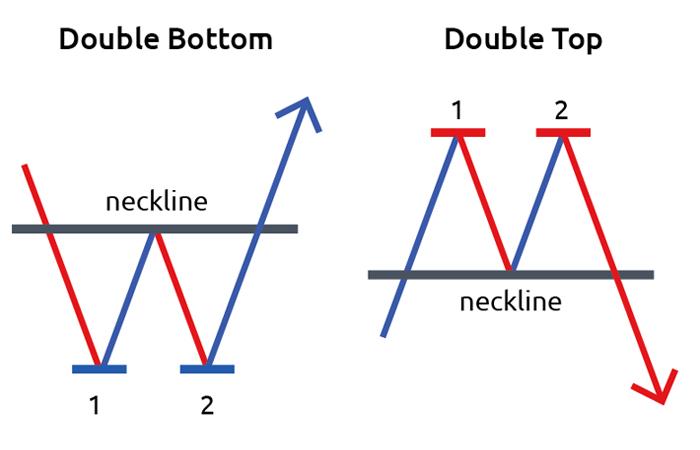
Double Top Pattern
- An ongoing uptrend is followed by a rounding top.
- The second rounding top occurs with a nearly identical high with the first rounding top, creating the swing low in the process.
- The two consecutive rounding tops resemble the letter "M". The wider the gap, the stronger the signal.
- The price continues to move lower until it breaks the swing low.
- The pattern is considered a success if the distance of downtrend from the breakout point is the same as the distance from the double high points (lower trendline) to the swing low.
Double Bottom Pattern
- An ongoing uptrend is followed by a rounding bottom.
- The second rounding bottom occurs with a nearly identical low with the first rounding bottom, creating the swing high in the process.
- The two consecutive rounding bottoms resemble the letter "W". A wider gap indicates a more powerful signal.
- The price continues to move higher until it breaks above the swing low.
- The pattern is considered a success if the distance of uptrend from the breakout point is the same as the distance from the double low points (upper trendline) to the swing high.
5. Channel Patterns
The channel patterns are like an elongated version of the flag patterns. Thanks to longer time frames, the channel patterns are proven to be more reliable than their sister patterns. The ascending channel's success rate is 73.03%, while the descending channel is slightly below at 72.88%.
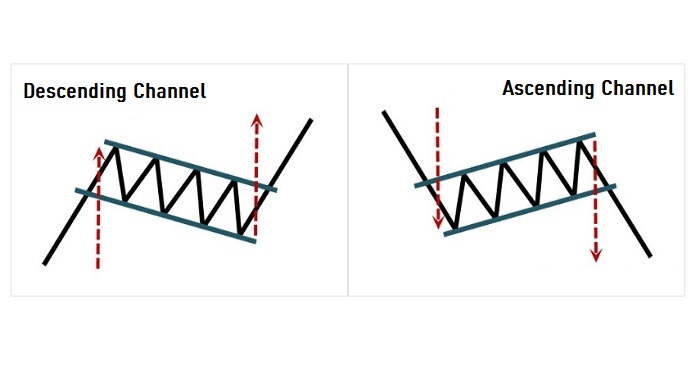
Ascending Channel Pattern
- A bearish trend followed by a long period of consolidation, indicated by a series of higher highs and higher lows.
- During consolidation, the upper trendline runs parallel with the lower trendline in an upward slope.
- The price crosses below the lower trendline and keeps moving until the extent of its overall bullish movement is the same as the distance of the initial bearish trend. This is how the pattern is deemed successful.
Descending Channel Pattern
- A bullish trend followed by a long period of consolidation, indicated by a series of lower highs and lower lows.
- The upper trendline runs parallel with the lower trendline during this period in a downward slope.
- It is a successful pattern if the price crosses above the upper trendline and keeps moving until the extent of its overall bullish movement is the same as the distance of the initial bullish trend.
6. Triangle Patterns
The triangle patterns are also continuation patterns. Unlike all of the patterns on this list, the triangle patterns do not have parallel markers in the consolidation period. Both upper and lower trendlines ultimately will converge at the right side and form a corner to create the triangle. The success rate is 72.77% for the ascending triangle pattern and 72.93% for the descending triangle pattern.
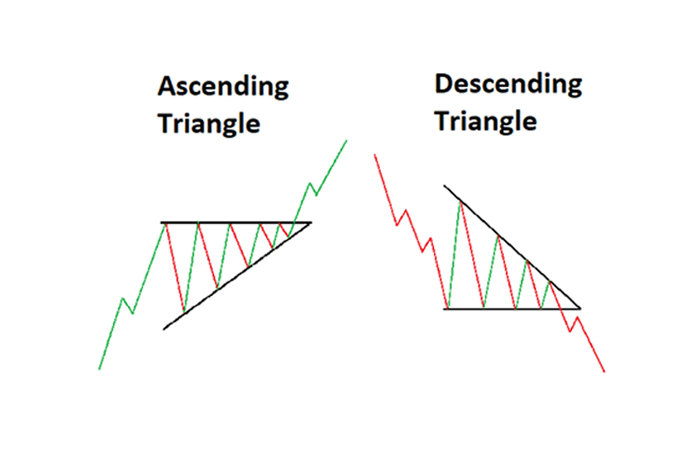
Ascending Triangle Pattern
- A bullish trending move is followed by a series of higher lows (typically two to three bars).
- The consolidation period is characterized by nearly identical highs that form a horizontal upper trendline, and rising lows that form an ascending lower trendline.
- Both upper and lower trendlines ultimately converge at the right side and form a corner to create the triangle.
- The triangle pattern is a success after the price breaks above the upper trendline and the distance that the price covers from the breakout point is the same as the width of the triangle.
Descending Triangle Pattern
- A bearish trending move is followed by a series of lower highs (typically two to three bars).
- The lows are nearly identical, forming a horizontal lower trendline.
- On the other hand, the highs are falling, forming a descending upper trendline.
- Both upper and lower trendlines create a corner on the right side.
- When the price breaks below the lower trendline, the pattern scores a success if the distance that the price covers from the breakout point is the same as the width of the triangle.
7. Flag Patterns
The flag patterns are continuation patterns. They are similar to the channel patterns by their parallel upper and lower trendlines. The difference is that the flag patterns have poles and that they are more commonly used in shorter time frames. The bullish flag pattern has a success rate of 67.13%, and the bearish flag pattern 67.72%.
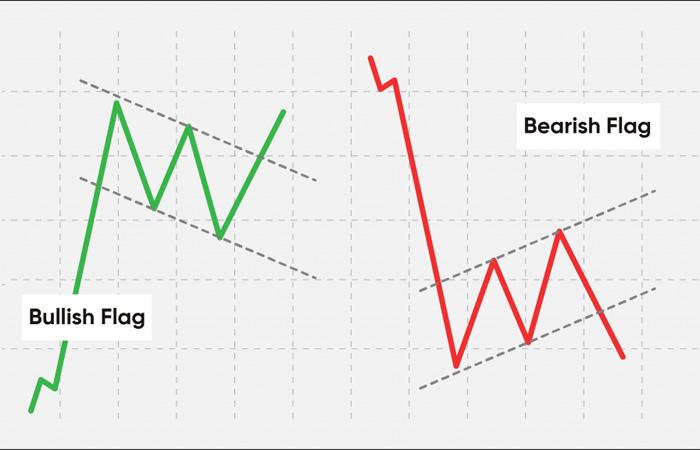
Bullish Flag Pattern
- The flagpole: a sharp price movement to the upside, signaling an uptrend.
- The flag: a period of consolidation during which the price moves against the trend immediately following the flagpole. This is indicated by a series of lower highs that typically consists of five to twenty bars. During consolidation, the upper trendline is parallel with the lower trendline.
- The bottom of the flag must not be below the midpoint of the preceding flagpole.
- The pattern is considered a success when the price breaks the upper trendline and continues the upward movement until it covers the same distance as the flagpole.
Bearish Flag Pattern
- The flagpole: a sharp price movement to the downside, signaling a downtrend.
- The flag: the price moves opposite of the trend immediately following the flagpole. A series of higher lowers (five to twenty bars) creates parallel trendlines.
- The bottom of the flag must not be above the midpoint of the preceding flagpole.
- A successful pattern occurs when the price breaks the lower trendline and continues making a bearish move until it covers the same distance as the flagpole.
See Also:
Now that you've learned what statistic says about these price patterns, we hope you can take advantage of this information for your future trading. Understanding the right price patterns can help you minimize the time spent for learning the not-so-accurate patterns.


2 Comments
Yoga
Nov 26 2023
Hey, I just had an epiphany. The price pattern, it looks like it originates from the chart, right? If that's the case, how on earth can we figure out these chart patterns? I mean, the price chart is made up of candlesticks, and it feels like a challenge to grasp the patterns that are unfolding in trading. It's not exactly like the examples shown in the article. The article did illustrate some lines being drawn to form certain patterns, but it still feels a bit tricky to comprehend what's happening in real-time.
Harry
Nov 28 2023
Understanding price patterns on a chart involves a mix of observation, analysis, and experience. Initially, it may seem challenging, but here's a practical approach. Start by learning the basics of common chart patterns like triangles and double tops. Get familiar with candlestick patterns, such as doji and engulfing patterns (read : 5 Most Important Candlestick Patterns in Forex Trading ), which offer insights into price movements. Use technical tools like trendlines and moving averages for confirmation. Practice on historical data, analyze past charts, and integrate news and events into your observations. It's also beneficial to combine chart patterns with indicators like RSI or MACD for more robust signals. Remember, experience plays a crucial role, so the more you engage in real-time trading, the more intuitive your pattern recognition skills will become.