 Dedicated FREE FOREX VPS
 Free FOREX Virtual Private Server
 MT4 Demo Contest, Get $500
 Sign Up for an Account, Claim 60% Deposit Bonus
 Free MT4/MT5 VPS 2024
 Send E-mail and Get Free Merchandise
 $1K Refer a Friend Bonus for Pepperstone Pro clients
 Maximize Your Earnings with 100% Deposit bonus
 Trade to Win, $5,000 Monthly Demo Contest
 Claim 30% + 15% Deposit Bonus from LiteFinance
In a heavily fluctuating forex market, trend plays a critical role in determining traders' profitability. That's why proper knowledge on how to confirm trend continuation plays a vital role to assist them in weathering the wavy cycle of forex market.
Trending market is a condition where a price generally moves in one direction, either upwards, downwards, or even sideways. In a forex market that generally moves in one direction or a limited range, the change from one price movement to the next is what will generate traders their profit or loss. There are four major factors that causing long-term or short-term trend fluctuations in forex market:
Contents
What Drives a Trend in the Forex Market?
These four major factors will cause both short and long term fluctuations in the forex market. So, it is imperative to know how all these elements come together to create a trend. Although these factors each have different categories, they are interacting and connected in tandem with each other, creating various effects on long and short term fluctuation in forex market.
The fiscal and monetary policies have significant effects on financial markets. The central banks can issue policies by raising and lowering interest rates, which in turn can effectively slow down or attempt to accelerate economic growth in a country. While government (fiscal) policies can be used to reduce unemployment and/or stabilize prices. The central bank can also make efforts by determining the prevailing interest rate and the money supply in the market.
The policies will impact on international transactions, which play a role in speculation, as well as supply and demand. Publication of government news, such as changes in spending and tax policies, as well as decisions by central banks to maintain or change interest rates have a dramatic effect on long-term trends.
Low-interest rates and tax rates can trigger consumption and economic growth. It tends to push the market price higher, but the market does not always respond positively to this due to other factors that may come into play. A higher interest rate and tax rate, on the other hand, reduce consumption and results in a long-run contraction or decrease in market prices.
In the short term, government and central bank policies can cause large fluctuations in prices as traders and investors buy and sell in response to this information. Increased activity ahead of an announcement like this could create a short-term trend, meanwhile, a long-term trend will start to form when investors have truly grasped and digested the impact of the announced information on the market.
2. International Transactions
The flow of funds between countries has an impact on the economic strength of a country and its currency. When there is a lot of money leaving a country, the country's economy will grow weaker and so will its currency. Countries that have more dominant export, whether goods and services, are constantly trying to bring more money into the country. This money can then be invested and stimulate financial markets within the country.
International transactions, the balance of payments between countries, and economic strength are more difficult to analyze on a day-to-day basis, but they play a large role in long-term trends in many markets. The forex market is a benchmark for how well a country's currency and economy is doing compared to the currencies of other countries. A high level of demand for a currency means that it will strengthen against other currencies. If a country's currency is weak, this will reduce investment in that country, as potential profits are eroded by a weak currency.
3. Speculation and Expectations
Speculation and expectations are integral parts of the financial system. Speculation happens when consumers, investors, and politicians believe that the future economy will be impacted by actions and events taken today. These expectations of the future event will form trends in the market. Sentiment indicators are commonly used to measure how certain market players feel about current economic conditions. The analysis of this component and other forms of fundamental and technical analysis can create a bias or expectation of the price level that would come and the direction of the trend.
Analysis and positions taken by traders and investors based on information about government policies and international transactions will create speculation about where prices will move. When enough people agree on a certain direction, the market will enter into a trend that can persist on its own for a certain period of time. Trends can also be created by market participants who are wrong in their analysis, in which those who are forced to exit and liquidate their losses can push the price further in a certain direction.
4. Supply and Demand
The supply and demand for products, currencies, and other investments have created a push and pull dynamics in pricing. Prices and interest rates shift in sync with changes in supply and demand. If supply fails to keep up with demand, the price will go up. If the supply rises over current demand, prices will fall. If supply is relatively stable, prices can fluctuate up or down along with changes in the level of demand.
Supply and demand affect individuals, companies, and financial markets as a whole. In some markets, such as the commodity market, supply is determined by the number of physical products. For example, supply and demand for oil are constantly changing. When supply decreases and demand increases, a long-term increase in the price of oil can occur.
All markets have similar dynamics. The stock market, for example, fluctuates on a short and long term scale and creates trends. The threat of supply diminishing at current prices forces buyers to buy at higher and higher prices, creating large increases in prices. If a large group of sellers is about to enter the market, this will increase the offering level of the available shares and can push the price down. This happened almost every time.
All in all, the governments, international transactions, speculation, or expectations, as well as supply and demand, are strongly connected in line with the expectations of future conditions currently shaping decisions that create trends. The authorities influence trends largely through fiscal and monetary policies. These policies affect international transactions which in turn will affect economic strength. Speculation and expectations will drive prices based on what the future holds, driving a difference between supply and demand. Finally, changes in supply and demand will create trends as many market players try to get the best price.
How to Identify Price Trends
Forex traders generally prefer high volatility. In general, following the direction of the trend or becoming a trend follower is regarded as safer and profitable, and the trend following strategy is reliable. Liquidity is very important in a trend-based strategy. Currency pairs with high liquidity will have more movements (aka volatility) that we can expect.
It is important to note that to follow the direction of the trend correctly, we must be able to identify a situation where a trend continuation will occur or when a trend reversal will occur.
A situation is called trending when many traders trade in the same particular position (buy or sell). This situation can be corrected if some traders take profit (profit-taking). When more traders close their positions or trade in the opposite position, a trend reversal occurs. However, it is not easy to identify corrections and trend reversals.
The continued correction will cause a reversal if it breaks the support or resistance level. So, predicting a state of correction will end (return to the original trend) or continue (trend reversal) is rather difficult. It is relatively easy to identify trend continuation. If the uptrend will continue, then we will tend to go long. If the downtrend continues, we will tend to go short.
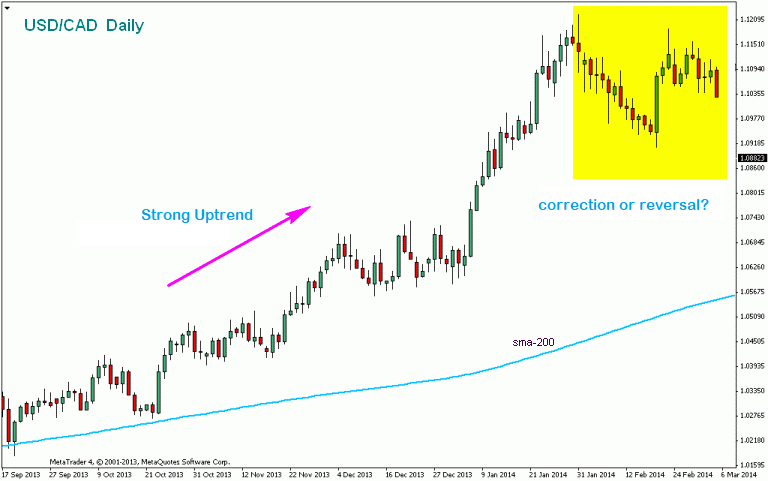
Many traders use the moving average indicator to identify the direction of the trend, especially the 200-day SMA for a long-term trend. The further the price moves above the SMA indicator, the stronger the uptrend is. As another rule of thumb, a strong uptrend occurs when higher highs are formed (current high levels are higher than before) and higher lows (current low levels are higher than before) occur. As for downtrends, lower highs and lower lows are needed for confirmation.
Now, if a lower high and lower low is formed in an uptrend, does this indicate a correction or a trend reversal?
The correction occurs temporarily since traders seem to return to their original position after short profit-taking. Unfortunately, many traders (especially beginners) are wrong in anticipating a correction by entering the opposite position because they think a trend reversal will occur.
Characteristics of a Correction
On the trading chart displayed, corrections can be formed in various patterns. The most common correction is the 3-wave correction or zigzags in the Elliott Wave theory. Oftentimes, the zigzag pattern is combined by a triangle pattern like on the USD/JPY daily chart below:
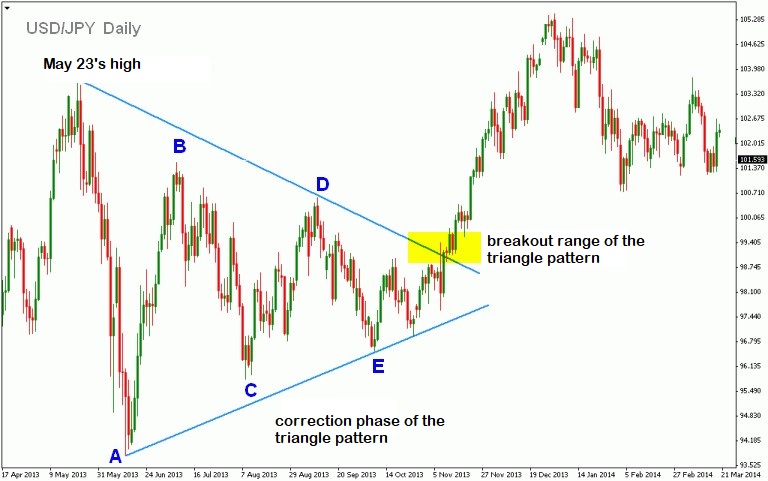
There seems to be a 'triangle correction' for 5 months before the break and USD/JPY resumed its trend in early November 2013.
Besides the triangle zigzag pattern, another Elliott Wave correction pattern is the ABC zigzag. Usually, wave B is the shortest of all waves (compared to wave A and wave C). A zigzag formation can occur 2 to 3 times continuously, but always in the order of A-B-C, A-B-C, and so on. Here's an example of a 3-wave ABC zigzag correction pattern on a GBP/USD daily chart:
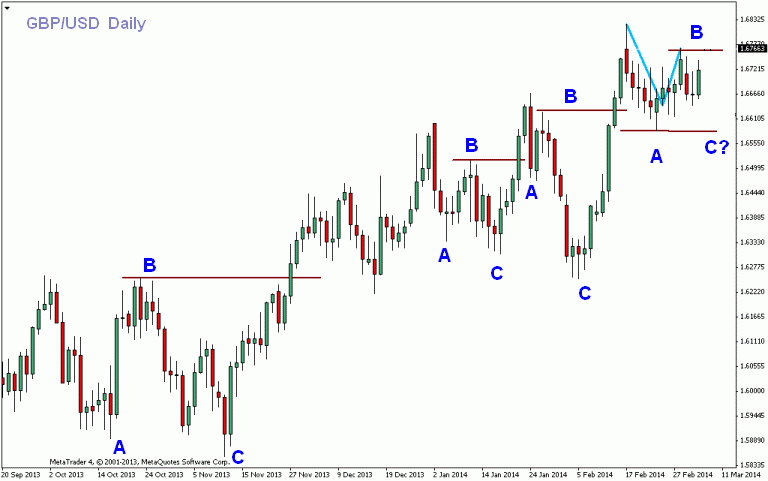
The breakout will occur after wave C ends and the price breaks the highest price of wave B. The example above is a correction that occurs in 3 waves, such as Elliott's theory that the main trend usually consists of 5 impulsive waves and correction of 3 corrective waves. It is not easy to identify these waves. And if it is difficult to recognize a wave pattern to differentiate between impulsive or corrective, it is better not to enter the market until the wave pattern is distinctive enough.
See Also:
3 Powerful Indicators for Trend Trading
Since in a trending market, the price generally moves in one direction. Thus, we can analyze and predict price trend by observing indicators such as the ADX indicator, Simple Moving Average, and Bollinger Bands.
Trend Trading With ADX
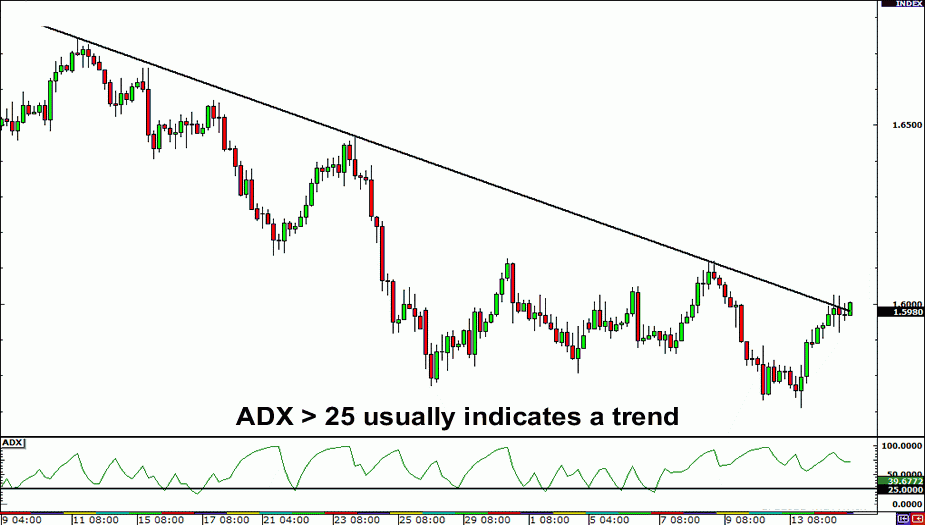
One way to determine whether the market is currently trending or not is to use the Average Directional Index (ADX) indicator, developed by J. Welles Wilder. This indicator uses an order of values ranging from 0-100 to measure the strength of a price that is moving in one direction.
If the value reaches more than 25, it usually indicates that the price is in a strong trend. The higher the ADX value is, the stronger is the trend. However, ADX is a lagging indicator that cannot always be relied on to predict the future. This indicator is also non-directional, which does not move alongside the ups and downs of the price. This is because ADX measures the strength of the trend, which of course we cannot see with the naked eye on the chart.
Even though the trend is down, ADX will continue to rise to a positive level if the downtrend is strong. Conversely, if there is a weakening in the uptrend, ADX will move downwards even though the price on the chart may still appear to be moving up.
As an example, take a look at the chart below. The price is experiencing a downtrend, but ADX is moving above the 25 levels. This suggests that the decline in prices is still strong.
Trend Trading With Moving Average
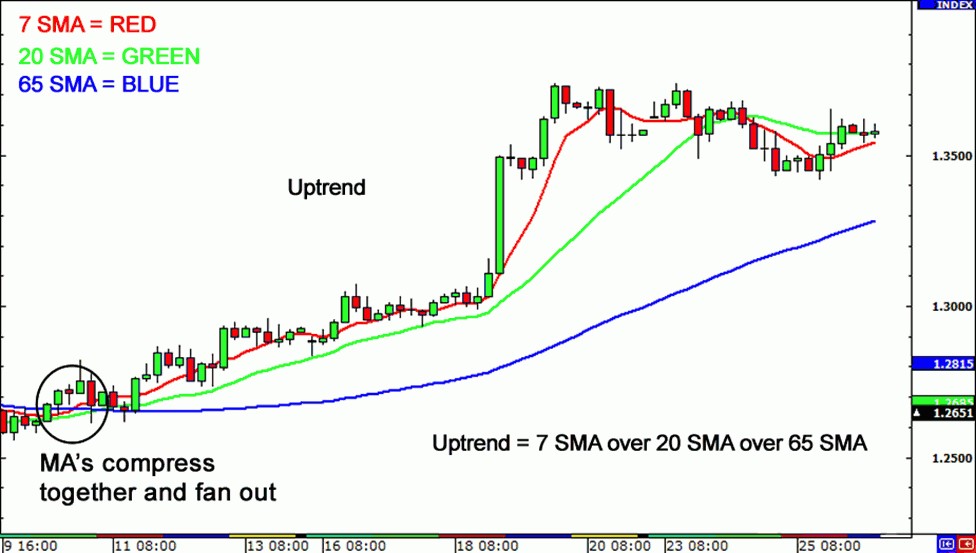
If you are not a fan of ADX, you can also use moving averages. Place three Simple Moving Average (SMA) indicators as follows: period 7, period 20, and period 65 on your chart. Then, wait for the three SMA lines to cross each other and start spreading. If the period 7 SMA comes above the period 20 SMA, and the period 20 SMA is above the period 65 SMA, then the price can be confirmed to be in the uptrend.
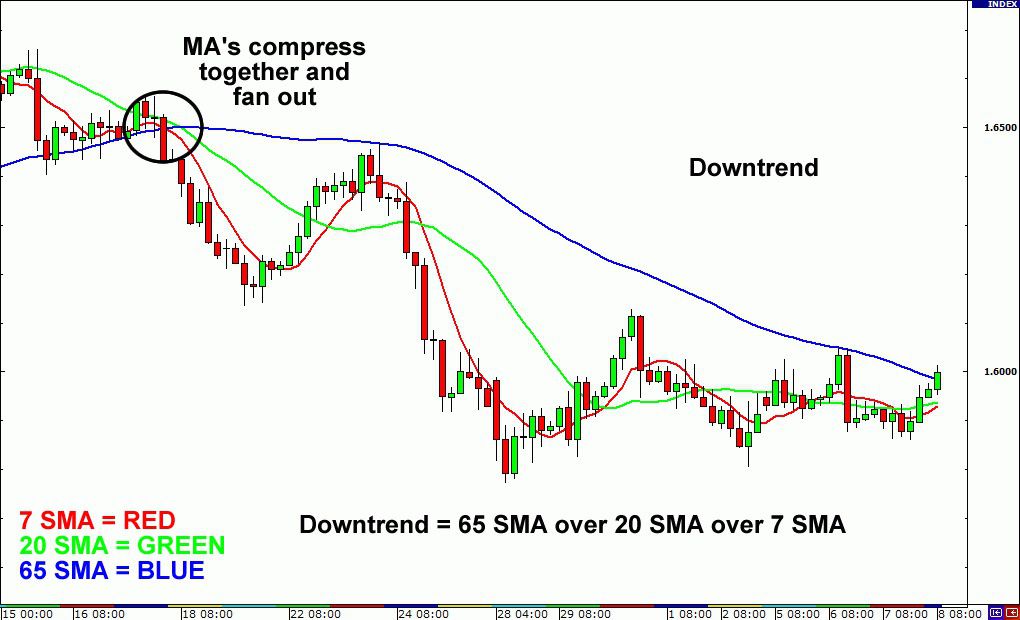
On the other hand, if period 7 SMA is below period 20 SMA, and period 20 SMA is also lower than period 65 SMA, the indicators show that the price is experiencing a downtrend.
Trading Trends with Bollinger Bands
Indicators used to measure volatility can also help you find trends. At the moment, we are talking about Bollinger Bands, an indicator that uses standard deviation measurements and consists of bands that form dynamic price channels.
The following is a chart that explains how you can use Bollinger bands to determine a trend:
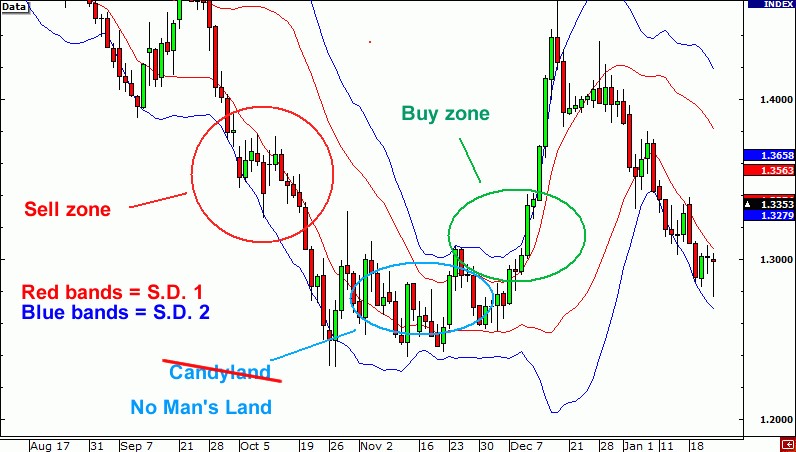
You can place Bollinger bands with a standard deviation of 1 and another set of bands with a standard deviation of 2.Then you will see 2 sets of zones on the price:
- The Sell Zone is the area between the low standard deviation 1 (SD 1) and standard deviation 2 (SD 2) bands. Remember to always confirm the signal by waiting until the price has closed outside the band area.
- The Buy Zone is the area between the top standard deviation 1 (SD 1) and standard deviation 2(SD 2) bands. As with the sell zone principle, you need to make sure that the price has closed up outside the area of the two bands above.
Bollinger bands make it easier for you to visually confirm a trend, where a downtrend can be confirmed when the price is in the sell zone and an uptrend can be confirmed when the price is in the buy zone.
One thing you should know about trends is that they are quite rare. Contrary to what you may believe, the sideways condition takes up about 70 to 80 percent of the overall price movement, which leaves trending conditions that occur only as much as 20 to 30 percent. This rare probability is what makes trading with confirmed trends have higher profitability than other price situations.
3 Ways to Identify the End of a Correction and Trend Continuation
With the end of a correction, a trend-forward momentum will occur with the possibility that the trend will continue in the same direction as before the correction. There are 3 possible scenarios of how the correction will end:
- The price breaks the corrective high level for an uptrend or corrective low for a downtrend.
- The price breaks the upper corrective channel (upper channel line) for an uptrend or breaks the lower corrective channel (lower channel line) for a downtrend.
- The RSI indicator breaks in the direction of the trend before the correction occurs.
1. Price breaks at the corrective level.
An example of a price break at the corrective high level is like what happens in the previous GBP/USD daily chart. Traders can opt to sell the currency when wave B ends, and entry buys when level B is broken (break). Another example can be taken from the NZD/USD chart below:
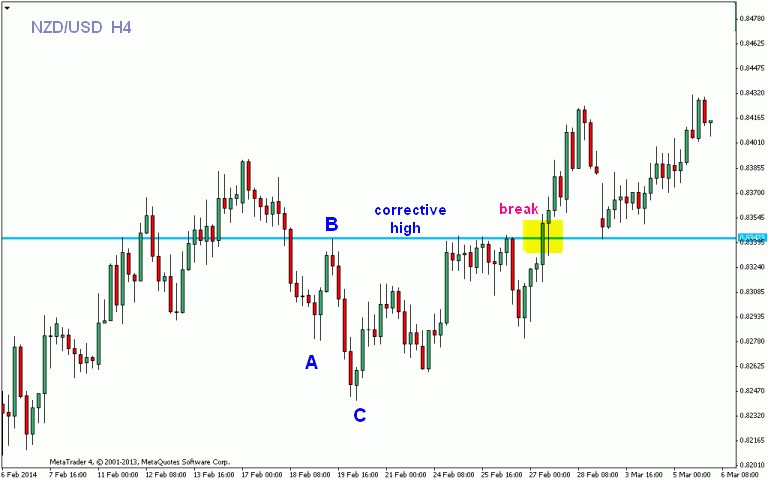
Traders can buy above the corrective high level after the price breaks level B.
2. Price breaks on the corrective channel.
Repeated corrections will tend to form a channel, both in an upward and a downward movement. The end of the correction is indicated by the break of the channel line in the direction of the trend before the correction occurs.
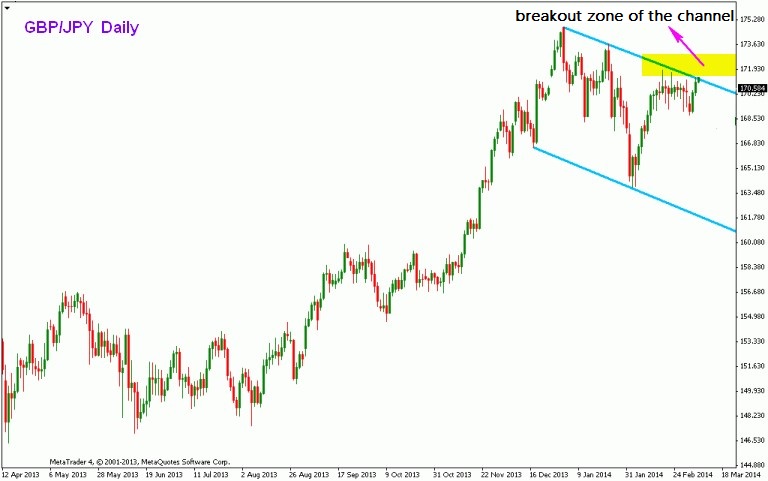
In GBP/JPY chart above, traders can buy after the price breaks (break) the upper downtrend channel line or entry on the channel breakout zone.
3. The RSI indicator breaks in the direction of the trend before the correction occurs.
In this case, we don't have to use the ABC correction wave analysis to identify the breakout. Instead, we can base our analysis on the movement pattern of the RSI indicator which moves in the direction of the price movement trend, and then breaks in the opposite direction. In the example of EUR/USD H4 chart below, we can buy above the RSI break level.
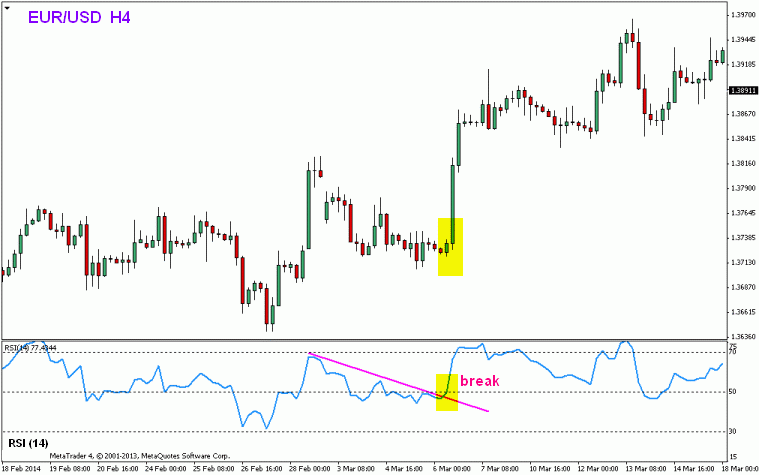
This method is indeed aggressive considering that after the RSI break there could be another correction. The safest way is to combine ABC correction wave analysis with RSI break.
If you prefer trading with trend reversal, there are actually ways to do it in a simple way with no help from complicated indicator signals. Learn the strategy and don't forget to practice it in a forex demo account before using it for live trading.


9 Comments
Sean Scott
Oct 10 2020
I have to say that using indicators might feel 'too advanced' for some traders or 'too intimidating'. Especially one that barely starts trading. Is it possible to identify trend continuations another way? Perhaps with candlestick patterns? That might be easier to spot.
Gerard
Jun 10 2023
@Sean Scott: Absolutely! Indicators can indeed feel overwhelming for new traders, and relying solely on them may not be necessary. Identifying trend continuations can be achieved through various methods, including the analysis of candlestick patterns.
Candlestick patterns provide visual representations of price movements and can offer valuable insights into market trends. Patterns such as the "bullish/bearish engulfing," "doji," or "hammer" can indicate potential trend continuations or reversals. By observing these patterns in conjunction with other factors like support and resistance levels or trendlines, traders can gain a clearer understanding of market dynamics and make more informed trading decisions.
The advantage of using candlestick patterns is their simplicity and ease of recognition, making them accessible even for beginners. By studying and familiarizing yourself with these patterns, you can develop a solid foundation for identifying trend continuations without relying heavily on complex indicators.
Judith Flores
Nov 30 2020
Nice article! People tend to focus on reversal for trading and forget about trend continuations. While I do belive that reversal can be a good trading strategy, I feel like it can be too complicated and risky for some people. Trend continuations don't have the same amount of risk as a reversal. However, considering markets are unpredictable I highly suggest you guys set a Stop Loss and Take Profit on every trade.
Andrew Ross
Jan 9 2021
Can the ADX indicators help to determine the entry point? Or is it just there to determine whether the market is trending or not? I am new to these things and since there are a lot of indicators, I am kind of confused about what they can do.
Justin
Jan 10 2023
@Andrew Ross: Hey there! When it comes to the ADX indicator, its main purpose is to help determine whether the market is trending or not. It's not specifically designed to pinpoint entry points for trades, so it won't give you direct guidance on when to enter a trade.
The ADX indicator consists of three lines: ADX itself, along with the +DI and -DI lines. The ADX line usually ranges between 0 and 100. If the ADX value is higher, it suggests a stronger trend, and if it's lower, it indicates a weaker or non-existent trend. The +DI line measures upward price movement, while the -DI line measures downward movement.
While the ADX indicator can tell you if there's a trend in the market, it doesn't provide specific entry or exit points for trades. To determine entry points, traders often use other tools like moving averages, support and resistance levels, or candlestick patterns in combination with the ADX indicator.
It's essential to remember that indicators shouldn't be used on their own. They are just part of a larger trading strategy that takes into account various factors, including market conditions, price patterns, and risk management principles.
MJay
Jan 9 2022
Excellent article
Steve Odira
Jun 23 2023
Alex
Jan 22 2024
It's mentioned that sentiment indicators are frequently employed to gauge the prevailing feelings of various market participants about the current economic situation. The aim is to understand when the market might experience a price decline or increase, and this determination relies on sentiment indicators encompassing consumer, investor, and political sentiments.
My query pertains to how elections impact economic changes in the market. Specifically, I'm curious about whether elections, in comparison to other indicators, have the potential to cause significant market volatility. I'm keen to grasp more about sentiment indicators, especially given the numerous elections happening in various countries this year. Thanks for shedding light on this!
Yerry
Jan 24 2024
In my opinion, onto your question about elections and their impact on the market. Elections can indeed shake things up in the economic landscape. The sentiment during elections, especially when compared to other indicators, has the potential to cause significant market volatility. Political shifts can influence investor confidence and market reactions but remember, it is not always one of the crucial that make market move but you need nto keep an eye of the economic of the country too. Also you read : Macro Trading: A Fundamental Approach to Your Strategy
Given the slew of elections happening around the globe this year, keeping an eye on sentiment indicators becomes even more crucial. They give insights into how the market might respond to the political changes. If you're navigating these market waters during election times, staying informed about sentiment indicators could be a game-changer. Hope this gives you the lowdown you were looking for! Feel free to hit me up with more questions.