 Dedicated FREE FOREX VPS
 Free FOREX Virtual Private Server
 MT4 Demo Contest, Get $500
 Sign Up for an Account, Claim 60% Deposit Bonus
 Free MT4/MT5 VPS 2024
 Send E-mail and Get Free Merchandise
 $1K Refer a Friend Bonus for Pepperstone Pro clients
 Maximize Your Earnings with 100% Deposit bonus
 Trade to Win, $5,000 Monthly Demo Contest
 Claim 30% + 15% Deposit Bonus from LiteFinance
Not only identifying market trends, but the supertrend indicator also works to spot buy and sell potentials as well as dynamic stop-loss levels for better protection against the risk.
In the world of trading, you've probably heard the saying, "follow the trend." This phrase is pretty common in trading discussions and serves as a reminder, especially for beginners.
Why is it so important? Well, trading in the direction of the trend comes with several advantages. It increases your chances of success and often offers a better balance between risk and reward.
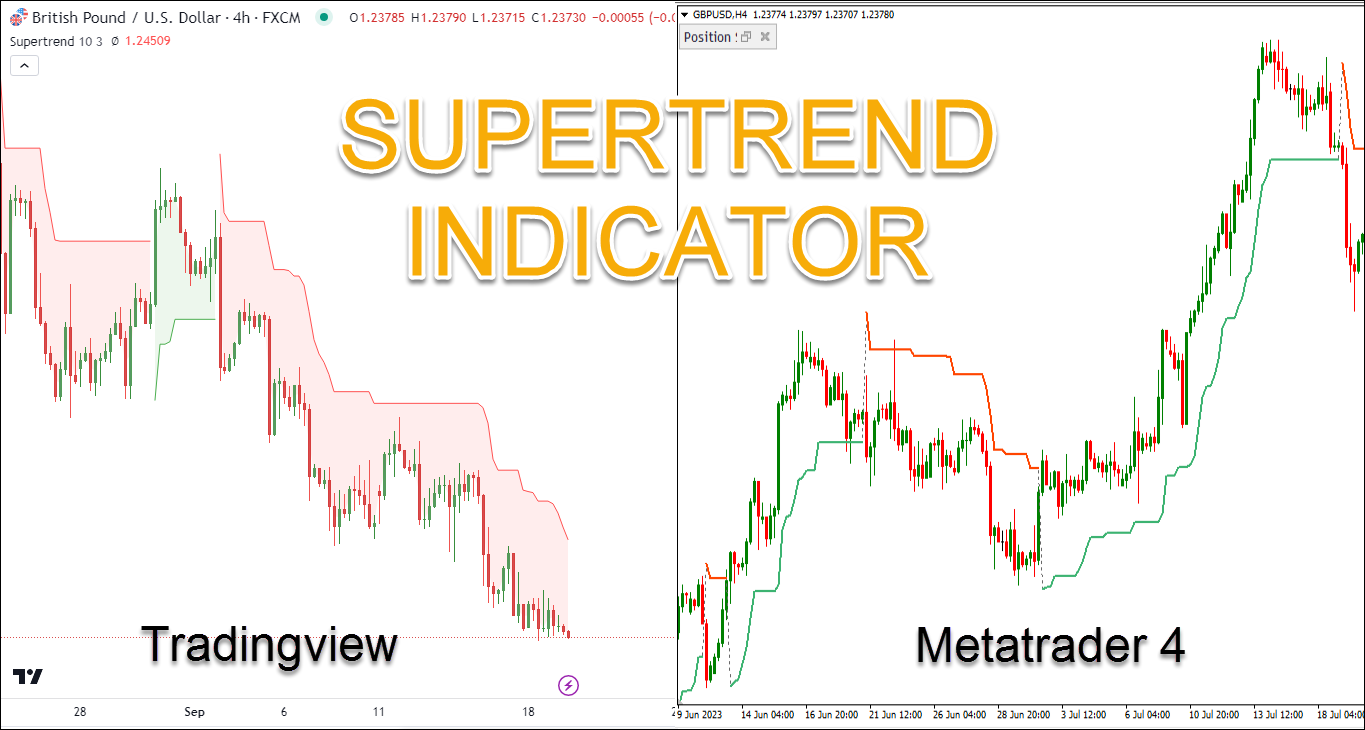
Now, if you want to follow the trend, a great tool to use is the Supertrend indicator. This indicator is excellent at showing you which way the trend is going and helps you figure out the best times to get in and out of trades.
But that's not all. You can also combine the Supertrader with other indicators like MACD, RSI, MA, or Stochastic to improve your trading results.
What Is Supertrend Indicator?
Supertrend is a trend-following indicator that relies on the Average True Range (ATR) for its calculations. What sets it apart is its ability to factor in market volatility, making its trend assessments more precise.
Supertrend will help you to spot the trend direction and potential entry or exit points. You can use it for a variety of financial markets, like forex, stocks, commodities, and cryptocurrencies.
Supertrend Indicator Formula
Here are the formulas for the Supertrend indicator:
Upper Line = (High – Low) / 2 + multiplier x ATR
Lower Line = (High – Low) / 2 - multiplier x ATR
Where:
- High represents the peak price.
- Low represents the lowest price.
- ATR is the Average True Range
To calculate the ATR, use this formula:
ATR = ((previous ATR x 13) + current TR) / 14
How to Install Supertrend Indicator to MetaTrader?
The Supertrend indicator doesn't come pre-installed in MetaTrader platforms, so you'll need to install it yourself. To do this, you can follow the steps outlined below.
- Download the Supertrend Indicator file. You can download the indicator from MQL5, Earnforex, or Indicatorspot.
- Access the data folder in MetaTrader. You can do this via File -> Open Data Folder.
- Inside, locate the MQL4 or MQL5 folder.
- Now, simply copy all the folders from the downloaded archive and paste them directly into the MQL4 or MQL5 folder.
- After completing these steps, restart MetaTrader.
How to Use Supertrend Indicator?
To use the Supertrend indicator in your trading, you can follow the following guide.
Using Supertrend Indicator in MetaTrader
- Choose the chart and timeframe where you'd like to add this indicator.
- Click the "Insert" option located at the top of the panel.
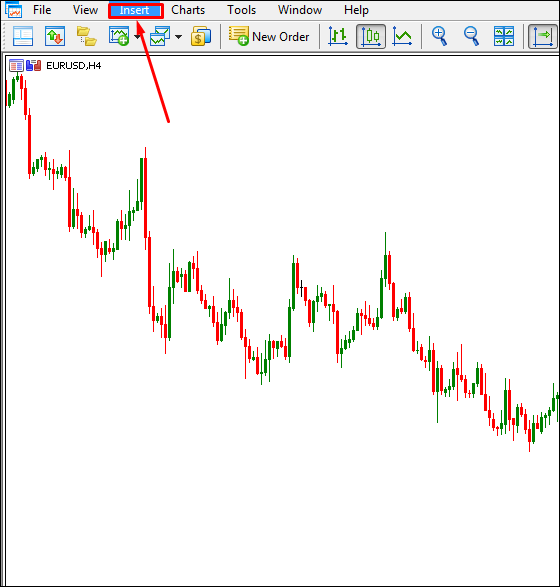
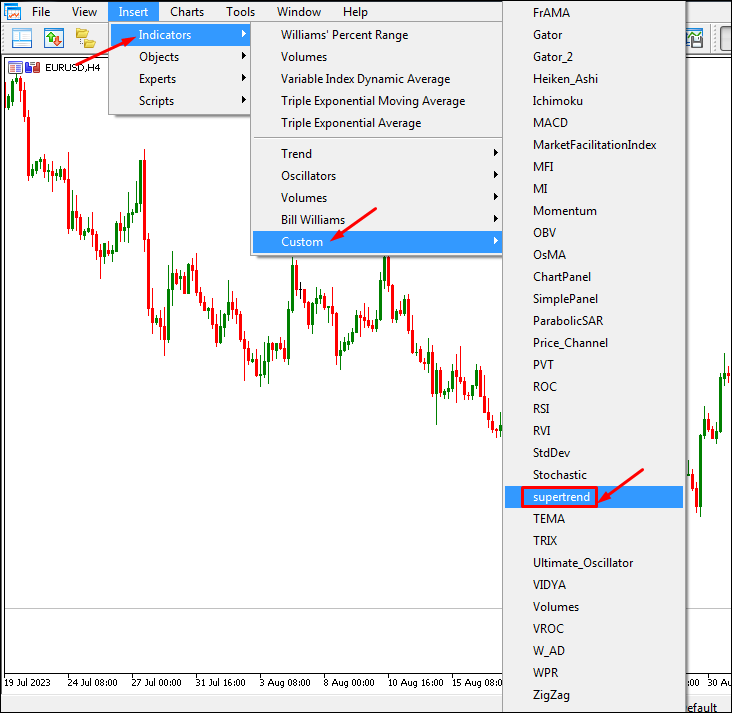
- From there, pick "Indicators," then opt for "Custom", and finally, select "Supertrend".
- A window for the Supertrend will pop up; simply click "OK".
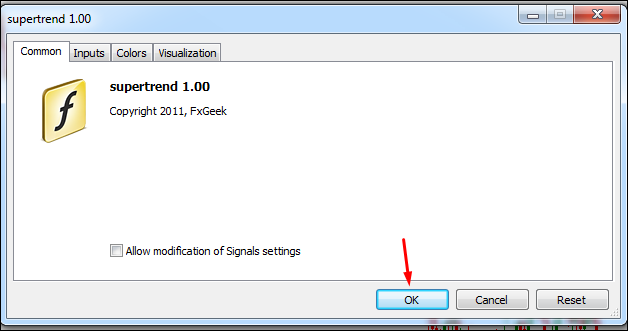
- Your indicator is now prepared for use.
Using Supertrend Indicator in Tradingview
- Open TradingView and select the chart you want to use.
- Click on the "Indicators" at the top of the screen.
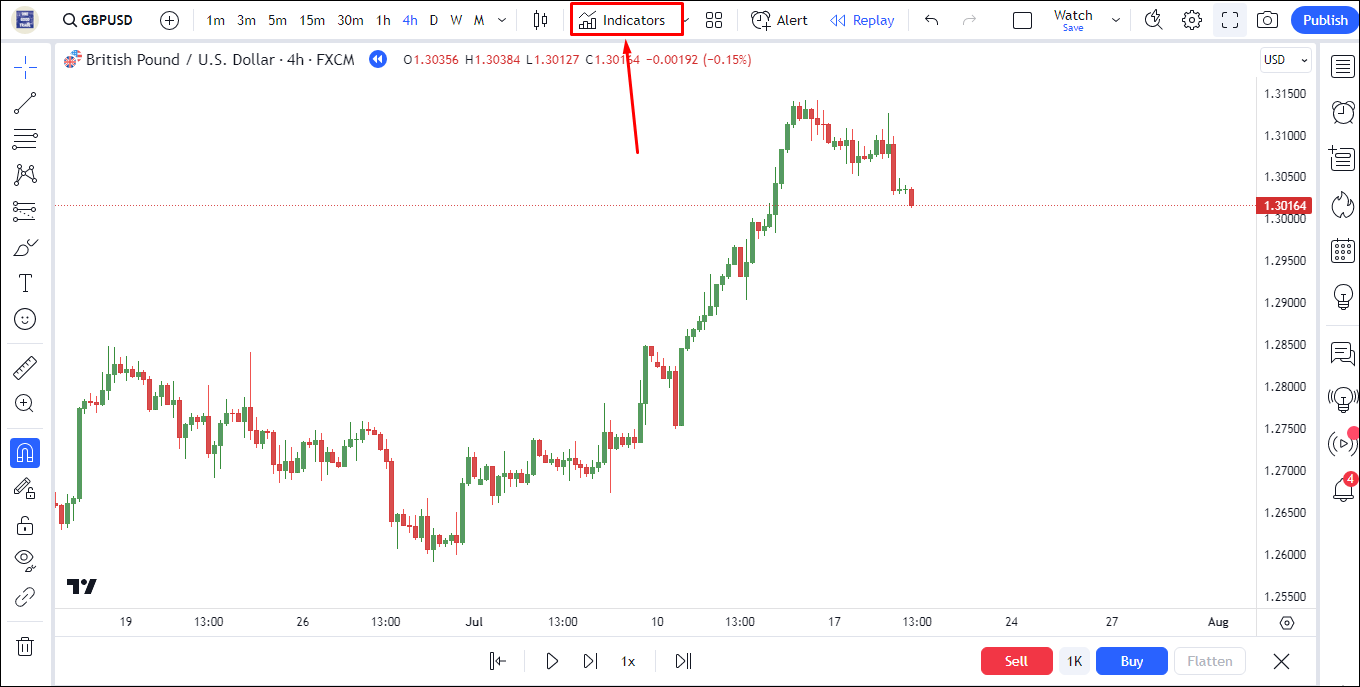
- In the search box, type "Supertrend" and select it from the dropdown list.
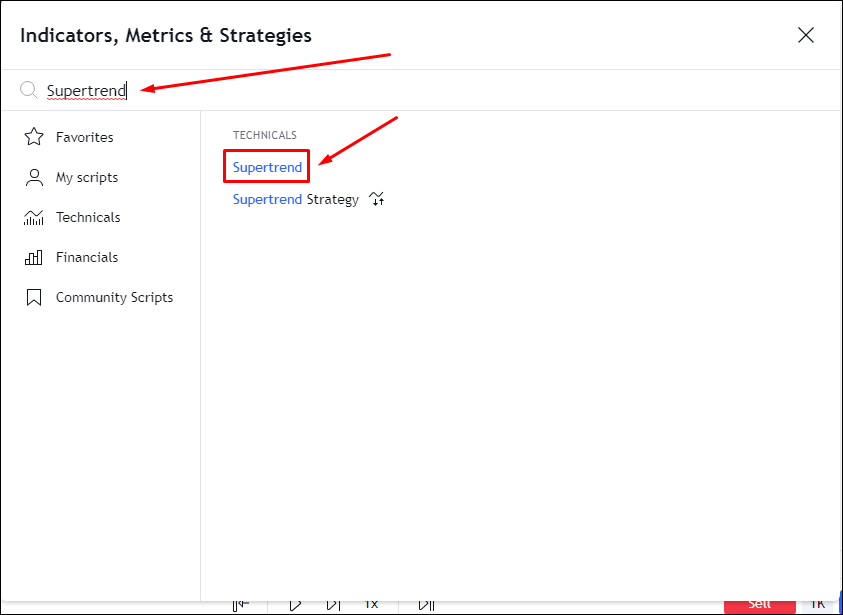
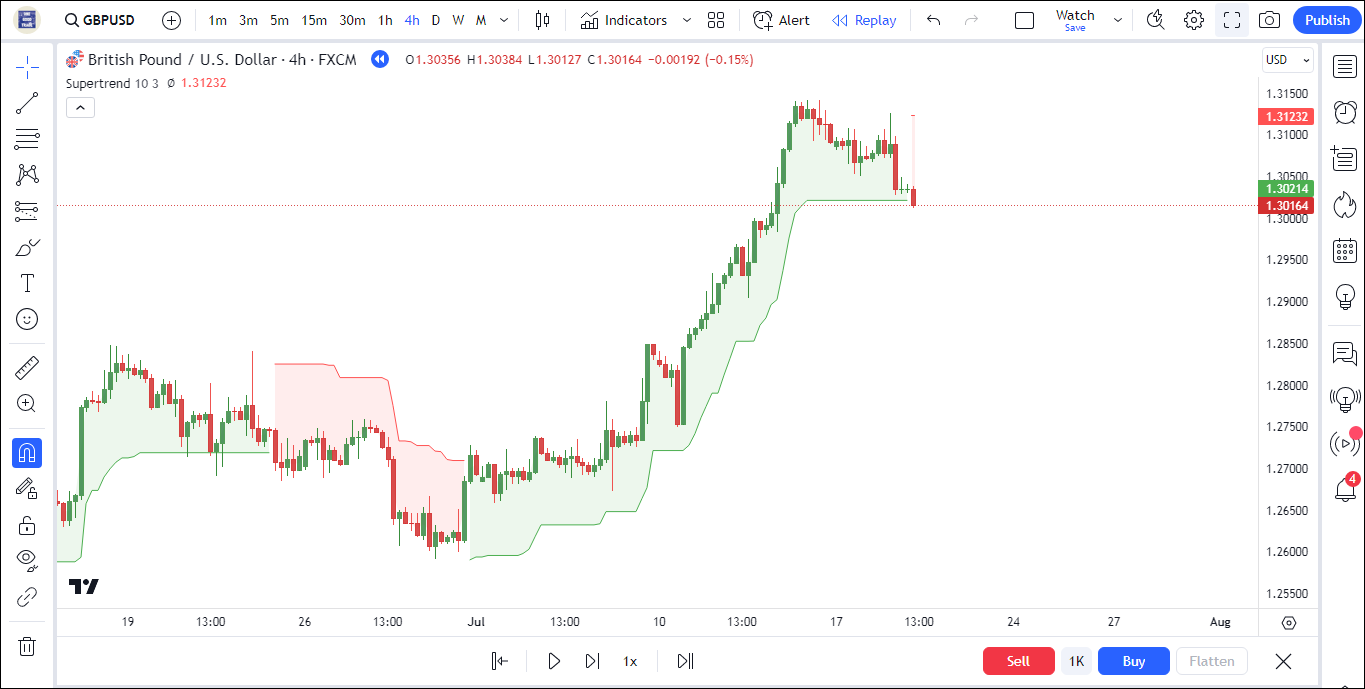
- The Supertrend Indicator will be added to your chart.
Trading with Supertrend Indicator to Identify Trend
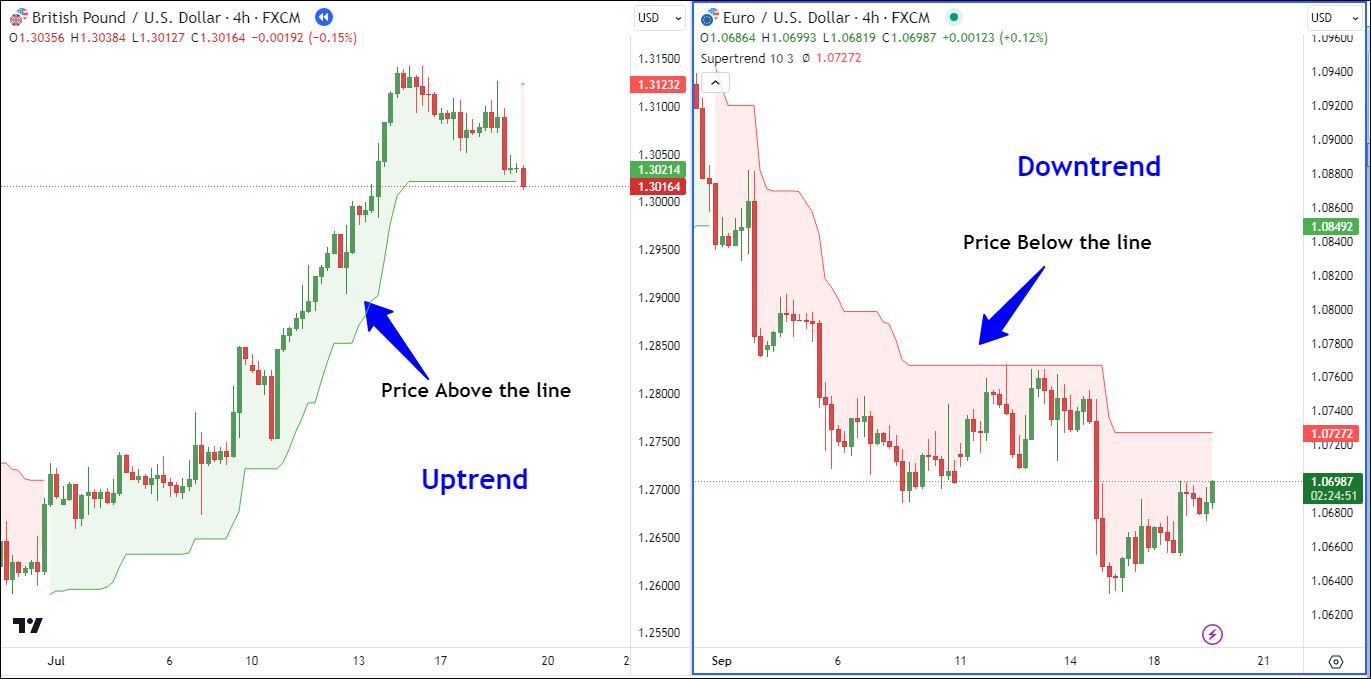
The Supertrend indicator helps identify trends in a more straightforward way. Just pay attention to the way it moves and how the color changes.
- When the price drops below the indicator line, it turns red, signaling a downtrend.
- On the flip side, when the price climbs above the line, the indicator turns green, indicating an uptrend.
Each time the price closes above or below the Supertrend, it signifies the start of a new trend.
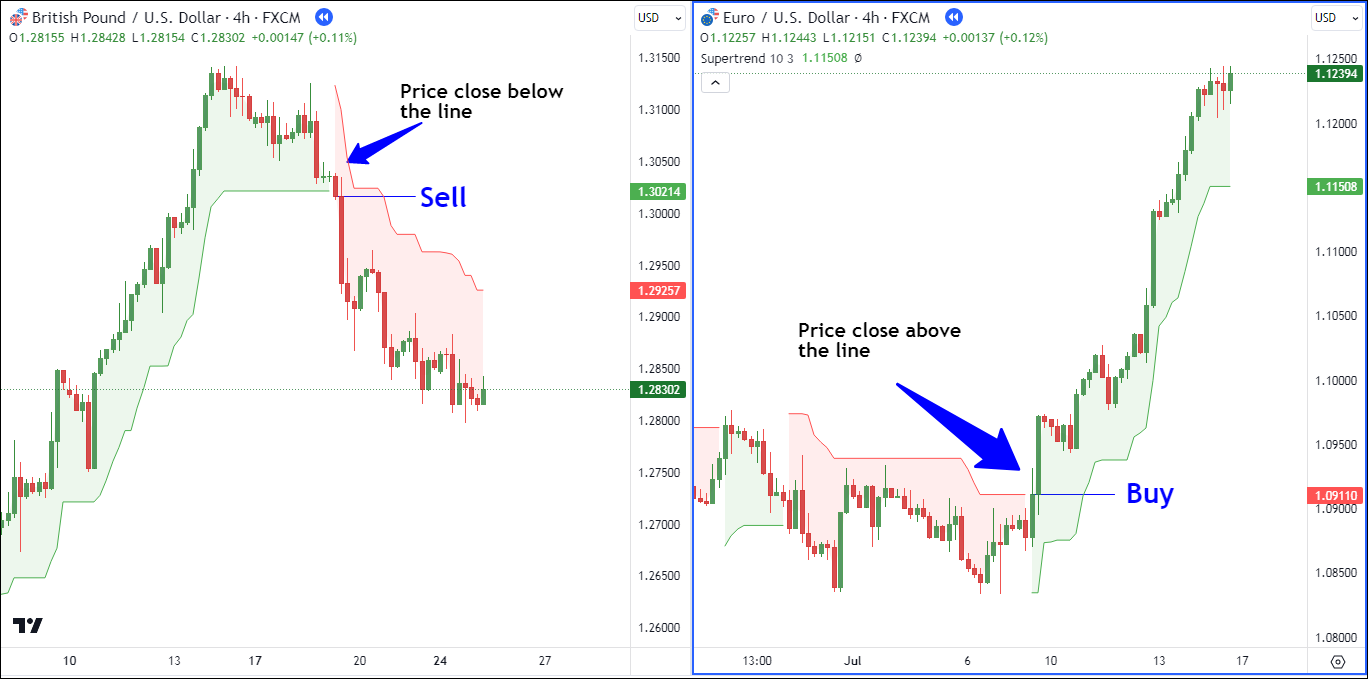
Trading with Supertrend Indicator to Generate Buy and Sell Signals
The Supertrend indicator performs well in markets that are clearly trending, whether it's an upward trend or a downward trend. You can easily spot buy and sell signals by looking at when the indicator changes in relation to the closing price.
When the Supertrend indicator closes below the price and changes to green, it generates a buy signal. Conversely, when the Super Trend closes above the price and turns red, it produces a sell signal.
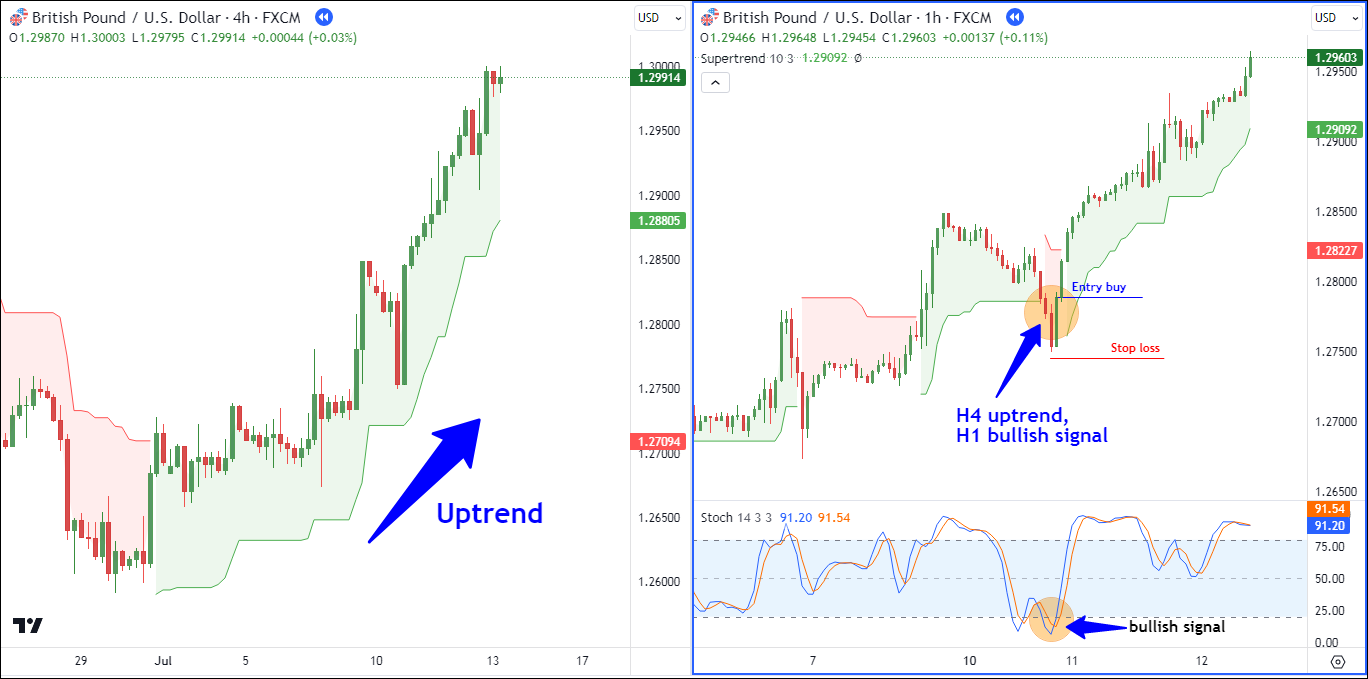
Combine Supertrend with Other Indicators (Multi-Timeframe Analysis)
This strategy combines the Supertrend indicator with other indicators in a multi-timeframe analysis.
Start by using the Supertrend indicator on a higher timeframe to determine if the market is in an upward (bullish) or downward (bearish) trend. When the price is above the Supertrend line, it's a positive sign indicating an upward trend.
During an uptrend, it's a good time to think about buying, while in a downtrend, it's a signal to consider selling.
Then, shift your attention to the MACD and Stochastic indicators on a lower timeframe to confirm a buying opportunity. To confirm this, look for signals such as the MACD crossing above its signal line or the Stochastic displaying a bullish sign. This confirmation indicates that it's a favorable moment to enter the market.
Trading Scenarios with Supertrend Indicator
To help you understand better, I'll give you two examples of how to use the Supertrend indicator in trading.
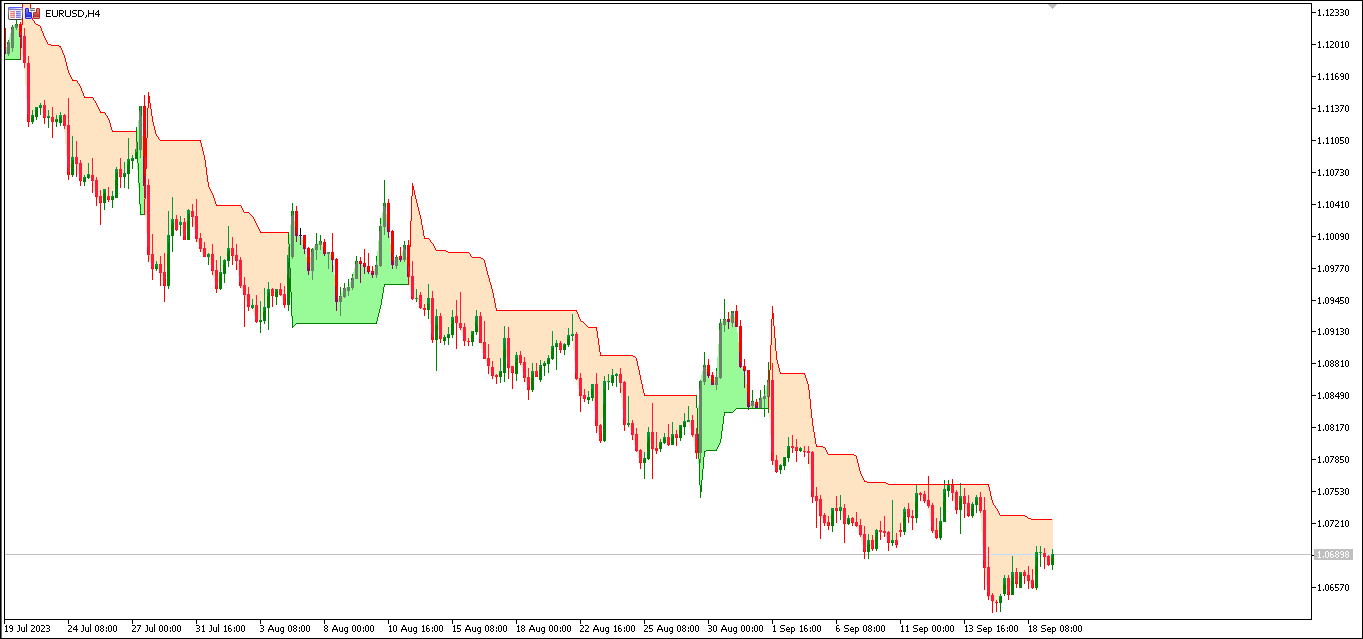
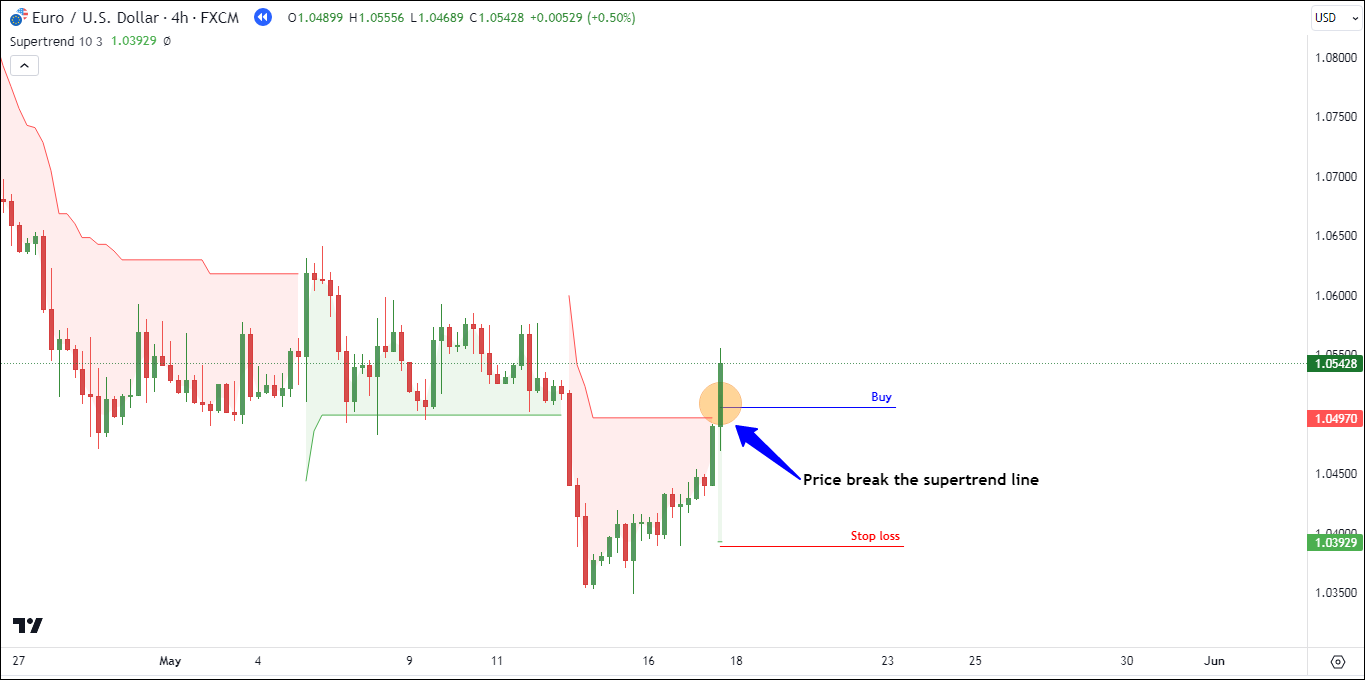
#1 EUR/USD - Buy
In the H4 chart for EUR/USD below, we can see that the price is currently following a downward trend. It's worth noting that the price is positioned below the Supertrend indicator line. To initiate a buy position, we patiently wait until the red color changes to green, indicating a shift toward a bullish trend.
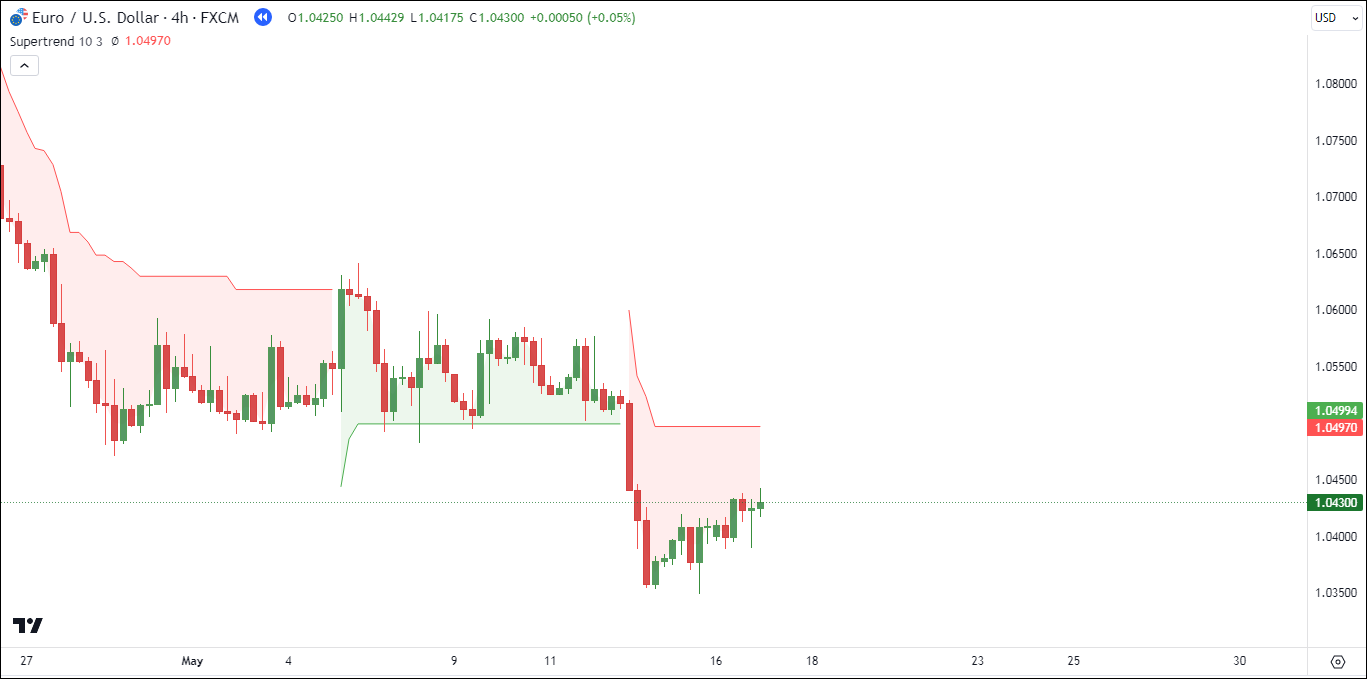
As the price continued to rise and broke through the support line, the buy position was activated. It was entered at around 1.05063, and a stop loss was set at 1.03929 (113.4 pips).
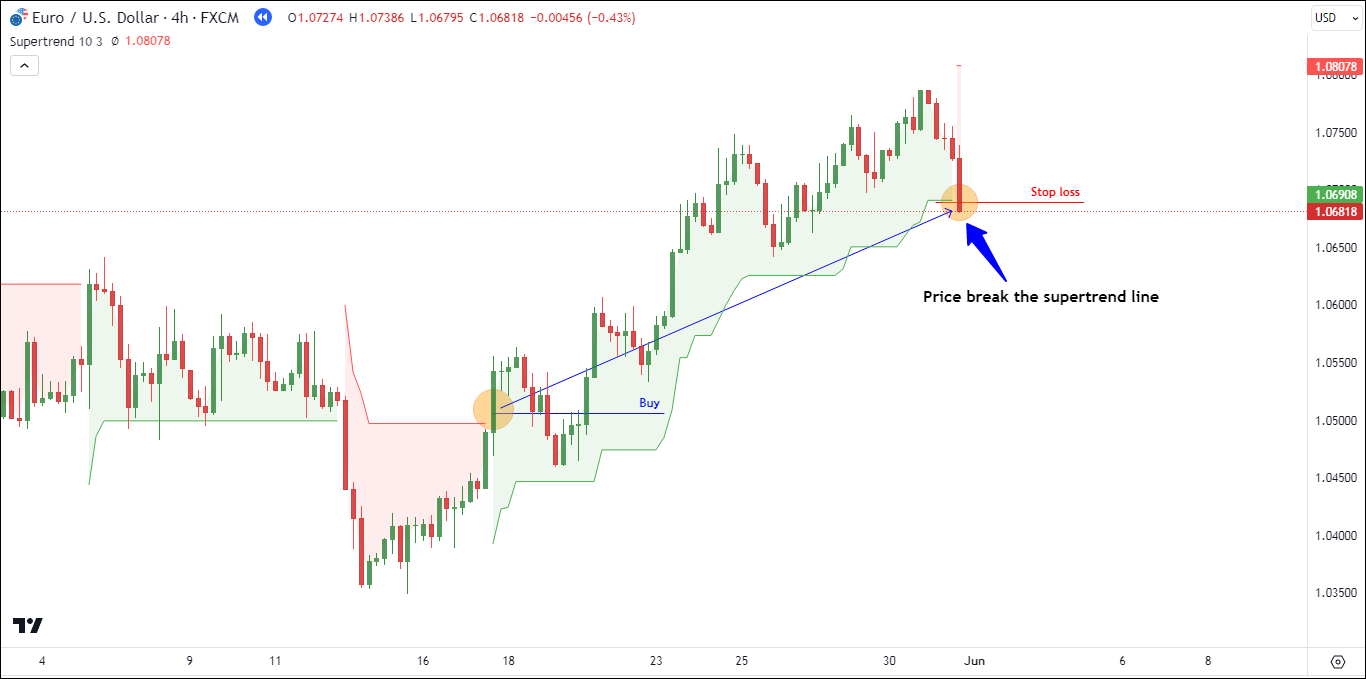
Following the initiation of the buy position, the price continued its upward trajectory. To align with the ascending Supertrend line, the stop loss was adjusted accordingly.
Ultimately, the buy position was closed due to reaching the stop loss level at approximately 1.06894. This particular buy position resulted in a profit of approximately 183.1 pips.
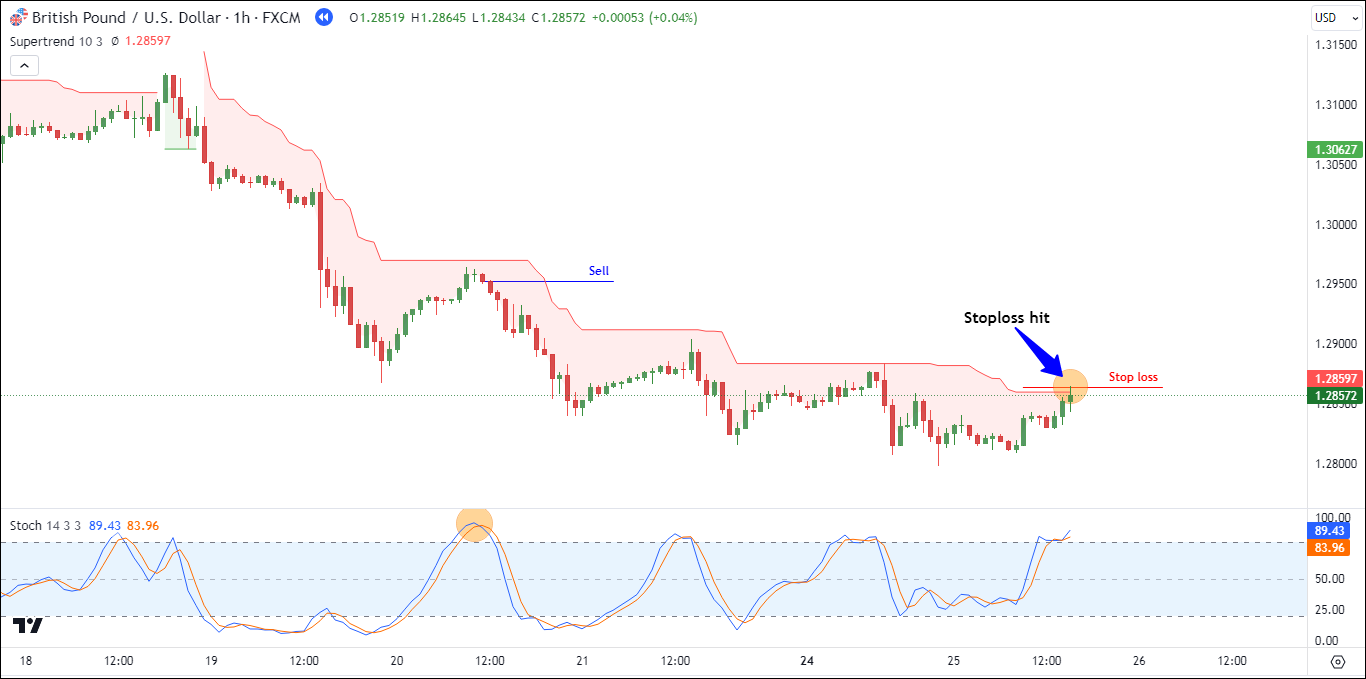
#2 GBP/USD - Sell
In the H4 chart of GBP/USD below, we can see a noticeable shift in the price trend. It went from an uptrend to a downtrend, which is indicated by the Supertrend line changing color from green to red.
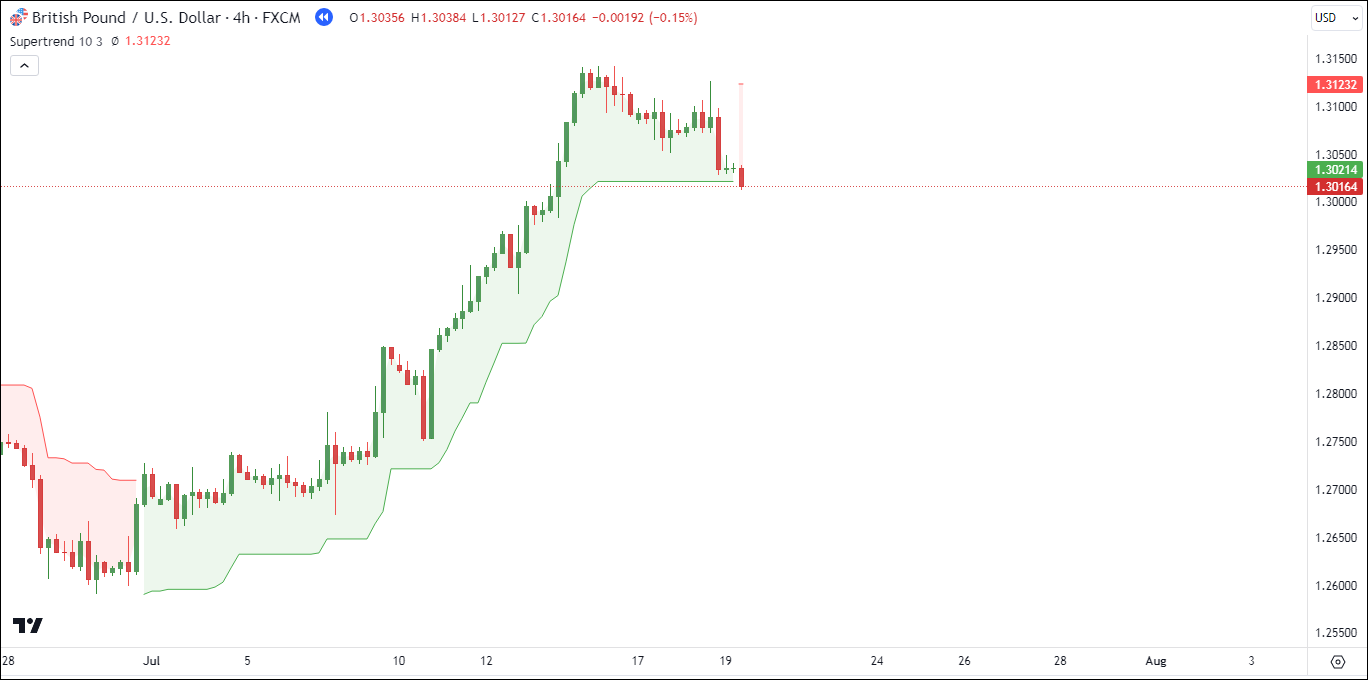
With this clear downward trend, the logical move is to take a sell position. Now, let's switch to a smaller H1 timeframe to find potential entry points using the stochastic indicator.
On the H1 timeframe, the sell signal occurs when there is a crossover of Stochastic lines above the 80 level. This happened as the price crossed the 80 level, prompting us to enter the sell position at 1.29522.
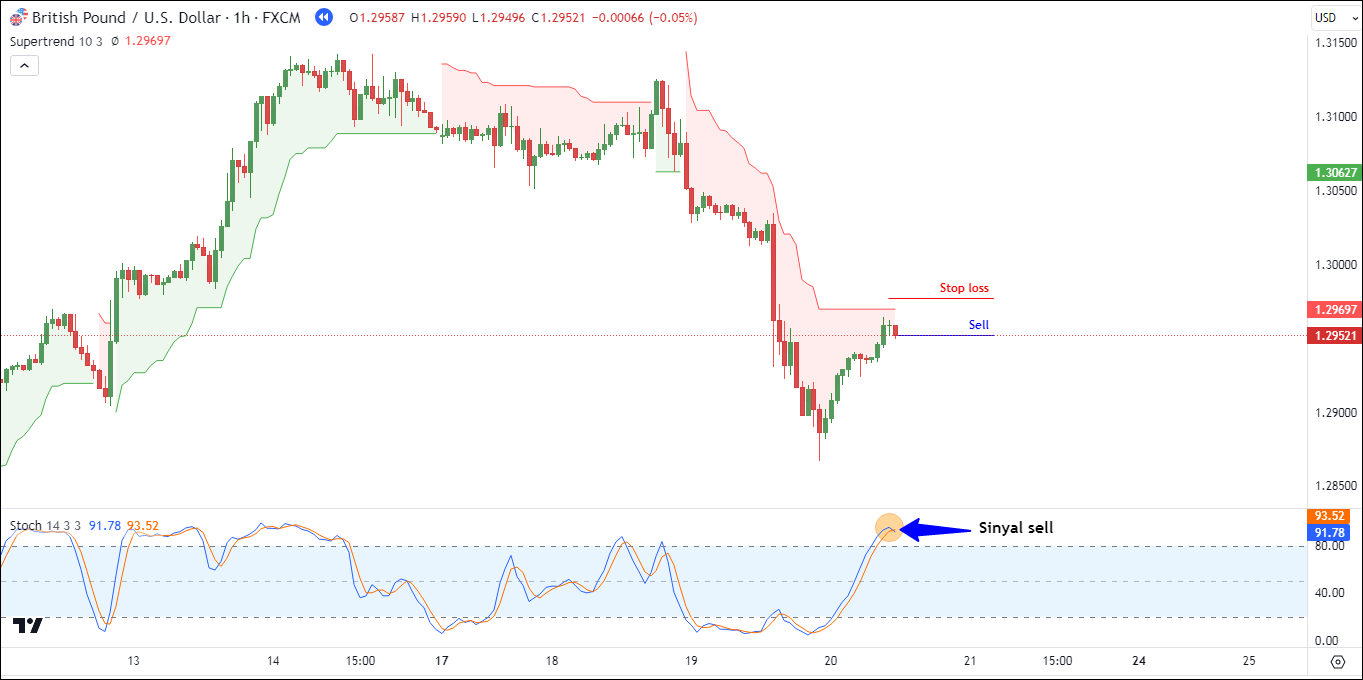
We placed a stop loss above the Supertrend line at 1.29772 (25.0 pips). We consistently adjusted this stop loss downward as the Supertrend line declined. After entering the sell position, the price continued to drop and formed a new lower low.
Unfortunately, we had to close the sell position at 1.28640 because it hit the stop loss. However, this sell position had resulted in a gain of 88.2 pips.
Pros and Cons of Supertrend Indicator
| ✔️Pros | ❌Cons |
|
|
Backtesting The Supertrend Indicator
To demonstrate how effective the Supertrend indicator is, we conducted a backtest. This testing phase lasted for a duration of six months. We split this period into two sets of three months each, one from February to April 2023, and the other from June to August 2023.
For our evaluation, we use the EUR/USD currency pair on an H1 timeframe. To decide when to enter trades, we relied on the Supertrend to identify buy and sell signals.
Meanwhile, for exit positions, we used a risk-reward ratio of 1:2. We allowed the price to either trigger the stop-loss or take-profit levels. Here are the outcomes of our backtesting.
Details | Value |
Total Trade | 80 |
Profit | 35 |
Loss | 45 |
Winrate | 44% |
Average Profit | 2R |
Average Loss | 1R |
Maximum consecutive losses | 5 |
Maximum consecutive profits | 4 |
Average Trade per month | 13 |
Average profit per month | 4.1% |
Expectancy Value | 0.3125 |
Total Profit in 6 months | 25R |
From the results of the testing above, there are four important points to discuss:
Win Rate Below 50%
Out of a total of 80 trades, we had 45 losses and 35 profits, giving us a win rate of around 44%. In simpler terms, we had more trades that didn't go our way. So, relying solely on the Supertrend indicator to decide when to buy and sell may not always lead to success. If the idea of having more losses than wins makes you uncomfortable, this approach might not be the right fit for you.
5 Maximum Consecutive Losses
During our testing, we experienced a maximum of 5 consecutive losses in a row. That's one more than our longest winning streak, which was 4 trades. This means that not only did we have more losing trades overall, but we also had periods where we faced longer sequences of losses compared to winning streaks.
If we were to expand our trading to a larger set, say 1000 trades, we could encounter as many as 7 consecutive losses. This tendency for extended losing streaks is often linked to market conditions when the market is moving sideways or lacks a clear trend.
Positive Expectancy Value
Despite our win rate being less than 50% and going through those longer losing streaks, our overall strategy still came out profitable. This is because we had a smart risk-reward ratio of 1:2. To put it simply, one successful trade could make up for the losses from two previous trades.
Over 6 months, following this approach resulted in a total profit that was 25 times what we initially risked, often expressed as 25R. It demonstrates that managing our risks wisely can be a successful strategy, even when we don't win more often than we lose.
Average Trade Per Month Is 13 Trades
With an average of 13 trades per month, it's essential to understand that this means we won't be entering trades every day, especially when using the H1 (1-hour) time frame. In fact, on average, we'll be making about 3 to 4 trades per week.
If the idea of not entering trades every day makes you uncomfortable, you could opt for a shorter time frame like 15 minutes, which would provide more trading opportunities. But, it might come at the cost of reduced accuracy.
If you're seeking a middle ground, you could consider using a multi-timeframe analysis approach, as mentioned earlier. This would allow for more frequent trade entries while still benefiting from the insights provided by higher time frames.
FAQ on Supertrend Indicator
- How Effective is Supertrend Indicator?
The Supertrend indicator can be used for daily, hourly, or weekly charts, making it useful for any trader. It works well in trending markets but tends to give false signals in volatile markets. Therefore, traders use this indicator along with other indicators like MACD, Stochastic, RSI, Parabolic SAR, etc. - How to Avoid False Signals in Supertrend Indicator?
To avoid false signals, it's really important to focus on situations where the market is clearly trending. When the market is in a strong trend, you don't get many false signals, which means your trading decisions are more likely to be right. But things change when the trend starts to weaken, especially during uncertain times. That's when you start seeing more false signals, and your accuracy goes down. That's why it's a good idea to always check how strong the current trend is before using the Supertrend indicator. - What is the Best Setting for Supertrend Indicator?
If you are new to using Supertrend, it's best to leave the default settings of ATR at 10 and the multiplier at 3. Many traders consider these as the best settings as they perform admirably on different timeframes, such as intraday and multiday trading. - What is the Best Timeframe for Supertrend?
There is no universally "best" timeframe for the Supertrend indicator. It depends on your trading or investing style and your comfort level with the timeframe's associated risks and opportunities. However, the lowest timeframe you should use is the 15-minute chart.
Conclusion
The Supertrend indicator is a helpful guide for traders in the complicated world of trading. It shows them which way the market is going and when it's a good time to buy or sell. What's cool about it is that it considers how wild the market is, which makes it better at predicting trends.
But, there are some things to remember. This tool isn't great when the market isn't sure where it's going. Also, figuring out the best way to use it can be a bit tricky.
So, here's the big takeaway: The Supertrend is awesome, but it's not the only thing you need for successful trading. Traders usually use it along with other tools and tricks to make sure they make the right moves. Before putting the Supertrend into action, it's advisable to conduct backtesting to evaluate its performance in a demo account.


10 Comments
Fredo
Sep 25 2023
After reading this article, I decided to give it a try on my small account. At first, I made some profits, but after a few attempts, I started to experience consecutive losses.
There were several occasions when I set my Take Profit (TP) and Stop Loss (SL) at a 1:2 risk-reward ratio. The price reached a 1:1 ratio, but unfortunately, it quickly reversed, eventually hitting my stop loss.
Dealing with situations like this can be quite frustrating because the profits I initially gained slipped away. Do you have any tips on how to improve the accuracy of this indicator?
David Tristan
Sep 25 2023
Improving the accuracy of the Supertrend indicator and managing trades effectively can be challenging, but here are some tips to help you use the indicator more successfully and avoid situations where your trades reverse before hitting your target:
Julian
Sep 25 2023
At first, I was really excited to try out this strategy. But when I checked the test results, I found out that the overall profit was less than 50%, more like around 44%.
So, I'm thinking about trying out this strategy in a different way, maybe with gold as my chosen asset. But since I'm new to all of this, I have some questions about how to do a proper backtest.
Could you give me some advice on the best way to do a backtest? I want to make sure I do it right, especially because I'm just starting out in this field. Your tips would be really helpful as I try to understand how well this indicator works.
David Tristan
Sep 25 2023
Certainly, conducting a proper backtest is crucial to understanding how a trading strategy or indicator like the Supertrend performs under historical market conditions. Here's a step-by-step guide on how to do a backtest effectively:
Clearly outline the trading strategy you want to test. This should include the rules for entering and exiting trades, as well as any risk management parameters (e.g., position size, stop loss, take profit).
Obtain historical price data for the asset you want to backtest. You can often find this data from financial data providers or use the historical data available on trading platforms.
Select the timeframe you want to test. Common timeframes include daily, hourly, or even minute-by-minute data, depending on your trading strategy.
You can use spreadsheet software like Excel or specialized trading software for backtesting, such as MetaTrader's Strategy Tester. Trading platforms like TradingView may also have built-in backtesting capabilities.
Input the specific parameters of your trading strategy into your chosen software. This includes entry and exit conditions, stop loss, take profit, and any other relevant rules.
Start the backtest with your defined parameters and historical data. Ensure that the backtest includes commissions and spreads if you're trading assets with associated costs.
After the backtest is complete, carefully analyze the results. Pay attention to the following key metrics:
- Total number of trades.
- Win rate (percentage of winning trades).
- Average profit per trade.
- Average loss per trade.
- Maximum drawdown (the largest peak-to-trough decline in your account balance).
- Risk-reward ratio (average profit divided by average loss).
- Total profit or loss over the testing period.
Based on the results, you may need to refine your trading strategy. This could involve adjusting entry and exit conditions, stop loss and taking profit levels, or other parameters to improve performance.
Repeat the backtesting process with the refined strategy to see if it performs better. Keep iterating and refining until you are satisfied with the results.
Once you are confident in the performance of your strategy through backtesting, consider conducting forward testing or paper trading. This involves trading the strategy with small or simulated positions in real time to further validate its effectiveness.
Use the insights gained from your backtesting to continually learn and adapt your trading strategy. Remember that markets evolve, so it's essential to stay flexible and open to adjustments.
Maintain detailed records of your backtesting results, including all trades, dates, and outcomes. This record-keeping will help you track your progress and make informed decisions.
Cindy
Sep 25 2023
The article above is genuinely impressive. It's crystal clear, and the explanations are spot on. One key takeaway here is that this indicator shines and is more profitable when applied in situations where prices are trending. I enjoy reading it.
Now, I'm pondering whether there's an indicator that's specifically designed to measure the strength of the current trend. The effectiveness of this particular indicator is closely linked to how robust the trend is - it works like a charm in strong trends but might not be as accurate in weaker ones. Thankss
David Tristan
Sep 26 2023
I'm glad to hear that you found the information on the Supertrend indicator helpful! It's true that the Supertrend indicator is primarily used to identify trends and their potential reversal points. However, when it comes to measuring the strength of a current trend, traders often turn to a different class of indicators called "momentum indicators."
Momentum indicators are specifically designed to gauge the strength and speed of price movements in a particular direction. They can help traders identify whether a trend is strong or weakening. Some commonly used momentum indicators include:
By incorporating these momentum indicators alongside the Supertrend indicator, traders can gain a more comprehensive view of the current market conditions. For example, if the Supertrend indicates a strong uptrend, but the RSI is in the overbought territory, it may signal caution as the trend could be overextended. Similarly, if the ADX shows a high value alongside a Supertrend in a particular direction, it suggests a robust and sustained trend.
Pacman
Sep 25 2023
After reading that article, I decided to give it a shot with my actual trading account. At first, I managed to make a few profits, but then things took a turn for the worse. I ended up losing quite a bit, in fact, I had a losing streak that lasted for four consecutive trades.
During that losing streak, my emotions went haywire, and my trading psychology got all messed up.
I found myself trading too frequently, forcing myself into trades, and sometimes holding onto positions even when it was clear that the price was going the other way because I kept thinking it would turn around.
How can I tackle these psychological challenges? This has been happening quite often, especially since I've been testing out this supertrend indicator. Thanks for your help.
David Tristan
Sep 25 2023
Dealing with psychological challenges in trading is a common struggle, and it's essential to address these issues to become a more disciplined and successful trader. Here are some strategies to tackle the psychological challenges you've been facing:
A well-defined trading plan can help you maintain discipline. It should outline your entry and exit criteria, risk management rules, position sizing, and overall trading strategy. Stick to your plan, and avoid deviating from it during emotional moments.
Understand that losses are a part of trading, and no strategy or indicator guarantees a 100% success rate. Set realistic expectations for your trading performance, and don't expect every trade to be a winner.
Implement strict risk management practices, such as setting stop-loss orders to limit your potential losses on each trade. Determine the maximum amount of capital you are willing to risk on a single trade and stick to it.
Only trade with money you can afford to lose. This reduces the emotional stress associated with trading because you're not risking money you cannot afford to lose.
Maintain a detailed trading journal where you record all your trades, including entry and exit points, reasons for the trade, emotions felt, and outcomes. This journal can help you identify patterns in your behavior and improve your decision-making.
Patience is a crucial trait for traders. Wait for clear signals and avoid forcing trades. If there's no good setup, it's perfectly fine to sit on the sidelines and wait for a better opportunity.
Before entering a trade, create a checklist of criteria that must be met. This helps ensure you only take high-quality setups and prevents impulsive trading decisions.
Establish specific trading hours and stick to them. Overtrading often occurs when traders are in front of their screens for extended periods. Limiting your trading time can help prevent impulsive decisions.
If you're experiencing a losing streak or heightened emotional stress, take a break from trading. Stepping away from the markets can clear your mind and prevent further emotional trading.
- Losses are a part of trading. Instead of viewing them as failures, consider them as opportunities to learn and improve. Focus on long-term success rather than individual trade outcomes.
- Consider discussing your trading challenges with a trading mentor, or therapist, or joining a trading community. Sharing your experiences and learning from others can provide valuable emotional support and guidance.
- Visualization techniques can help you prepare mentally for both winning and losing trades. By mentally rehearsing different scenarios, you can become more emotionally resilient.
Hannah
Sep 25 2023
As explained earlier, it's been noted that this indicator works best when the market is trending. However, when the market is moving sideways, it can lead to frequent stop-loss triggers.
So, my question is, should we stay patient and wait for a trend to develop when the price isn't behaving as expected, or is it acceptable to explore other forex pairs?
You see, because when I observe the price behaving this way twice a day for a couple of days, I can't help but feel the urge to make trades. So, what's the best approach for someone like me in this situation?
David Tristan
Sep 25 2023
When you encounter a sideways or ranging market condition, it's important to adapt your trading approach to the current environment rather than forcing trades. Here are some strategies to consider:
Regardless of the market conditions, maintain strict risk management practices. Always set stop-loss orders to limit your potential losses, and ensure that your position size is appropriate for your risk tolerance.
Be aware of economic events, news releases, and geopolitical developments that can impact the markets. These events can sometimes trigger breakouts from ranging markets, so stay informed about the fundamental factors affecting your chosen assets.