Dedicated FREE FOREX VPS
 Free FOREX Virtual Private Server
 MT4 Demo Contest, Get $500
 Sign Up for an Account, Claim 60% Deposit Bonus
 Free MT4/MT5 VPS 2024
 Send E-mail and Get Free Merchandise
 $1K Refer a Friend Bonus for Pepperstone Pro clients
 Maximize Your Earnings with 100% Deposit bonus
 Trade to Win, $5,000 Monthly Demo Contest
 Claim 30% + 15% Deposit Bonus from LiteFinance
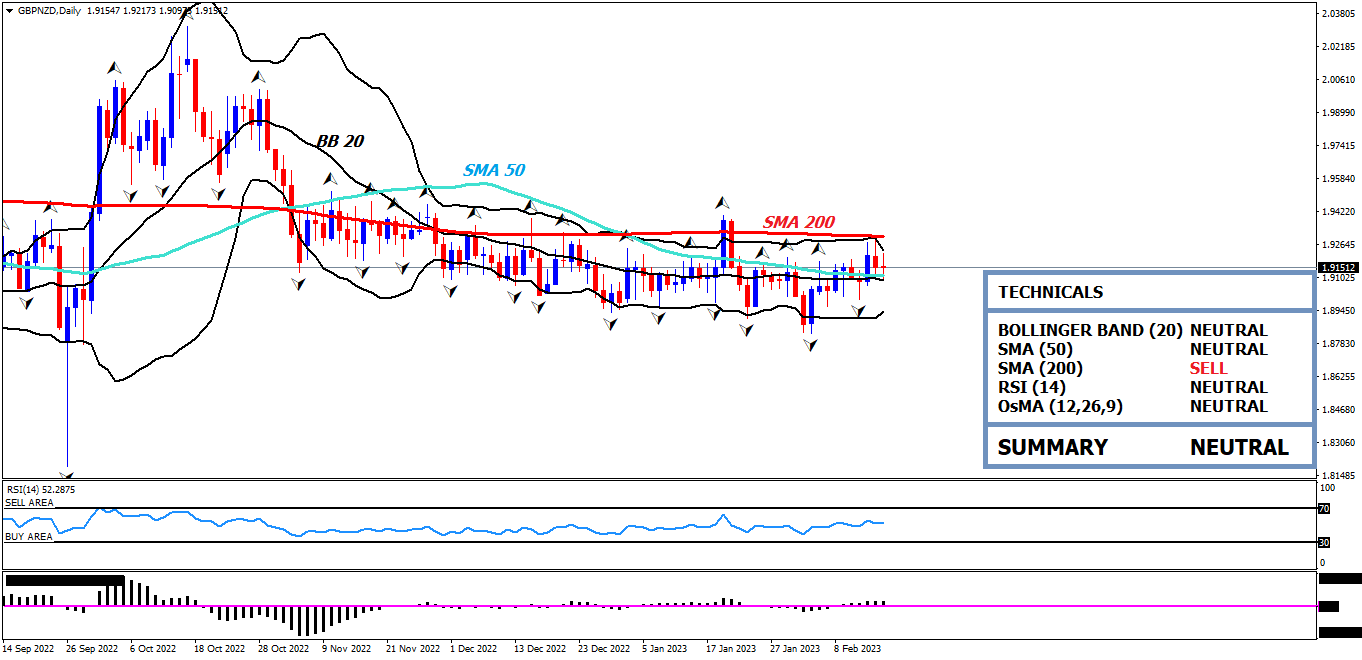
GBP/NZD remains on a neutral track. Therefore, anticipate trading opportunities when prices move around the supply or demand zones.
Hi fellow traders! GBP/NZD still hasn't created a definite trend yet. This pair traded erratically in the last three months, shown by a flat movement on the Daily timeframe. The flat movement gave rise to many supply and demand zones in the H1 timeframe. Thus, look forward to trading opportunities when prices move close to the supply or demand zones.
Analysis and Recommendation
Let's take a look at the following GBP/NZD H1 chart below:
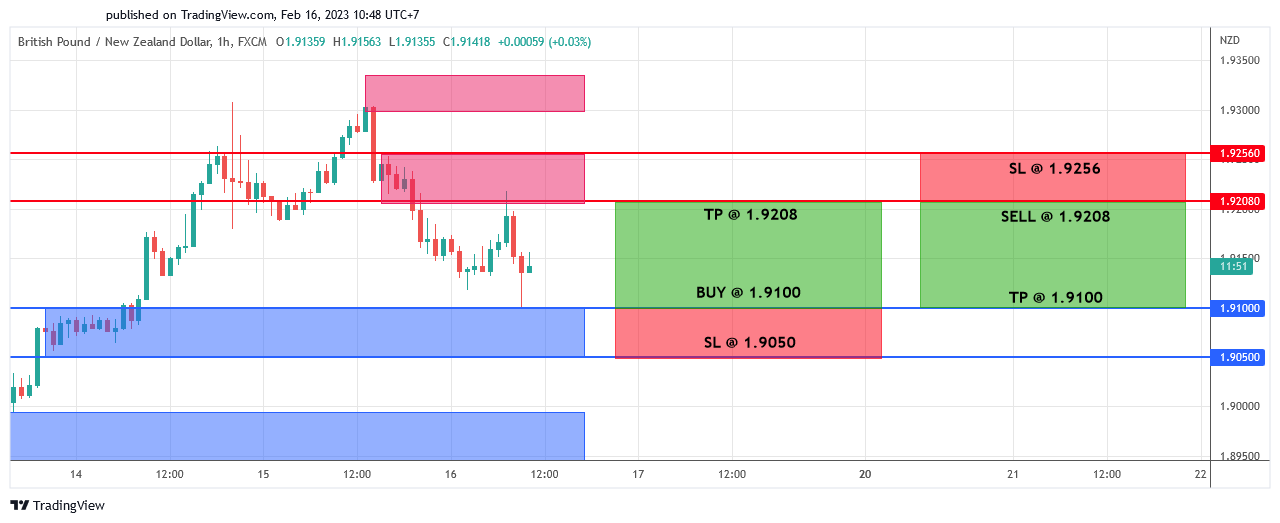
From the H1 chart above, it has been pointed out that GBP/NZD is moving between the supply zone of 1.9208 – 1.9256 and the demand zone of 1.9100 – 1.9050. When this analysis was written, GBP/NZD was moving down, testing the demand zone. Due to the absence of apparent bias, two trading scenarios can be tried this time. The main scenario is looking forward to buy opportunities when the price approaches the demand zone.
As an alternative scenario, the price also has the potential to rise to test the supply zone around 1.9208 – 1.9256. Thus, sell opportunities can also be taken when there is rejection around the supply zone.
Here are two trading scenarios that can be prepared:
- Therefore, set a long position at 1.9100 when the price manages to enter the demand zone and a bullish signal confirms it. Stop loss may be positioned at 1.9050, while the profit target is at 1.9208.
- Alternatively, set a short position at 1.9208 when a significant bearish signal confirms it in the supply zone. Stop loss may be positioned at 1.9256, while the profit target on 1.9100.
Keep in mind to always use risk and money management before trading! In addition, to make use of trailing stops, don't forget to exit the market as soon as you find a reversal signal!
GBP/NZD key levels:
Resistance: 1.9256, 1.9208
Support: 1.9100 (psychological level), 1.9050