 Dedicated FREE FOREX VPS
 Free FOREX Virtual Private Server
 MT4 Demo Contest, Get $500
 Sign Up for an Account, Claim 60% Deposit Bonus
 Free MT4/MT5 VPS 2024
 Send E-mail and Get Free Merchandise
 $1K Refer a Friend Bonus for Pepperstone Pro clients
 Maximize Your Earnings with 100% Deposit bonus
 Trade to Win, $5,000 Monthly Demo Contest
 Claim 30% + 15% Deposit Bonus from LiteFinance
Forex technical analysis has certain characteristics and benefits that make it as important as other types of analysis in forex trading. If you are a beginner, here is the complete guide of technical analysis.
Technical analysis is a way to analyze the market fluctuations of investment prices using statistical tools such as graphs and mathematical formulas. The aim is for letting the trader get a description of the market condition at the moment based on the price history in the past. It is also for giving a picture or prediction about market fluctuation in the future.
Previously, a trader did the calculation by combining the graphs and mathematics formula manually, but nowadays the technical analysis can be done much easier. In general, the trading online platform has been completed with the feature for showing the price fluctuation in various graphs, as well as reliable technical indicators for analyzing tool assistance.
Let's explore each aspect to better comprehend technical analysis in trading.
Contents
- The Technical Analysis Basic Principle
- Technical Analysis Components
- The Differences Between Technical Analysis and Fundamental Analysis
- The Comparison Between Technical and Fundamental Analysis
- What is a Technical Indicator?
- 3 Tips on Deciding the Best Technical Indicators
- Building Your Own Trading System
The Technical Analysis Basic Principle
Technical analysis is one of the two types of Forex analysis which is used generally by the trader. The other analysis is a fundamental analysis that analyzes a value of a certain currency based on the economic condition of the native country, the financial market situation, or the news and rumors that have been spread. Different from fundamental analysis, technical analysis is based on these three principles:
- Market Price Discounts Everything
The price shown on the graph or chart has described the factors that influence the market. - Price Moves in Trend
The price doesn't fluctuate randomly. It always forms a certain pattern or trend which will continue changing until the signs stop the pattern coming. That's the time when the existing trend is replaced by the new one. - History Repeats Itself
There is a strong tendency that the market trader behavior today to have the same reaction as the market trader in the past. They have the same idea to overcome the various information which influences the market, so the fluctuation motive that has ever happened will happen over and over again.
Technical Analysis Components
Technical analysis consists of some important components. These components must be known by all Forex traders.
1. Price Chart
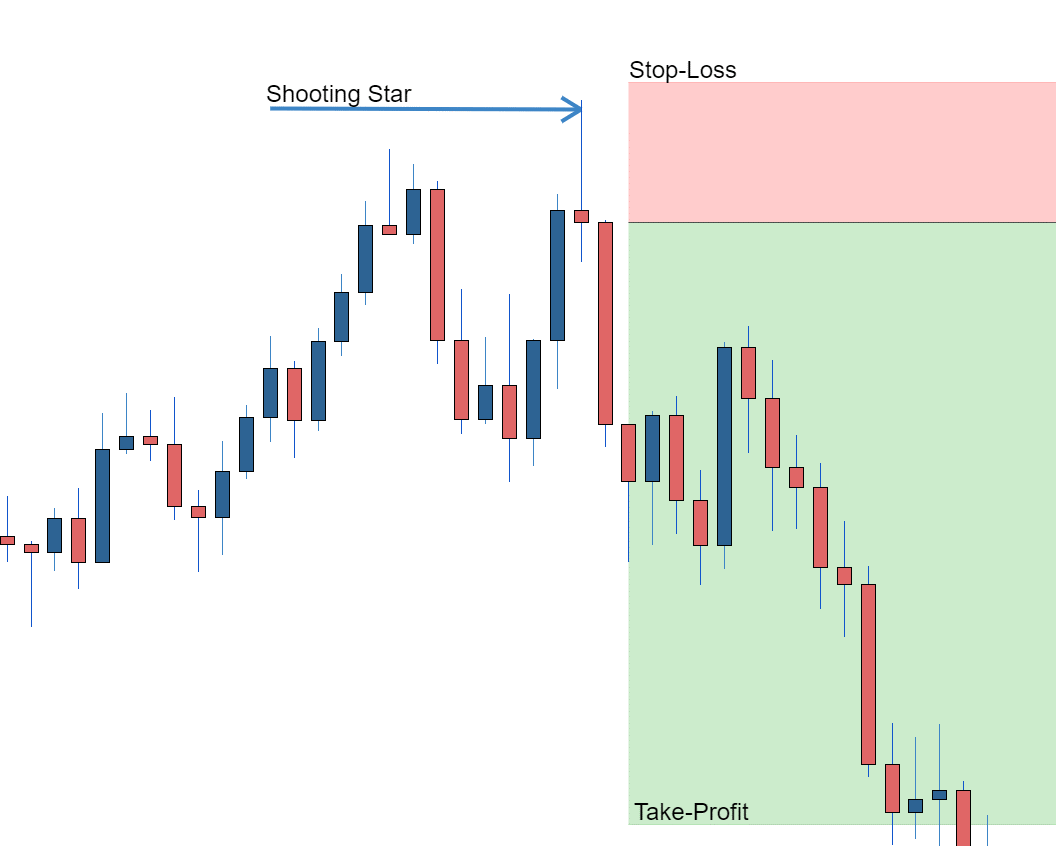
The price chart shows the value of two currencies' conversion which keeps fluctuating from time to time. There are three models of price charts that are generally used in technical analysis, they are the Line Chart, Bar Chart, and Candlestick Chart. Among the three, the most popular one is a candlestick chart as seen below.
2. Technical Indicators
In order to show the price fluctuation which is shown by the charts, we need technical indicators. There are many kinds of technical indicators. However, they all have the same objective to help traders get some perspectives on the price fluctuation at the moment. Therefore, they can get a picture or prediction about the price fluctuation in the future.
Due to the various types of technical indicators in the world, even in hundreds, it makes every trader can use different indicators. However, there are some indicators that are generally used such as Moving Average (MA) and Relative Strength Index (RSI). The example is on the chart below, the chart of GBP/USD that uses the technical indicator of MA and RSI.
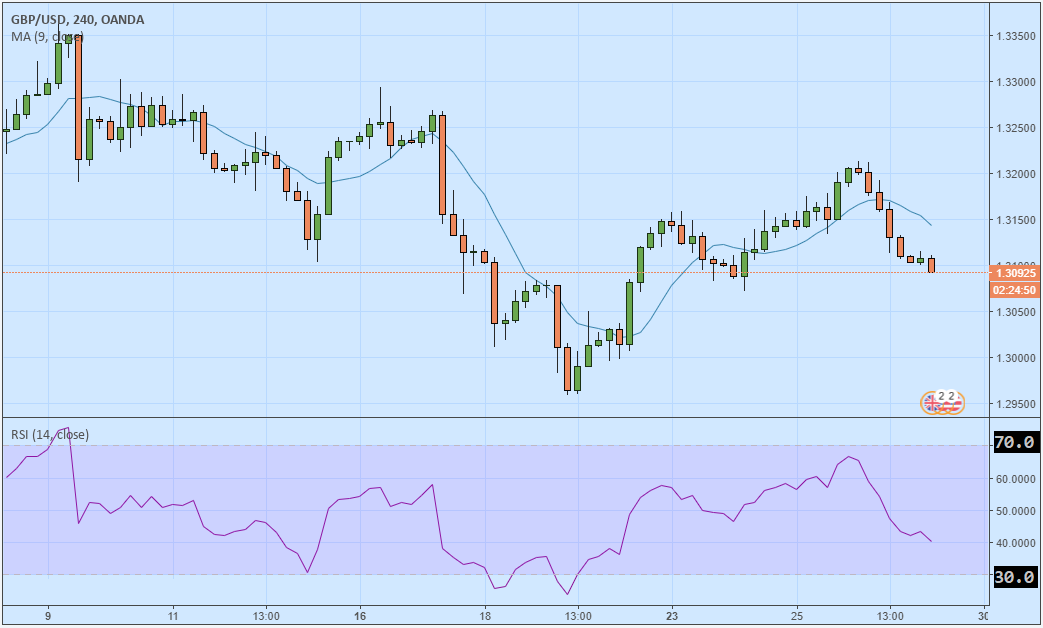
From the technical indicator condition above, we can understand that the price for GBP/USD is experiencing bearish or the price trend is declining. It means the trader has an opportunity to 'sell'. It is because the price movement is under the MA line. Meanwhile, the RSI declines, too, but not yet reaching 30.0. Next time, if the RSI reaches 30.0, it means the opportunity for traders to 'buy'.
3. Technical Analysis Methods or Techniques
The combination of MA and RSI is for determining the trades. It becomes a part of analysis techniques or methods, based on one indicator, various indicators, or combining several special techniques such as Fibonacci, Retracement and Reversal, Elliott Wave, and others.
The Differences Between Technical Analysis and Fundamental Analysis
As the foundations of Forex analysis, technical and fundamental methods have different characteristics as follows:
Technical analysis
- It needs a lot of data to support prediction accuracy.
- Its advantages depend on the trader's skill in reading graphs, applying indicators, and practicing the analysis technique.
- It can be applied to short and long-term trading.
Fundamental analysis
- It needs some time to get information from updated economic data or rumors. An individual trader will find it difficult to get those kinds of information.
- It is subjective because it involves many people's opinions. One trader might consider the economic data is good, but the others might think it's not good.
- It is good to be applied in middle and long-term teaching.
After knowing the characteristics, it is better for beginners to know the comparison of these two techniques in real life.
The Comparison Between Technical and Fundamental Analysis
In analyzing price fluctuation, Forex traders usually apply technical and fundamental analysis. To get a better knowledge of these two techniques, let's check the comparison and benefits as follows.
Technical Analysis
- Technical analysis is a method of analyzing historical price movements to predict future price movements.
- Technical analysts believe that market prices reflect all available information and that past price movements can be used to identify patterns that can predict future price movements.
- Technical analysis is a popular method of analysis among forex traders, and there are many different technical indicators that
- can be used to analyze price movements.
- Some of the most popular technical indicators include moving averages, trend lines, and support and resistance levels.
Fundamental Analysis
- Fundamental analysis is a method of analyzing economic data and events to predict future price movements.
- Fundamental analysts believe that market prices are determined by supply and demand and that economic data and events can affect supply and demand.
- Fundamental analysis is a less popular method of analysis among forex traders than technical analysis, but it can be a valuable tool for long-term traders.
- Some of the most important economic data that fundamental analysts monitor include interest rates, inflation, and economic growth.
Benefits of Combining Technical and Fundamental Analysis
- The best way to analyze forex markets is to combine technical and fundamental analysis.
- Technical analysis can help traders identify entry and exit points, while fundamental analysis can help traders identify the overall trend of the market.
- By combining technical and fundamental analysis, traders can increase their chances of making profitable trades.
What is a Technical Indicator?
A technical indicator is a tool made based on the mathematical calculation of price, volume, or market passion toward an investment instrument or financial contract. By applying the technical indicator to the price history data, traders can use them to map today's market condition. They also can use the indicators for predicting the next fluctuation in technical analysis. The indicator examples are Stochastics, Relative Strength Index (RSI), Bollinger Bands, and so forth.
Forex analysis uses the technical indicator which focuses on the price history data, by ignoring the fundamental factors which influence the price. The technical indicators are usually used by the daily trader for trading stocks, Forex, and commodities. It is because the indicators are designed to analyze the short-term price fluctuation. Nevertheless, the middle and long-term trader who focuses on the fundamental analysis can also use the technical indicators to identify the best trading opportunities.
The Technical Indicators Types
Actually, there are tens of technical indicators all over the world. Every mathematician, statistic expert and other experts who understand the financial market can create their own indicators. So, if the technical indicator shows pretty high accuracy and is favored by other traders, it will be used widely by other traders in the world. However, generally, viewed from the layout, the technical indicators can be divided into two types: Overlay and Oscillator.
Overlay
The Overlay technical indicator is usually in the form of charts or graphs which are applied by putting them over the price chart. The most popular indicators are:
- Moving Averages (MA)
- Parabolic SAR
- Bollinger Bands (BB)
- Ichimoku Kinko Hyo
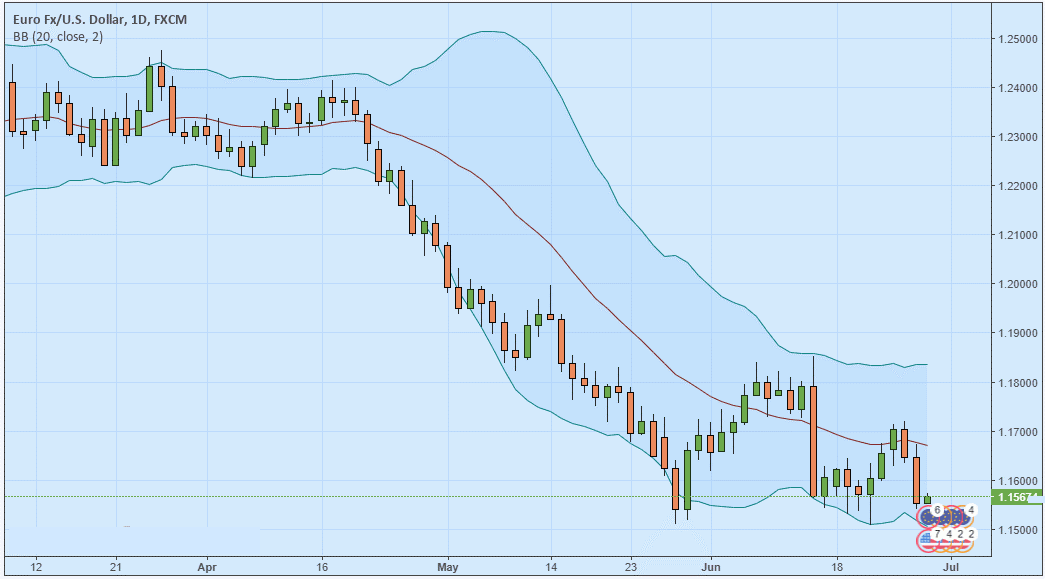
The Overlay indicator can be seen on the EUR/USD chart with Bollinger Bands below. The candlestick chart represents the price fluctuation, while the line chart represents the Bollinger Bands layout.
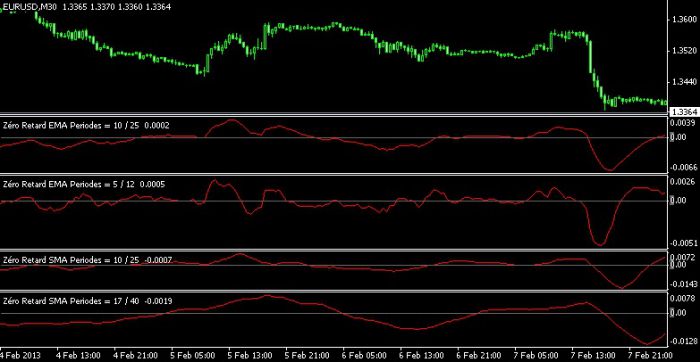
Oscillator
The Oscillator technical indicator usually shows certain minimum and maximum values which appear under the price chart. Besides, compared to the Overlay indicator which calculates more on the price data, the indicators in the Oscillator type also calculate the trading volume fluctuations on an instrument. The most popular indicators are:
- Relative Strength Index (RS))
- Moving Average Convergence Divergence (MACD)
- Money Flow Index
- Stochastic Oscillator
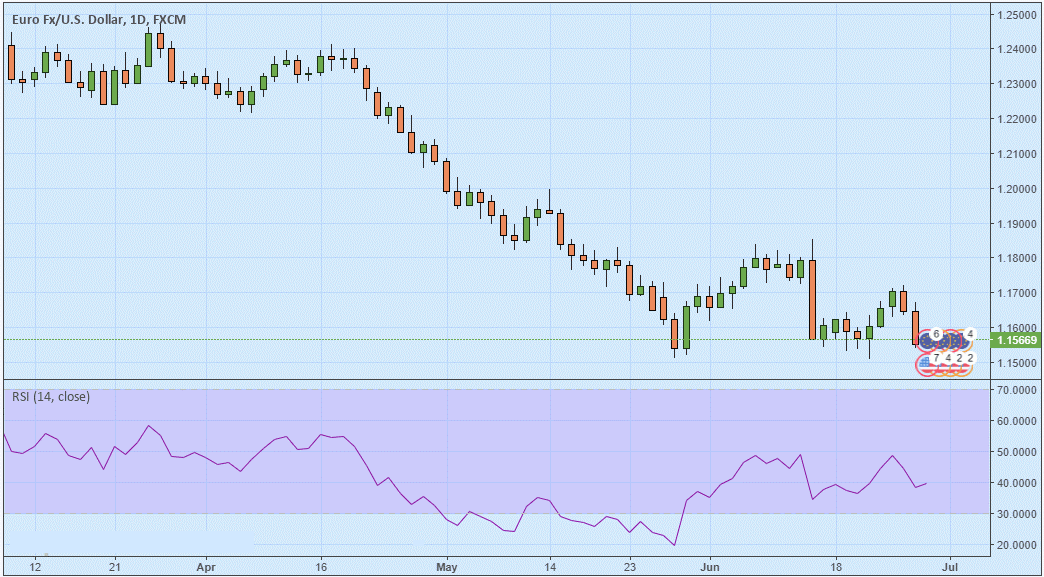
The example of the Oscillator indicator on RSI can be seen below under the chart of EUR/USD.
3 Tips on Deciding the Best Technical Indicators
A Forex beginning trader usually learns each indicator one by one, then decides which one is the most convenient and beneficial for daily usage. However, a trader often uses more than one technical indicator for analyzing the price fluctuations on an instrument. The important thing is to pay attention to the following three tips in deciding the technical indicators.
1. Adjust the Parameter Setting of the Technical Indicator
If we set the technical indicator which is built-in on the trading platform, such as MetaTrader, it must have the default setting. However, a trader still can change the parameter in the setting.
For instance, the use of Moving Average which is applied by a trader based on the Close price, High price, or others. The Moving Average itself is calculated based on the price average, so the period can also be adjusted freely, for example, MA-50 Day (the average is the last 50), MA-100, MA-200, and others.
2. Combining the Technical Indicators Based on Each Function
The combination of the two technical indicators or more for analyzing the prices of an instrument must be based on each indicator function. However, make sure not to attach too many indicators on the chart until it's hard to read clearly.
3. Never Try on a Real Account
The last tip is not to use a real account if you still learn and try some indicators. Use a demo account which enables us to practice in the real market condition without any risks. In the demo account, you will only use virtual funds provided by the broker. Therefore, you are free to try out as many indicators as you want, with whatever setting or combination that you are curious to explore.
Building Your Own Trading System
For building a good trading system, we need some patience. But if it's built well, it will run very well, too. Building a trading system actually, it's not really hard and long. The longer process is trial and error to find better treatment until finding the best and most suitable trading system for you. Building a good trading system needs around a month or two. However, if the system has been built well, your patience will be worthwhile.
There are many articles selling a system, but it's better to create your own. Here are the steps which need to be followed for developing a good system.
- Create a Time Frame
Something that you need to decide very first is what type of trading you want to have. Do you want to be a day trader or a swing trader? By knowing the trading you want, it will be easier for you to design the time frame which will be used in the reading system. - Find an Indicator to Identify a Trend
The purpose is to identify a trend as early as possible. Therefore, we must use indicators that can research the purpose. One of the suitable indicators is Moving Averages, which is commonly used for identifying a trend. - Find an Indicator to Confirm a Trend
There are many indicators that can be used today, such as RSI, MACD (Moving Average Convergence Divergence), or Stochastic. Try some indicators and choose the best one which fits your characteristics. - Determine the Risk that You're Ready to Take
In building the trading system, you need to determine how big the loss risk you can handle for every transaction. Also, you need to calculate the maximum loss risk that you may experience in one day. - Decide When You Enter and Exit a Trade
There is a trader who likes to do a transaction as early as possible, for example, a transaction when the trend signals have been confirmed. On the other hand, there is a trader who likes to wait some time for ensuring the trend manually. In other words, there is an aggressive trader and a play-safe trader. - Try to Apply the System
The last thing to do is apply. It needs discipline and patience. You will need time to adapt and master a certain trading system, especially in doing real trading. Finally, being a forex beginner indeed needs special knowledge and skills. But once you master it, you will be the expert in your own trading system and gain a lot of profit.
Apart from technical indicators, another crucial component that can't be separated from technical analysis is price action. What is it and why is it so important? Find out in Pure Price Action Strategy Explained.


3 Comments
Jesisca
Dec 7 2022
In the basic principles of technical analysis, you said that prices move along trends, that is, they always follow trends, either uptrends, downtrends, or sideways, rather than fluctuating randomly. You also said that market history repeats itself. Therefore, movement patterns, the nature of market reactions, and even market prices can repeat themselves over and over again. If that is true, why should a trader open and close to make short-term tradings? I would open a position and wait for the price to move. Example, When the price is at its highest point, I look at the historical charts and compare and I will see that today is the highest point. I will open a short position and wait for the lowest position to appear based on that chart. And close position at that point. Bravo, I will get the profit wihout stressing.
Brandon
Jan 28 2024
To establish my own trading system, the initial crucial step is to set up a time frame. The first decision to make is the type of trading I want – whether it's day trading or swing trading. Knowing the preferred trading style makes it easier to determine the appropriate time frame for the trading system.
Now, if I'm aiming to be a scalper, which time frame should I focus on? There are various options available, and I want to know the best time frame to keep an eye on for scalping.
George
Feb 1 2024
Hey there! If you're aiming to be a scalper, the recommended time frames to focus on are typically the shorter ones. Scalping involves making quick, short-term trades to capture small price movements, so traders often look at very short time frames. Common choices include one-minute and five-minute charts. These time frames provide a close-up view of price action, allowing scalpers to spot and capitalize on brief fluctuations in the market. Keep in mind that the specific time frame preference may vary among individual traders, so it's essential to experiment and find what works best for your scalping strategy.
As the additional information here, If you want the example of the short time frame that used to scalping, here is the article that I recommend to read :The Secrets of Successful Scalping Strategy