 Dedicated FREE FOREX VPS
 Free FOREX Virtual Private Server
 MT4 Demo Contest, Get $500
 Sign Up for an Account, Claim 60% Deposit Bonus
 Free MT4/MT5 VPS 2024
 Send E-mail and Get Free Merchandise
 $1K Refer a Friend Bonus for Pepperstone Pro clients
 Maximize Your Earnings with 100% Deposit bonus
 Trade to Win, $5,000 Monthly Demo Contest
 Claim 30% + 15% Deposit Bonus from LiteFinance
It's undeniable that EMA is an essential tool for almost any type of trading strategy. But, adjusting the period can be a complicated matter. In that case, what is the best EMA for day trading?

Day traders are investors who open and close all their positions in a single day. They prefer to always start afresh the next day instead of bringing trades into the next day. These traders, therefore, have to be quick on their feet in analyzing the markets. They're often seen placing many small deals in order to make a few pips in each trade which accumulates to a good amount of profit. In order to help in their journey, they use certain strategies that help predict future price movements. One of these strategies is the Exponential Moving Average, or EMA, which will be explained further today.
What Is EMA?
EMA stands for Exponential Moving Average. It is a technical indicator tool that tracks the price movement of an asset over time. It is also sometimes referred to as the Exponentially Weighted Moving Average (EWMA). It is important to note that this is slightly different than a Simple Moving Average (SMA).
A Simple Moving Average would track the movement of price over a specific range of time. An Exponential Moving Average would track the price movement of an asset the same way as well, but it would place more significance on the more recent prices instead of treating them all equally.
EMA Calculation
In most cases, it is preferred to use a chart to calculate Exponential Moving Average. That is a simpler method for this calculation as you can easily identify the EMA just by looking at the graph. There is however another way to calculate EMA and that is by the mathematical way. Unlike a Simple Moving Average (SMA), the formula for an EMA is slightly more complicated. We've simplified it to the best of our abilities so you can understand it much easily:
EMA = Price(t) × k + EMA(y) × (1−k)
where:
- t = today
- y = yesterday
- N = number of days in EMA
- K = 2 ÷ (N+1)
Through this calculation, you can mathematically check if the EMA you found on the chart is correct. If the value matches the value you found mathematically, then everything is on the right track.
Why Do Day Traders Use EMA?
Exponential Moving Average is one of the most commonly used technical indicators in the financial industry. It is most commonly used by traders in the forex and stock markets. Traders of those markets use Exponential Moving Average to help identify trends in price fluctuations. Day traders commonly use several EMA periods in creating a good setup to plot their charts. The 5, 10, 20, and 50-day Exponential Moving Averages are the most commonly used in identifying short-term trends.
Best EMA for Day Trading
The 10-day Exponential Moving Average is popular among day traders. Technical strategies like this have been used for centuries but require complete accuracy in order to have a fighting chance at earning profits from the market. It's a visual process that needs examining the relationships between moving averages and price. It also analyzes moving average slopes that reflect slight shifts in short-term movement.
Increases in movement offer buying opportunities for day traders, while decreases in movement signal for the opportunity to sell. When the moving average line tends to move sideways, it tells the day trader to step down as day trading trends are weak and opportunities are limited.
The 15-Minute Chart
A 15-minute chart is also used by day traders. It is never ideal for long-term traders to use a 15-minute chart. Therefore, the best Exponential Moving Average to use in a 15-minute chart should be relatively short. For example, it does not make any sense to use a 100-period EMA on a 15-minute chart. Instead, using a 10 day period makes much more sense on a 15-minute chart. This is also the best period for day traders as it gives them a good overall idea of the market situation.
Example of the Best EMA Strategy
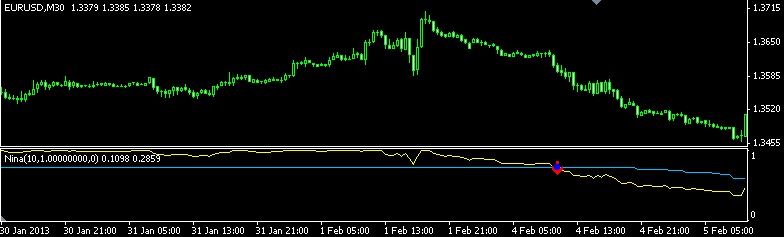
Let's build a scenario in order to further understand how an EMA strategy works. We'll use the best EMA strategy for day trading in this example. Following an hourly chart that uses a 10-day Exponential Moving Average, we observe the EUR/USD chart. Over one and a half days, we notice an upward trend. This increase in upward movement offers an opportunity for day traders to buy the currency pair on pullbacks.

If we observe this using the 15-minute chart, we may notice some slight falls in the chart but overall, the price would still be following an upward trend, therefore alluding to buy opportunities.

Risks with EMA
No matter how good a trading strategy could be, it can never completely guarantee success. The Exponential Moving Average still relies on past data that can never be applied to the future with complete confidence. Past trends that are plotted with a moving average can't guarantee the same pattern in the future, as the future can never be predicted. Therefore, it has a rocky relationship with traders who seek leading signals. With any sort of moving average like EMAs, there is always the chance of false signals.
Overview
The 10-day Exponential Moving Average over an hourly chart is the best EMA strategy for day traders. It provides the perfect range for a day trader to perfectly analyze the chart in order to predict future price movements. Yet, it is important to note that EMA should never be completely relied on as nothing or no one can 100% guarantee something to go as planned in the future. This is where good risk management comes to ensure your account's safety against unpredictable price movements.


2 Comments
Houston
Apr 21 2024
Hello, I've come across information in the article suggesting that the Exponential Moving Average (EMA) relies on historical data, which may not accurately predict future market movements. This uncertainty about future trends poses challenges for traders seeking reliable signals. Now, I'm curious about the types of trading signals commonly used. Could you explain what "leading signals" are and how they differ from other signals? Additionally, what advantages do leading signals offer compared to alternative signal types? Thank you for your insights.
Vito
Apr 25 2024
Sure thing! So, in trading, signals are like little hints telling you where the market might be headed. One type you might hear about is called "leading signals." They're like the early birds of trading—they try to predict where the market's going based on what's happening right now or some fancy technical stuff.
The cool thing about leading signals is they can sometimes spot trends before they're obvious to everyone else. It's like getting a heads-up before the big party starts. That means you might be able to jump in or bail out of trades before the rest of the crowd catches on, potentially scoring some sweet gains or dodging losses. A common example of a leading signal is the "MACD crossover." MACD stands for Moving Average Convergence Divergence, and it's a technical indicator that measures the relationship between two moving averages of an asset's price.
When the MACD line (which tracks the difference between two exponential moving averages) crosses above the signal line (a smoothed moving average of the MACD line), it's considered a bullish signal. This crossover suggests that the short-term trend is starting to move upward, potentially indicating a buying opportunity.