 Dedicated FREE FOREX VPS
 Free FOREX Virtual Private Server
 MT4 Demo Contest, Get $500
 Sign Up for an Account, Claim 60% Deposit Bonus
 Free MT4/MT5 VPS 2024
 Send E-mail and Get Free Merchandise
 $1K Refer a Friend Bonus for Pepperstone Pro clients
 Maximize Your Earnings with 100% Deposit bonus
 Trade to Win, $5,000 Monthly Demo Contest
 Claim 30% + 15% Deposit Bonus from LiteFinance
A lot of new traders think that forex trading is all about buying low and selling high. While this is true, traders need to consider other factors such as overbought and oversold.
Overbought and oversold are two terms that often appear in forex trading analysis. These two conditions are very important. Every trader should spend some time learning and understanding these conditions because they could assist in reviewing the current price conditions and then formulate some steps to deal with them.
In short, overbought and oversold are terms used in financial markets to describe extreme price conditions of an asset, in which:
- Overbought indicates a significant and rapid price increase, suggesting a potential correction or reversal.
- Oversold refers to a significant and rapid price decline, signaling a potential rebound or reversal.
But before we discuss them further, let's get acquainted with the process behind overbought and oversold in forex trading.
Contents
How Do Overbought And Oversold Happen?
Overbought is a condition where the price has peaked after increasing for some time. The process is as follows:
- A very significant uptrend movement generally precedes this situation.
- After the price increase is sufficient, traders and investors who previously opened buy orders will close positions to make a profit. This specific price point is the very definition of overbought conditions.
- As more and more market participant chooses to close their long positions and does profit-taking, the price will naturally weaken after passing its overbought levels.
- Then, as more traders and investors review their portfolios and decide to end their buy orders, the price decline will occur after the overbought level has been passed.
Meanwhile, oversold is the opposite of overbought. It can happen with the following steps:
- There's a very large push to sell from traders and investors.
- A sharp downtrend formed until the price reached bottom.
- When the price decline is considered too extreme and most market participants profit-taking by closing short positions, oversold occurs.
How to Recognize Overbought and Oversold?
Both overbought and oversold can be identified with the help of an oscillator indicator such as RSI (Relative Strength Index) and Stochastic, which has two extreme standard levels.
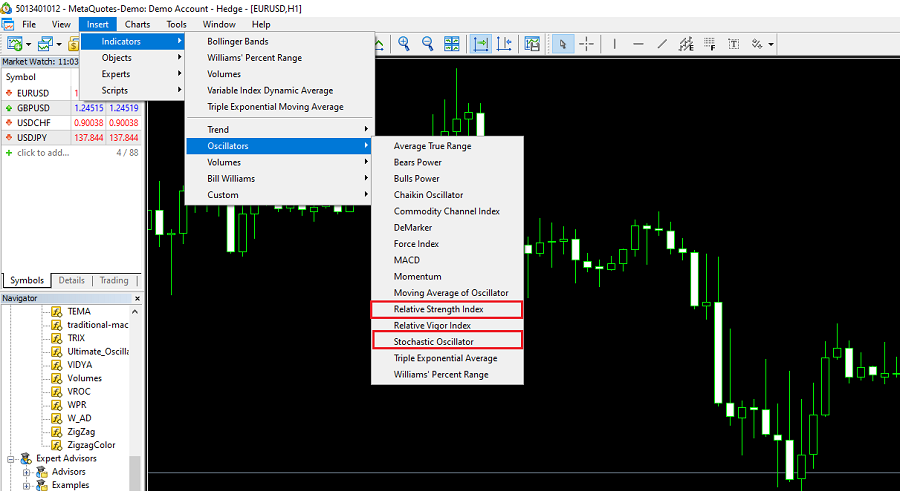
If you are trading with the MetaTrader platform, these types of indicators can be displayed in the following ways:
- Open the Insert menu -> Indicators -> Oscillators.
- Select RSI or Stochastic, then click OK.
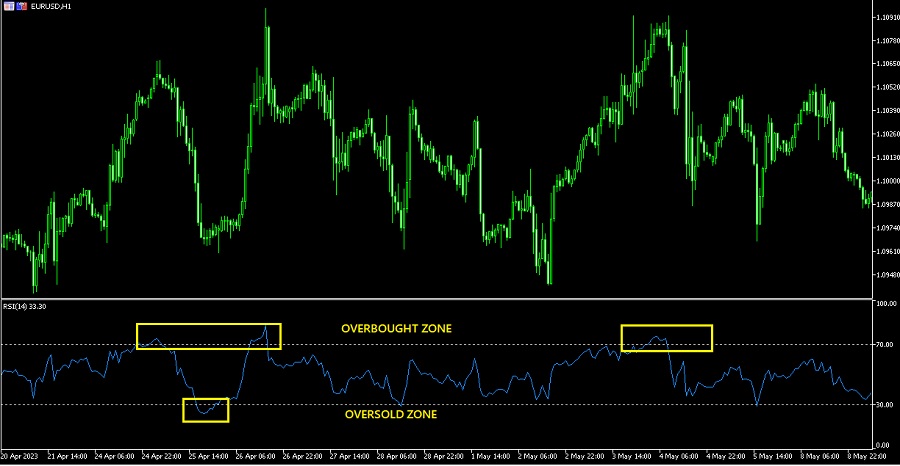
RSI and Stochastic can measure overbought and oversold but through different standard levels. When using the RSI indicator, the limit is 70 for overbought and 30 for oversold. While for Stochastic, the standards are 80 and 20.
Suppose you are using the RSI, an overbought condition is seen when the indicator chart has risen beyond the 70 level. Conversely, oversold is confirmed when the RSI chart drops past the 30 level.
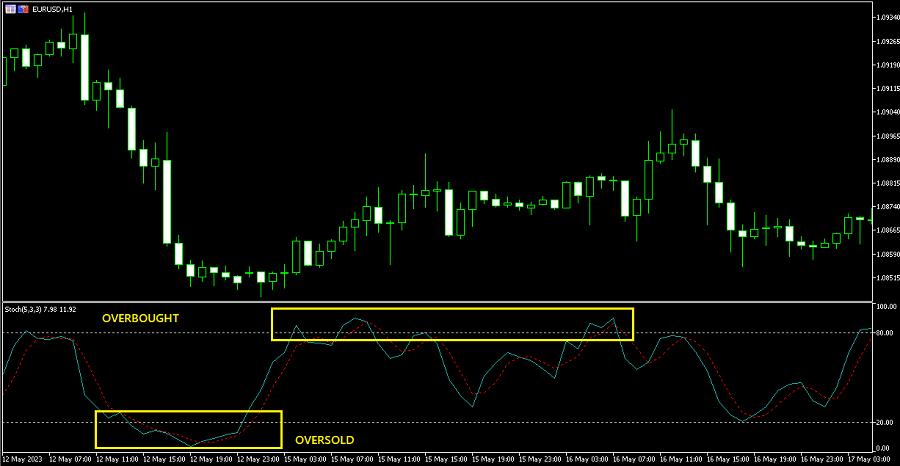
The observation on the Stochastic indicator is more or less the same, and it's just that the benchmark level is 80 for overbought and 20 for oversold.
Why Are Overbought and Oversold Important?
Because it reflects an overbought condition, overbought is an important signal indicating a potential bearish reversal. Conversely, oversold is interpreted as a marker of a bullish reversal. For this reason, traders often anticipate crossing RSI or Stochastics signals from overbought and oversold levels upon taking a position based on a trend reversal strategy.
How to Trade with Overbought and Oversold?
Say the price is currently going up rapidly but the RSI chart has crossed the 70 level, which means the price will likely reverse down soon. In this situation, the ideal step is to open short positions. Although its main function is to provide entry signals for users who apply trend reversal strategies, overbought can also be used by traders who follow trends (trend followers).
Usually, overbought is an initial signal for trend followers still holding long positions to look for the perfect exit point.
Then what about oversold cues?
Like overbought, oversold signals are an entry requirement for trend reversal strategy users. However, if overbought becomes a sell signal, oversold is used as an indication to open a buy position. If you use the RSI indicator, this signal appears when the indicator chart continues to fall past the 30 levels. At this time, even trend followers will respond by getting ready to end short positions they have held or avoid opening positions because a downtrend continuation signal does not support them.
Watch Out for These Conditions
Even though they are often relied on in forex trading with a trend reversal strategy, overbought and oversold still have risks. To anticipate this, traders who observe these two signals need to consider the following things:
- Overbought and oversold signals for trend reversal strategies work most effectively in sideways conditions. When prices are trending and influenced by very strong market sentiment after the release of big-impact news, overbought and oversold conditions can occur continuously. It may take a long time before they can reverse.
- Don't be in a rush for entries based on overbought and oversold signals. You should use confirmation from indicators or other analysis methods. For example, ensure the RSI chart has moved down from the 70 levels before placing a sell entry on an overbought signal.
- You can also refer to price action signals when overbought or oversold occurs. If the price forms a pin bar or other reversal pattern, then trading entry with a trend reversal strategy can be confirmed. The appearance of such signals will validate your position.
Trading Overbought and Oversold with CCI Indicator
The Commodity Channel Index (CCI) is included in the category of oscillators, which are often used to find momentum. Because it is an oscillator, CCI is also used as an overbought and oversold indicator, and when there is a divergence in the direction of price movement, indicating a possible change in trend direction.
The limits of the CCI level are +100 and -100.
When the CCI indicator curve is above +100, there is an overbought condition which means that the price movement moves up along with the momentum and has deviated from normal fluctuations.
Suppose the CCI indicator curve is below -100. In that case, there is an oversold condition, which means that the price movement moves down along with momentum and deviates from the normal fluctuation.
Thus, the CCI is an indicator that measures the extent to which price has moved from its average value. When CCI is overbought or oversold, the price has passed the normal movement deviation value (standard deviation) from its average. An overbought condition is a signal to sell and an oversold condition is a signal to buy.
The Risks of Using CCI as a Sole Indicator
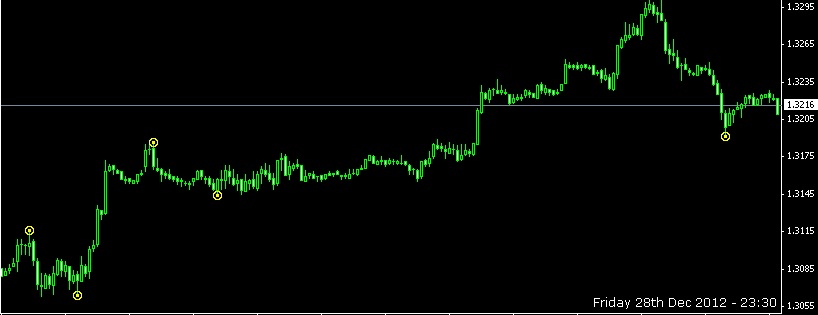
If you are trading solely on CCI without a combination of other indicators and price action analysis, there will often be error signals or false conditions. This is because CCI is a lagging indicator or an indicator that is always late in responding to price movements. CCI will give a signal after the last closing price. Here's an example:
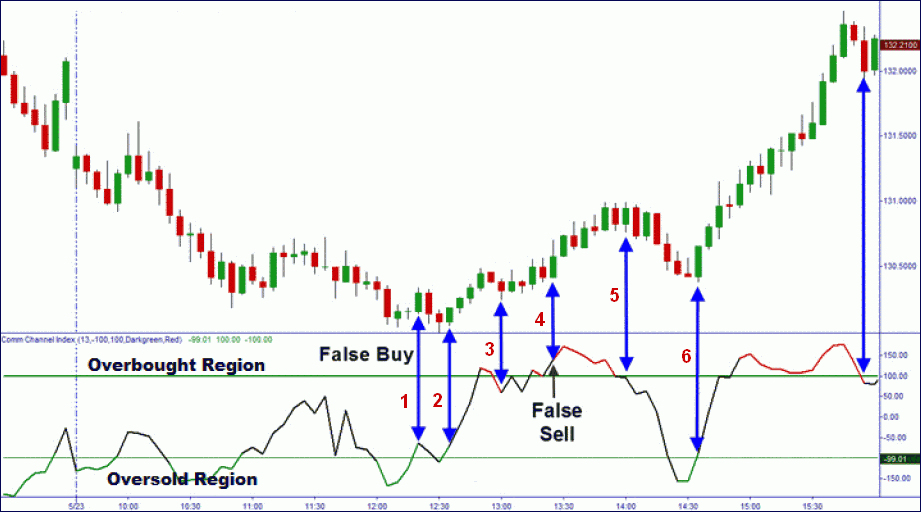
- False buy signal even when CCI has moved up from the oversold area.
- Correct buy signal.
- False sell signal even when CCI has crossed down the overbought level.
- False sell signal; the price continues increasing even though the CCI is overbought.
- Correct sell signal.
- Correct buy signal.
To avoid errors, traders should combine CCI indicator with price action analysis, moving average indicators (usually exponential moving average or EMA), and support resistance analysis.
Combining CCI with EMA and Price Action
Moving Average is a trend indicator because CCI does not show trend directions. It simply provides traders with information about the strength of the current trend.
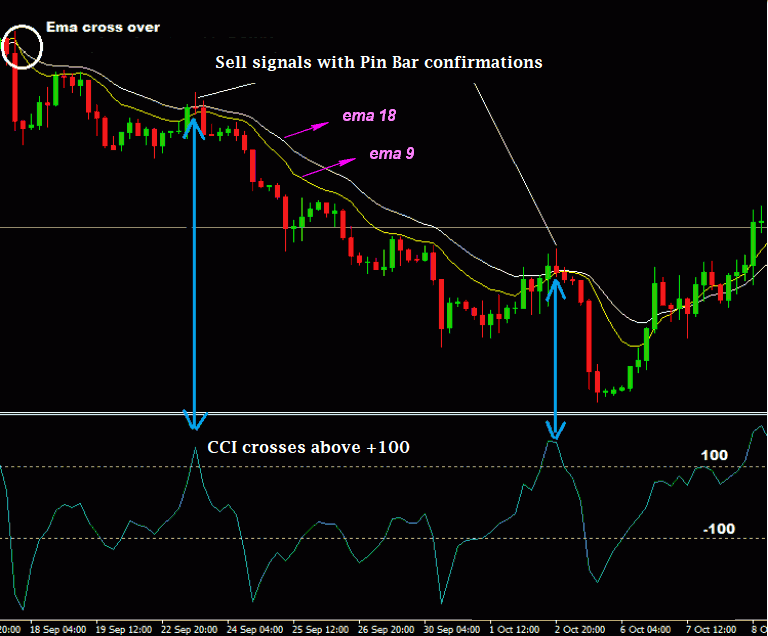
With 2 EMA lines, it can be seen that when the smaller EMA period (EMA 9) crosses, the larger EMA (EMA 18) from the top, the price movement will reverse downward.
For a sell entry, we have to wait until the CCI is in the overbought area, which is confirmed by the price action that has been formed. In the example above, the price formation is a Pin Bar.
Conversely, the price movement will reverse upward when EMA 9 crosses EMA 18 from below. So to get the best time to open a buy position, we have to wait until the CCI moves past the oversold area.
See Also:
Combining CCI with Support Resistance and Price Action Analysis
In this case, the stronger the resistance or support level, the more valid the CCI signal.
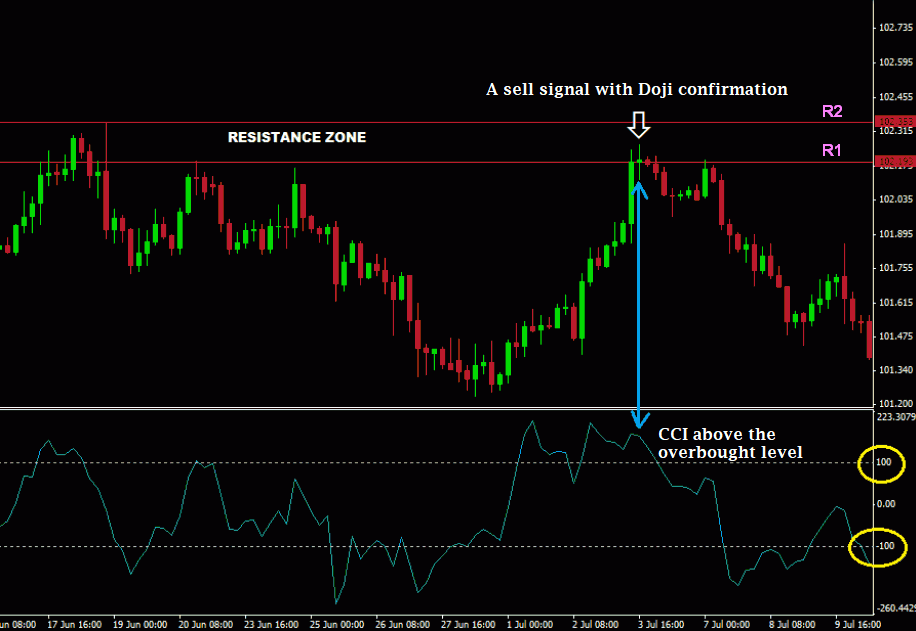
In the example above, a sell entry is confirmed when the price is in the resistance area (R1-R2) and the CCI indicator is in the overbought area. As further confirmation, we can see the formation of a Doji at the R1. Conversely, an entry buy can be validated when the price is in the support area and the CCI indicator curve is in the oversold area.
The two trading methods above can be applied at all time frames. Do note that the higher your time frame, the more valid the signal is. One example is trading with the daily time frame.


10 Comments
Nicholas
Jun 10 2023
When using the RSI (Relative Strength Index) indicator, it employs specific standard levels to determine overbought and oversold conditions. The threshold for overbought is set at 70, while for oversold, it is set at 30.
In the context of RSI, an overbought condition is observed when the indicator chart surpasses the 70 level, indicating a potential reversal or correction in price. On the other hand, an oversold condition is confirmed when the RSI chart falls below the 30 level, suggesting a possible buying opportunity.
Given these standard levels, it raises the question of how effective the RSI indicator is in identifying overbought and oversold market conditions. Does relying on the RSI as a standalone indicator provide accurate signals for traders? Are there any limitations or considerations to keep in mind when using the RSI to make trading decisions?
George
Jul 6 2023
@Nicholas: The RSI (Relative Strength Index) is pretty handy for spotting overbought and oversold conditions in the market. When the RSI goes above 70, it's like a red flag for overbought—prices might need to come down. On the flip side, when the RSI drops below 30, it suggests oversold—potential buying opportunity!
But hey, don't rely on the RSI alone. It's not foolproof. Sometimes it gives false signals or gets stuck in those extreme zones for a while during strong trends. So, it's smart to use other indicators, check patterns, or consider fundamental factors to confirm the RSI's signals.
Watch out for divergence too! That's when the RSI moves in the opposite direction of prices, signaling possible trend reversals. But be cautious and look for more evidence before making decisions.
Remember, the timeframe you're trading on matters, and combining the RSI with other indicators and your own analysis can give you a better picture of what's going on. Keep it balanced and always consider the bigger market context.
Antonio
Jul 9 2023
Dude, What are the key differences between the Commodity Channel Index (CCI) and the Relative Strength Index (RSI) based on their functions and applications in technical analysis? Both CCI and RSI are popular oscillators utilized to identify momentum and potential overbought or oversold conditions in the market. However, in terms of their specific features and purposes, how do CCI and RSI differ? Additionally, how does the CCI's ability to detect divergences in price movement contribute to identifying potential changes in trend direction?
Benitez
Jul 10 2023
@Antonio: Hey, dude! So, the Commodity Channel Index (CCI) and the Relative Strength Index (RSI) are both cool tools used in technical analysis, but they have some differences in their functions and applications.
The RSI is mainly used to measure the speed and change of price movements. It helps us identify overbought or oversold conditions in the market. It's like a speedometer for price momentum, dude.
On the other hand, the CCI is more focused on detecting deviations from the average price. It measures the relationship between the current price, the average price, and standard deviations. It's like a detective sniffing out divergences from the norm.
When it comes to divergences, the CCI is a champ. It can spot divergences between price movements and the CCI itself. If the price is going one way, but the CCI is showing something different, it can signal a potential change in the trend direction, dude.
Husni
Nov 22 2023
The article breaks down trading indicator in a simple way, focusing on identifying oversold and overbought areas. It suggests buying (going long) when the price hits the oversold region, as RSI signals a potential price increase. Conversely, it recommends selling (going short) when the price hits the overbought area, indicating that the price might not sustain at that level for long and could drop soon. However, what confuses me in the article is when it talks about combining CCI with price action. I'm not clear on what "price action" means. I've come across this term in various trading articles, and I'd appreciate an explanation.
Fidelia
Nov 24 2023
Allow me to clarify the concept of price action. In the trading realm, "price action" pertains to observing and understanding the movement and behavior of a financial instrument's price on a chart. It involves studying how prices evolve over time, without relying on indicators or oscillators such as RSI. Traders who delve into price action analysis focus on identifying patterns, trends, support and resistance levels, and other visual cues on a price chart to inform their trading decisions. Essentially, the straightforward definition of price action is observing and interpreting the movements on a price chart. For example of price action, you can read this : 3 Most Common Price Action Indicators.
So, when the article discusses merging RSI with price action, it probably means incorporating signals from the Relative Strength Index (RSI) into the broader context of how the price behaves on the chart. This fusion offers traders a more holistic perspective, allowing them to make more informed decisions by considering both the momentum indicated by RSI and the overall movement of prices.
Burhan
Jan 15 2024
Hey there! Want to ask several question here! So, Is it a sound strategy to integrate both the Relative Strength Index (RSI) and Stochastic indicators for a comprehensive assessment of overbought and oversold conditions in Forex Trading? The article underscored the utility of oscillators like RSI and Stochastic, each featuring two distinct standard levels, in effectively identifying both overbought and oversold states.
Expanding on this, one might wonder about the spectrum of technical indicators available for discerning overbought and oversold conditions in the dynamic realm of Forex Trading. Beyond RSI and Stochastic, are there other indicators that traders commonly rely on for this purpose? And which one proves to be more accurate in identifying overbought and oversold conditions?
Your insights on these questions would be greatly appreciated! As traders navigate the complexities of the Forex market, understanding the nuances of different indicators and their interplay becomes instrumental in making informed and strategic decisions. Thank you!
Choky
Jan 19 2024
Hello there! Utilizing both the Relative Strength Index (RSI) and Stochastic indicators to evaluate overbought and oversold conditions in Forex Trading can significantly deepen our analytical insights. Having multiple indicators in play enhances the precision of the signals they generate, striking a balance without overwhelming the analysis with excessive indicators (two being my preferred sweet spot).
Expanding our perspective, the array of technical indicators available for identifying overbought and oversold states in Forex Trading goes beyond just RSI and Stochastic. Traders often delve into supplementary tools like the Commodity Channel Index (CCI) or the Moving Average Convergence Divergence (MACD), as the article has illustrated, to obtain a comprehensive understanding of market dynamics. If you need a more detailed breakdown, revisiting this article could provide additional insights.
Now, delving into the individual accuracy of RSI and Stochastic opens the door to an intriguing exploration. Each indicator brings its unique strengths to the table; RSI's knack for smoothing out fluctuations contrasts with Stochastic's proficiency in capturing short-term price movements. Determining which is more accurate may hinge on a trader's specific objectives, personal preferences, and the ever-shifting conditions of the market.
Feel free to check out the article again for a more in-depth explanation, and let me know if you have further questions or insights to share!
Phil
Apr 25 2024
Hey, can you explain the distinction between an oscillator and the CCI? I read in this article that the Commodity Channel Index (CCI) falls under the oscillator category, commonly employed to identify momentum. As an oscillator, the CCI serves as an indicator for overbought and oversold conditions. Additionally, it detects divergences in price movement direction, potentially signaling a shift in trend direction. However, oscillators generally encompass these features as well. Hope there is an explanation about CCI and Oscillator! and what is the best for beginner?
Jesse
Apr 29 2024
Certainly! Let's clarify with an example:
Imagine you're analyzing a stock using both an oscillator like the Relative Strength Index (RSI) and the Commodity Channel Index (CCI).
The RSI oscillates between 0 and 100, with readings above 70 indicating overbought conditions and readings below 30 indicating oversold conditions. You might use the RSI to identify potential reversal points in the stock's price trend.
Meanwhile, the CCI also oscillates around a centerline, typically with levels above +100 indicating overbought conditions and levels below -100 indicating oversold conditions. Additionally, you might use the CCI to spot divergences between price movements and the indicator, suggesting potential trend reversals.
So, while both the RSI and CCI are oscillators that can identify overbought and oversold conditions and detect divergences, they have different calculation methods and parameters, providing complementary insights into the market dynamics.