 Dedicated FREE FOREX VPS
 Free FOREX Virtual Private Server
 MT4 Demo Contest, Get $500
 Sign Up for an Account, Claim 60% Deposit Bonus
 Free MT4/MT5 VPS 2024
 Send E-mail and Get Free Merchandise
 $1K Refer a Friend Bonus for Pepperstone Pro clients
 Maximize Your Earnings with 100% Deposit bonus
 Trade to Win, $5,000 Monthly Demo Contest
 Claim 30% + 15% Deposit Bonus from LiteFinance
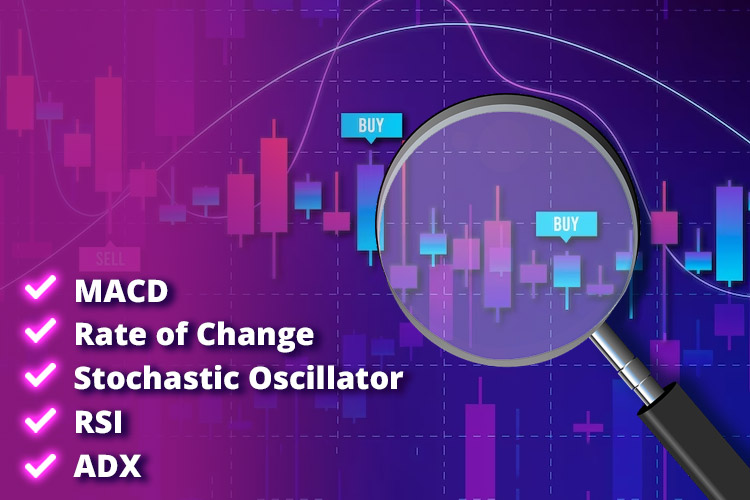
From MACD, RoC, to ADX, here are 5 best momentum indicators that traders can use to identify trading signals and make better trading decisions.
In the world of trading, being able to understand price movements is crucial. Therefore, many traders use various technical indicators to assist them in making trading decisions. One type of technical indicator commonly used is momentum indicators. These indicators measure the speed of price changes over a period of time, which can help traders predict the next price movement direction more accurately.
However, it is important to note that each indicator has its own strengths and weaknesses, so it is essential to understand its characteristics before using it in trading. In this article, we will discuss the 5 best momentum indicators for identifying market trends and potential reversals. But before that, let's get to know more about momentum indicators first.
Contents
What is a Momentum Indicator?
In short, a momentum indicator is a technical tool used to measure the strength and speed of price movements. Momentum indicators help traders determine whether a price trend will continue or reverse. This indicator is commonly used in various markets such as stocks, forex, commodities, and crypto.
If the momentum indicator shows strong buying pressure, the price has the potential to continue to rise. Conversely, stronger selling pressure tends to indicate a price drop.
One of the advantages of using momentum indicators is that they can help traders identify significant price changes before they occur. With momentum indicators, traders can see whether the price is experiencing a reversal or just a temporary correction. This can help traders make better decisions in trading.
How to Trade with Momentum Indicators?
Momentum indicators are commonly used to find trading signals. However, it is better to use this indicator to confirm the validity of trading based on price actions such as breakouts or pullbacks.
In practice, there are several ways that traders can use to obtain signals from momentum indicators, including:
Crossover Signals
A crossover signal occurs when two or more different period indicator lines intersect each other. Crossover signals are often used to identify changes in the price movement direction and provide Buy or Sell signals.
For example, when a trader uses the Moving Average Convergence Divergence (MACD) indicator, Buy or Sell signals are generated when the slow MA on the MACD indicator crosses the fast MA from above or below.
See Also:
Divergence
Divergence in forex trading refers to a situation where the movement of a currency price does not correspond with the technical indicator. In this case, traders look for the difference between the price movement direction and momentum indicators as potential signals to determine entry.
There are two types of divergence that can be used as a reference, namely bullish divergence and bearish divergence. A bullish divergence occurs when the currency pair price decreases while the momentum indicator shows an upward trend. On the other side, a bearish divergence occurs when the currency pair price increases but the momentum indicator shows a downward trend.
What are the Best Momentum Indicators?
Here are several top momentum indicators to measure the speed of price movements and make informed trading decisions:
1. MACD
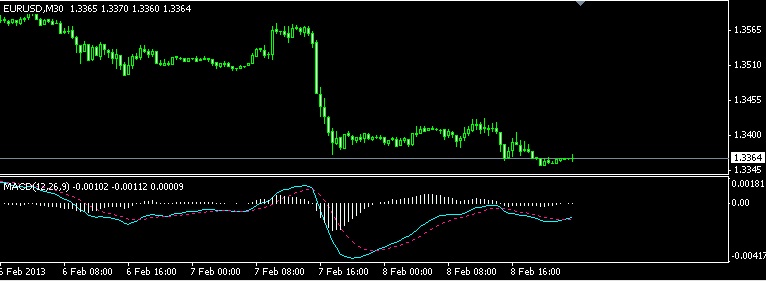
The Moving Average Convergence Divergence (MACD) is the best momentum indicator to measure the strength, direction, and momentum of the price movement of a currency pair. MACD consists of the MACD line, the signal line, and a histogram.
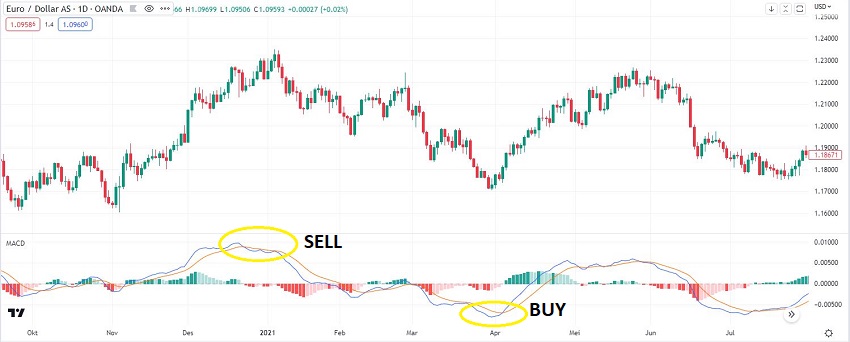
The MACD line is the difference between two exponential moving averages (EMA) with different periods, namely 12 EMA and 26 EMA. When the MACD line crosses the signal line from bottom to top, it indicates a Buy signal, but when the MACD line crosses the signal line from top to bottom, it indicates a Sell signal.
The MACD histogram shows the difference between the MACD line and the signal line. When the histogram is above zero, it indicates that the price is rising with strong momentum. On the other hand, when the histogram is below zero, it indicates a downward momentum in price. For a clearer picture, please see the chart below.
2. Rate of Change
The next best momentum indicator is the Rate of Change (RoC), which is commonly used to measure the percentage change in the price of a currency pair over a certain period. RoC calculates the percentage change in the current price compared to the price of several periods ago. This helps traders identify market trends and momentum, as well as potential signals to buy or sell a currency pair.
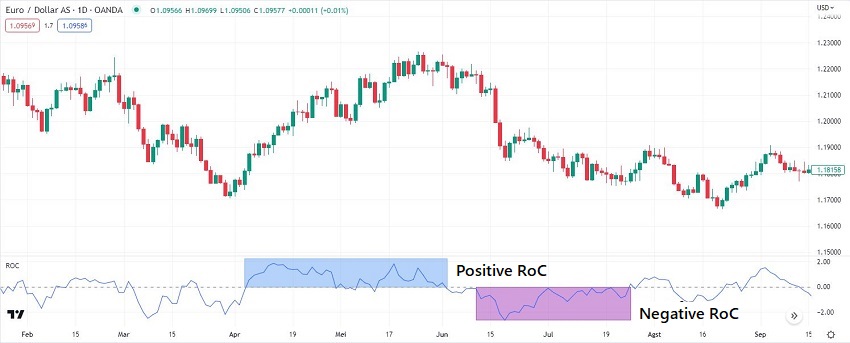
RoC is calculated by comparing the current price to the price of several periods ago. The result then would be divided by the price of the previous period, and multiplied by 100 to get the percentage change. RoC often uses the period of 12 as the default.
When the RoC value is positive, it indicates that the price is rising and is indicated as a Buy signal. Conversely, when the RoC value is negative, it indicates that the price is falling and is a Sell signal. An example of its use can be seen in the figure below.
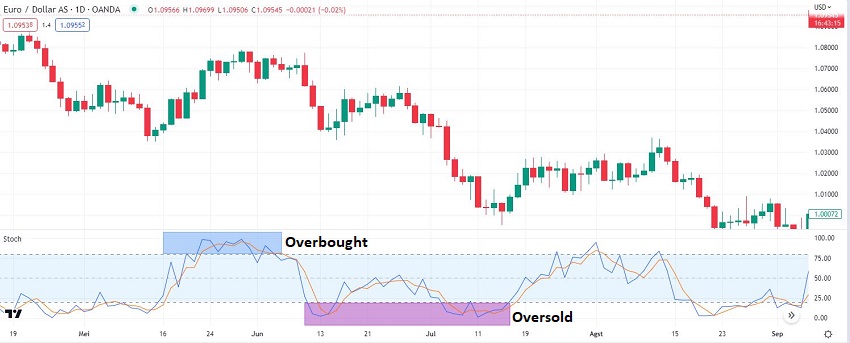
3. Stochastic Oscillator
The Stochastic Oscillator is the next top momentum indicator to measure the speed and momentum of a currency pair's price movement. This indicator compares the last closing price with the highest and lowest price range over a certain period.
The Stochastic Oscillator consists of two lines, namely %K and %D. The %K line is the fast line calculated based on the comparison between the last Close and High-Low over a certain period. Meanwhile, the %D line is the slow line that is the moving average of %K.
The Stochastic Oscillator usually uses the period of 14 as the default. When the %K line crosses the %D line from bottom to top, it indicates a Buy signal. But when the %K line crosses the %D line from top to bottom, it indicates a Sell signal.
The Stochastic Oscillator also uses overbought and oversold levels as references. The overbought level is usually set at 80, while, the oversold level is usually set at 20. An example of its use is as follows:
4. Relative Strength Index
The RSI is one of the best momentum indicators as it can measure the relative strength of a currency pair over a specific time period. RSI is calculated by comparing the average price increase over a certain time to the average price decrease over the same period. RSI uses a scale of 0-100, where a value of 70 or above indicates overbought, while below 30 indicates oversold.
When the RSI reaches the overbought level, it indicates that the price has risen too high and may experience a correction or price reversal. Conversely, when the RSI reaches the oversold level, it indicates that the price has dropped too low and has the potential to rebound.
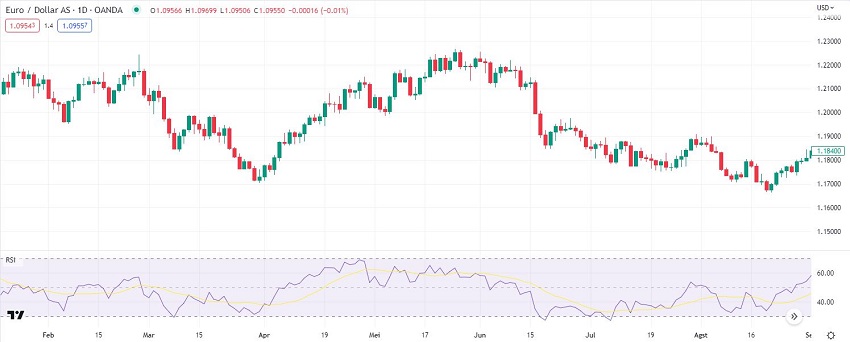
RSI can also be used to identify divergences, where the price and RSI tend to move in opposite directions. A bullish divergence occurs when the price weakens but RSI strengthens, while a bearish divergence occurs when the price rises but RSI moves down.
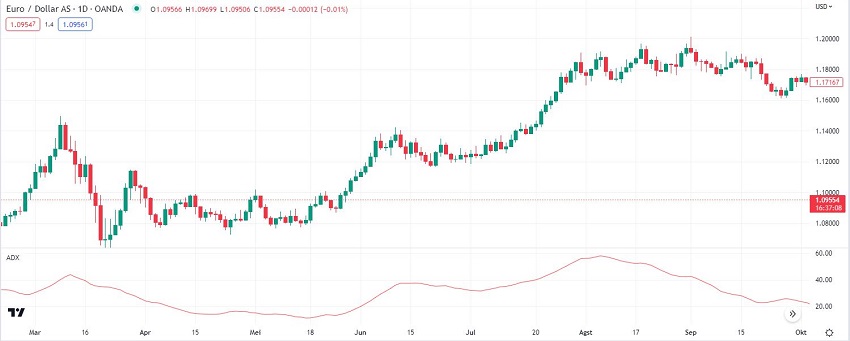
5. Average Directional Index
The last best momentum indicator is ADX. This indicator can help traders identify whether the market is in a strong or weak trend.
ADX is calculated using the difference between positive and negative Directional Movement Indicator (DMI), then validated with Moving Average. The ADX indicator is usually measured on a scale of 0-100, in which a value above 25 indicates a strong trend, while ADX below 25 indicates a weak or consolidating trend. ADX can also be used to identify divergence.
Conclusion
Basically, the five indicators above can be used to better identify changes in momentum and price direction. Therefore, traders can identify profitable trading opportunities more easily and accurately. However, it is important to remember that momentum indicators should be used carefully. To get more accurate trading signals, traders can combine them with fundamental analysis or price action.