 Dedicated FREE FOREX VPS
 Free FOREX Virtual Private Server
 MT4 Demo Contest, Get $500
 Sign Up for an Account, Claim 60% Deposit Bonus
 Free MT4/MT5 VPS 2024
 Send E-mail and Get Free Merchandise
 $1K Refer a Friend Bonus for Pepperstone Pro clients
 Maximize Your Earnings with 100% Deposit bonus
 Trade to Win, $5,000 Monthly Demo Contest
 Claim 30% + 15% Deposit Bonus from LiteFinance
The three-bar reversal pattern can be easily modified for day trading and when paired with other forms of analysis, it can provide an optimal entry point for day traders.
The three-bar reversal pattern is a triple candlestick formation that is generally applied to identify an upcoming reversal from the current price movement. Triple candlestick patterns are said to be one of the strongest price action tools as they take three formations to confirm the signal, and the three-bar reversal pattern is not an exception.
According to Alton Hill, a trading educator and author, the bar reversal pattern can be a valuable tool for day traders as long as traders pay attention to increased volatility and noise in intraday time frames. Hill suggests that the best three-bar reversal pattern for day trading is one where the third bar in the pattern closes above the highest level of the first two bars.
This modified pattern helps to filter out false signals and improve the chances of success. Hill also provides a diagram that illustrates the difference between a regular three-bar reversal pattern and his day trading version.
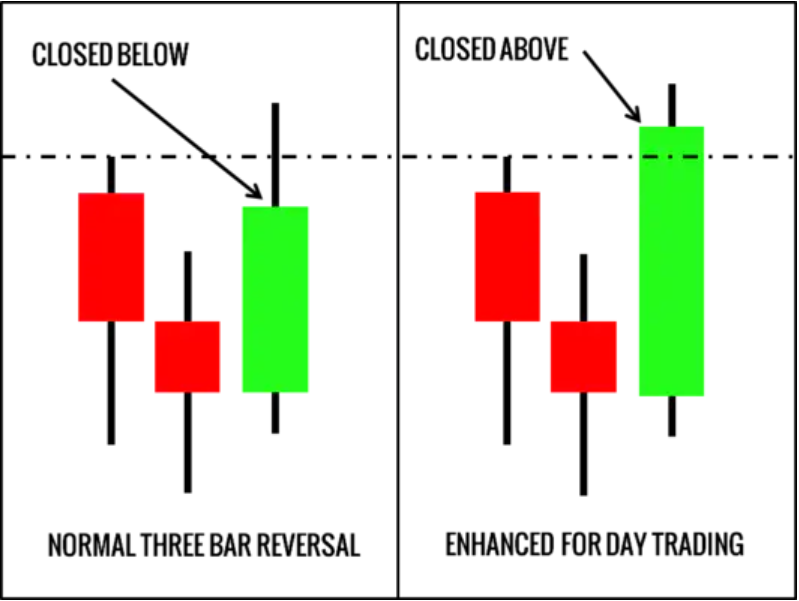
The diagram illustrates the difference between the normal three-bar reversal pattern and the version recommended by Alton Hill for day trading. The normal pattern is characterized by a bearish or bullish reversal signal, with the third bar closing below or above the first two bars. However, Hill's day trading version of the pattern adds additional criteria that the third bar must close above the highest level of the first two bars, making it more robust to the volatility and noise that can occur in intraday time frames. As such, the enhanced version can help to filter out false signals and increase the chances of success for day traders.
Contents
Trading Rules
Long Setup
- Bar 1 shows a decrease in value and is closed down, represented by a red color.
- The low of bar 2 is lower than both the low of bar 1 and the low of bar 3.
- Bar 3 shows an increase in value and its closing value is higher than the highest values of both bar 1 and bar 2.
- A recommendation to buy is made at the close of bar 3.
Short Setup
- Bar 1 shows an increase in value and is closed up, represented by a green or bullish color.
- The high of bar 2 is higher than both the high of bar 1 and eventually the high of bar 3.
- Bar 3 shows a decrease in value and its closing value is lower than the lowest values of both bar 1 and bar 2.
- A recommendation to sell is made at the close of bar 3.
Ways to Increase Accuracy
Day trading using only a three-bar reversal pattern may lack accuracy. If you use this pattern in any context, the accuracy is not good, especially if your entry position is opposite to the current trend.
Therefore, additional parameters are needed to increase accuracy and improve the risk/reward ratio. The way to do this is by implementing 3 important steps, namely price structure, key levels, and entry signals. In this case, the three-bar reversal pattern we discussed in this article is the entry signal after identifying the price structure and key levels.
Let's discuss them one by one.
1. Price Structure
The first process that must be done is to identify the price structure that occurs. Price structure is divided into two, namely trending and sideways.
A trending condition is characterized by a tendency for prices to rise or fall while sideways is characterized by prices that move up and down within a certain range; usually between support and resistance levels. An uptrend is seen from the formation of higher highs and higher lows and a downtrend is seen from the existence of lower lows and lower highs.
Conditions that are more suitable for using three-bar reversal patterns are trending because the price direction is clear and the potential risk/reward ratio is good. The trade entry should follow the current trend, in which buy positions should be prepared during an uptrend and vice versa.
2. Key Levels
After identifying the price structure and knowing the current price direction, the next step is to look at key levels as entry areas. Entry at key levels will increase your chances of success compared to entry based solely on candlestick patterns.
There are many key levels that you can use such as support and resistance, supply and demand, pivot points, Fibonacci retracement, etc. You can also use technical indicators of the oscillator type such as RSI to see overbought and oversold levels as key levels.
If you use key levels from support and resistance, mark the strong levels on the price chart. If the price is in a downtrend, the key level you mark is the resistance level as a selling area. Conversely, if the price is in an uptrend, mark the support level as a buy area.
3. Entry signal
Finally, you just have to wait for the price to enter the levels you have marked and form a three-bar reversal pattern. A sell or buy position is entered if the price shows a valid three-bar reversal pattern.
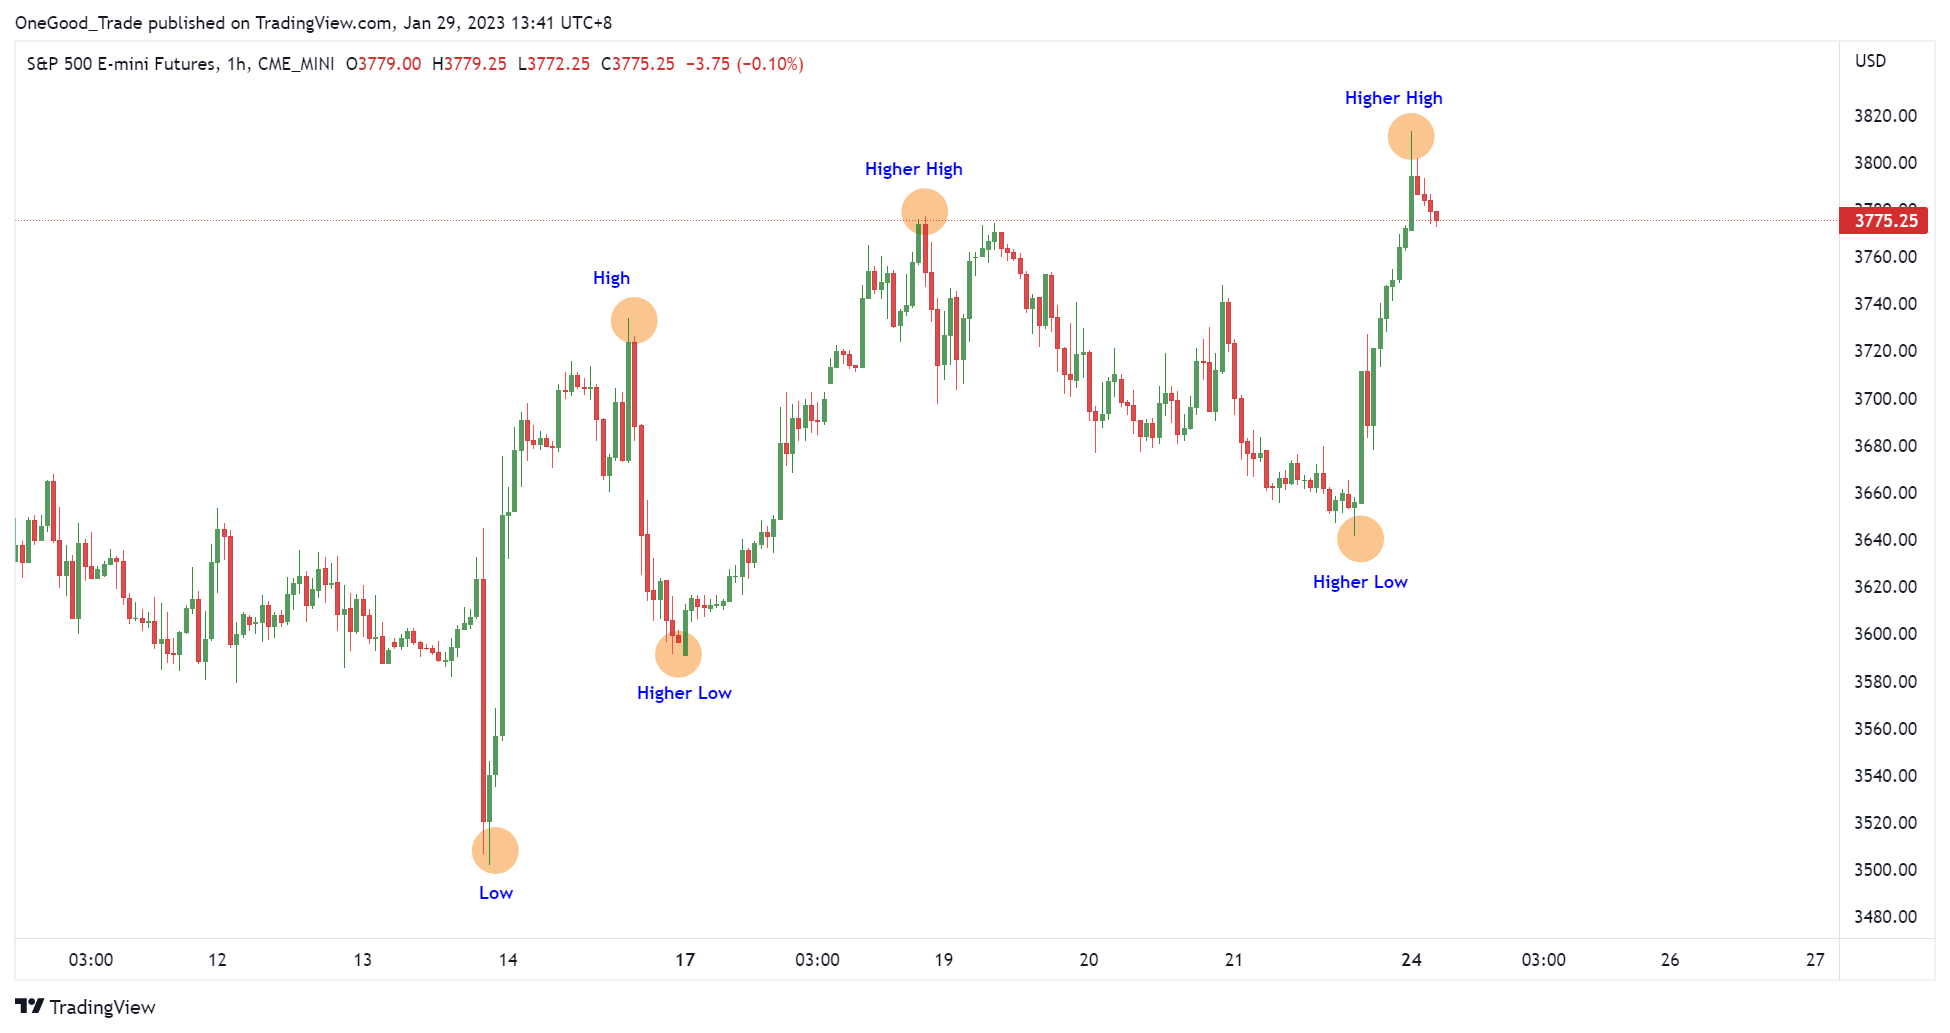
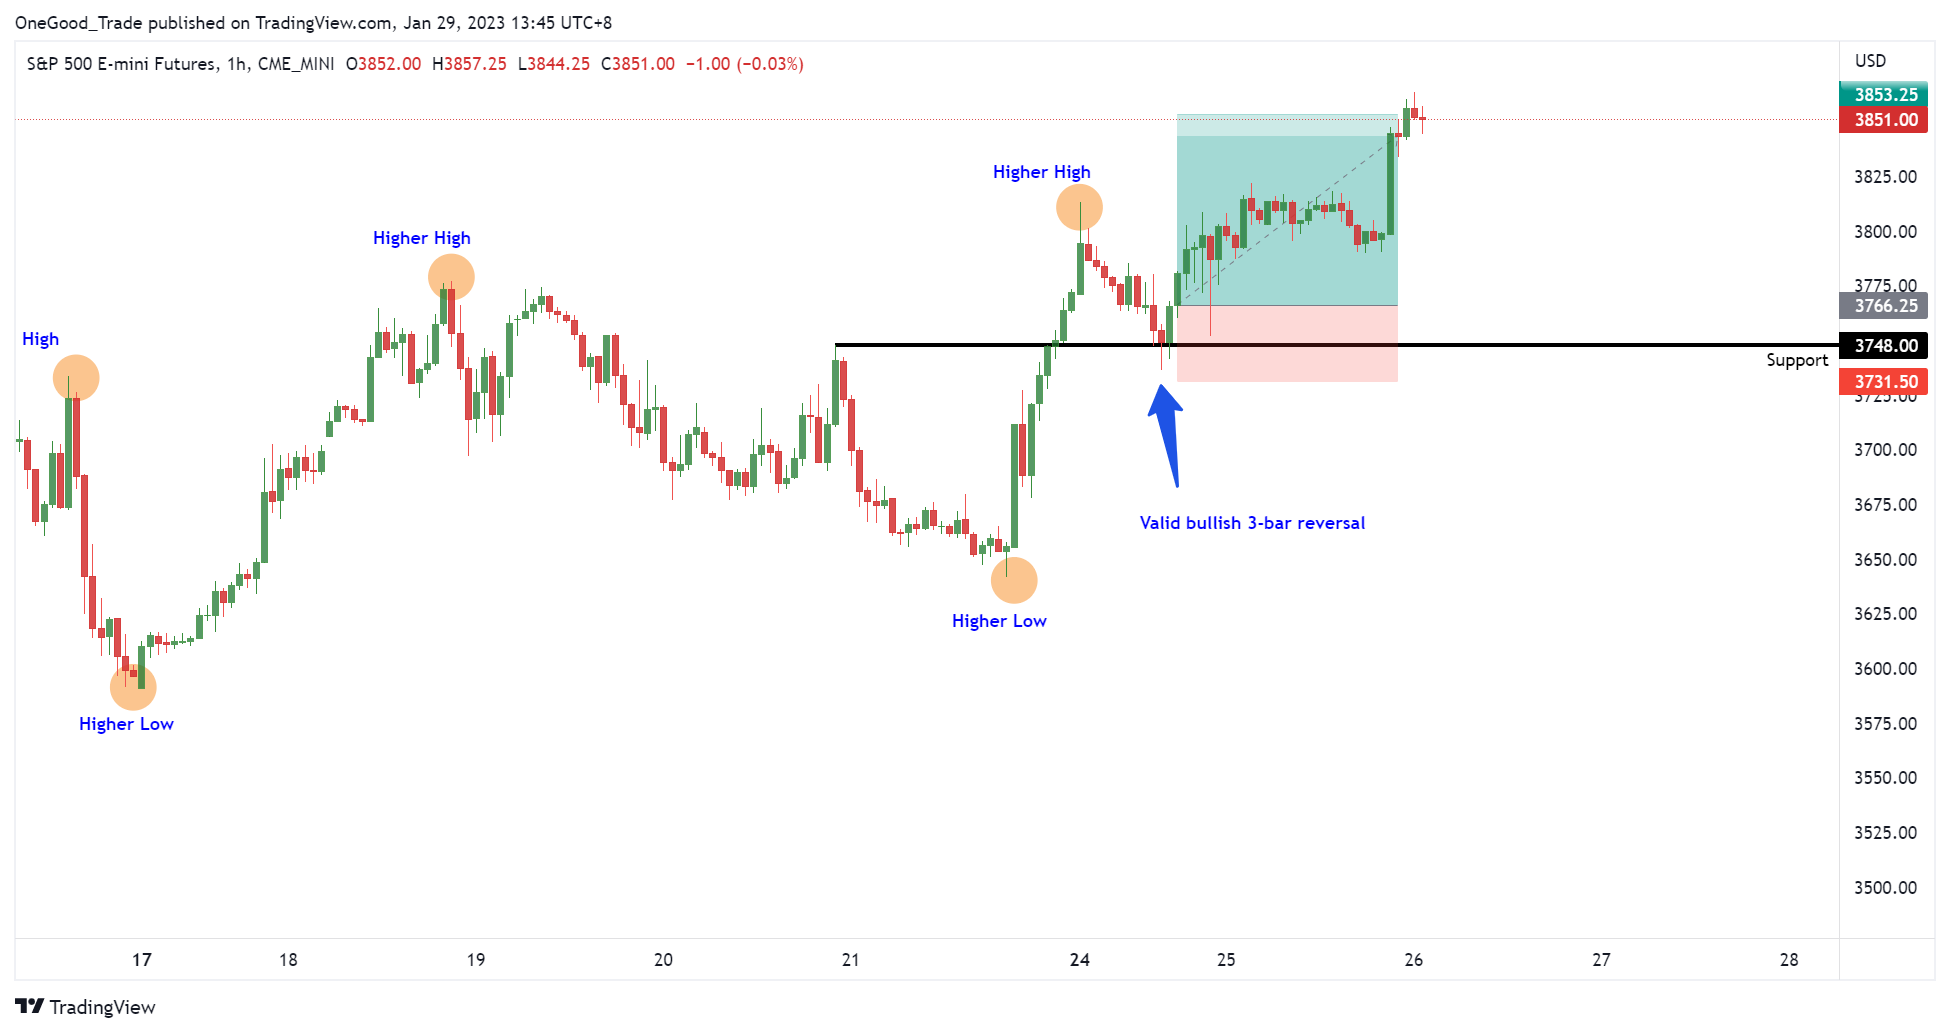
In order to make it clearer, I will provide an example of its application on the chart. Look at the E-mini S&P 500 futures chart below. It can be seen that the price is in an upward trend. The upward trend is marked by the presence of higher highs and higher lows.
See Also:
Because the trend is rising, we will mark the important levels for the buy area. In this case, I marked the important support level as 3748.00.
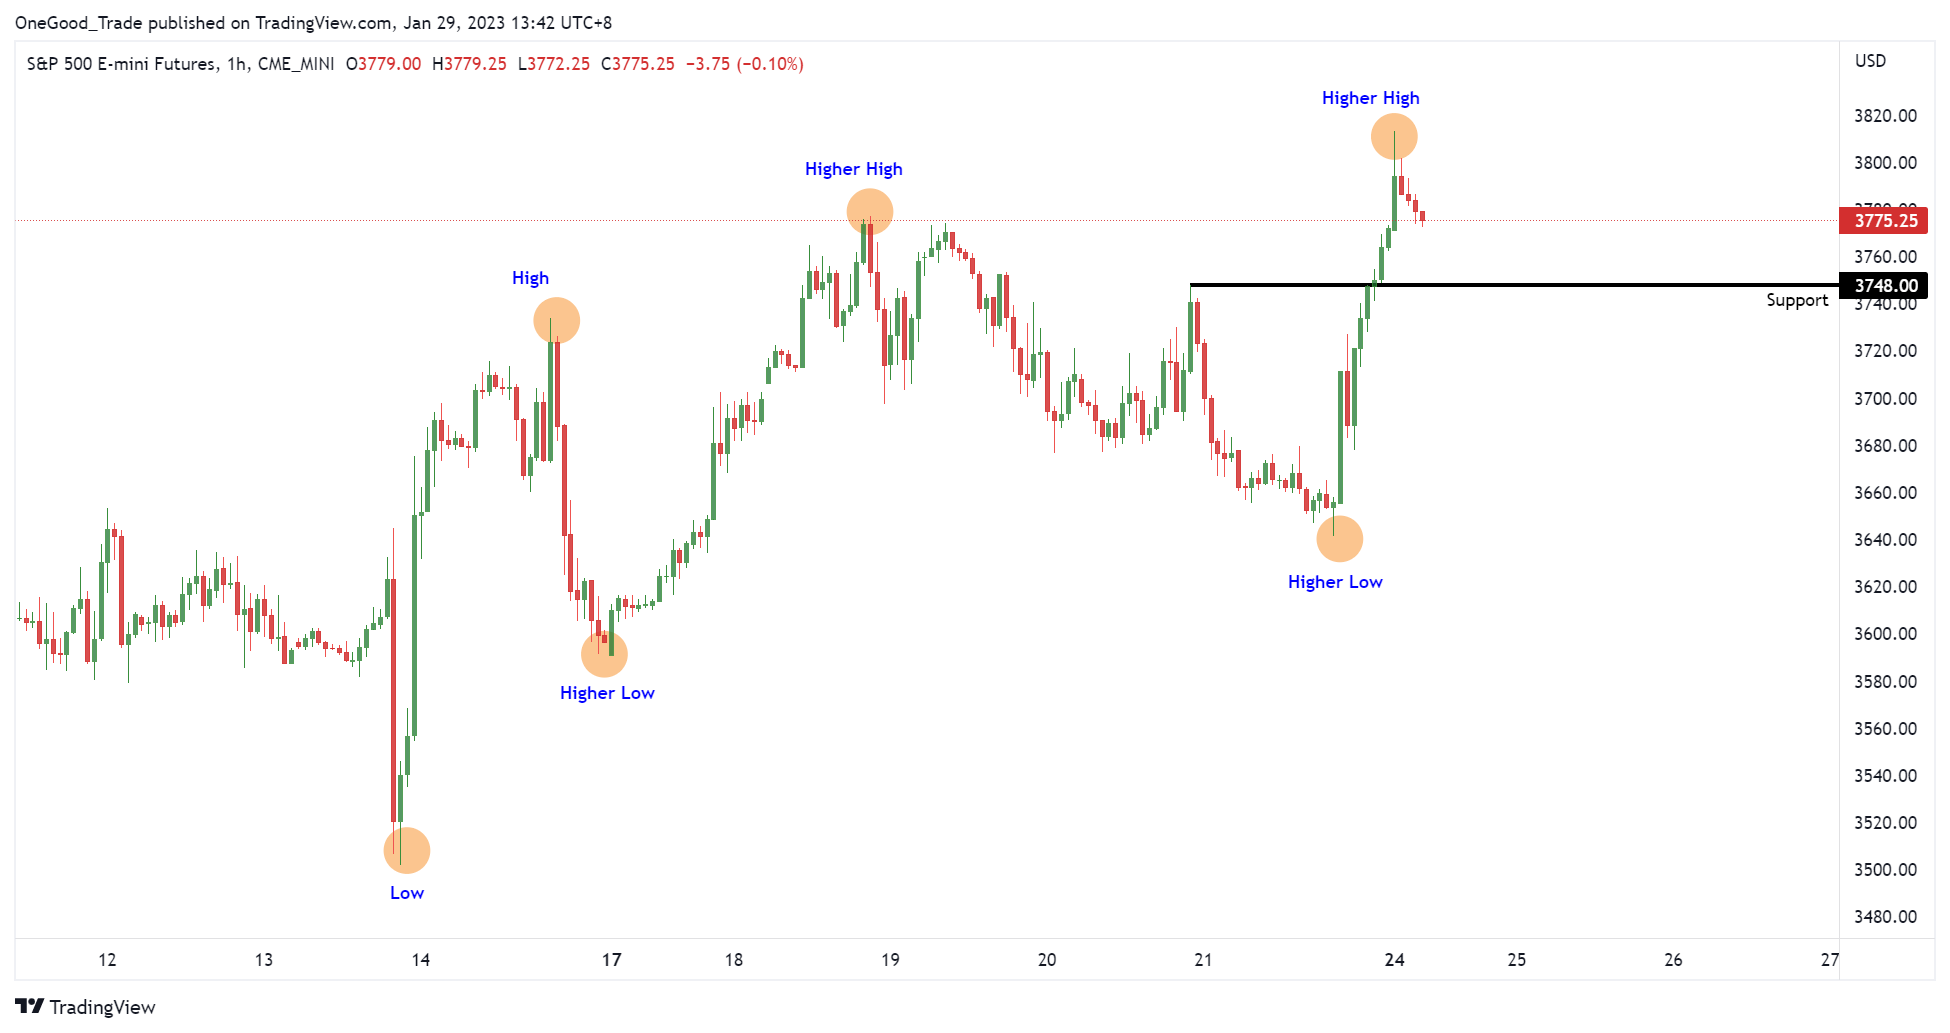
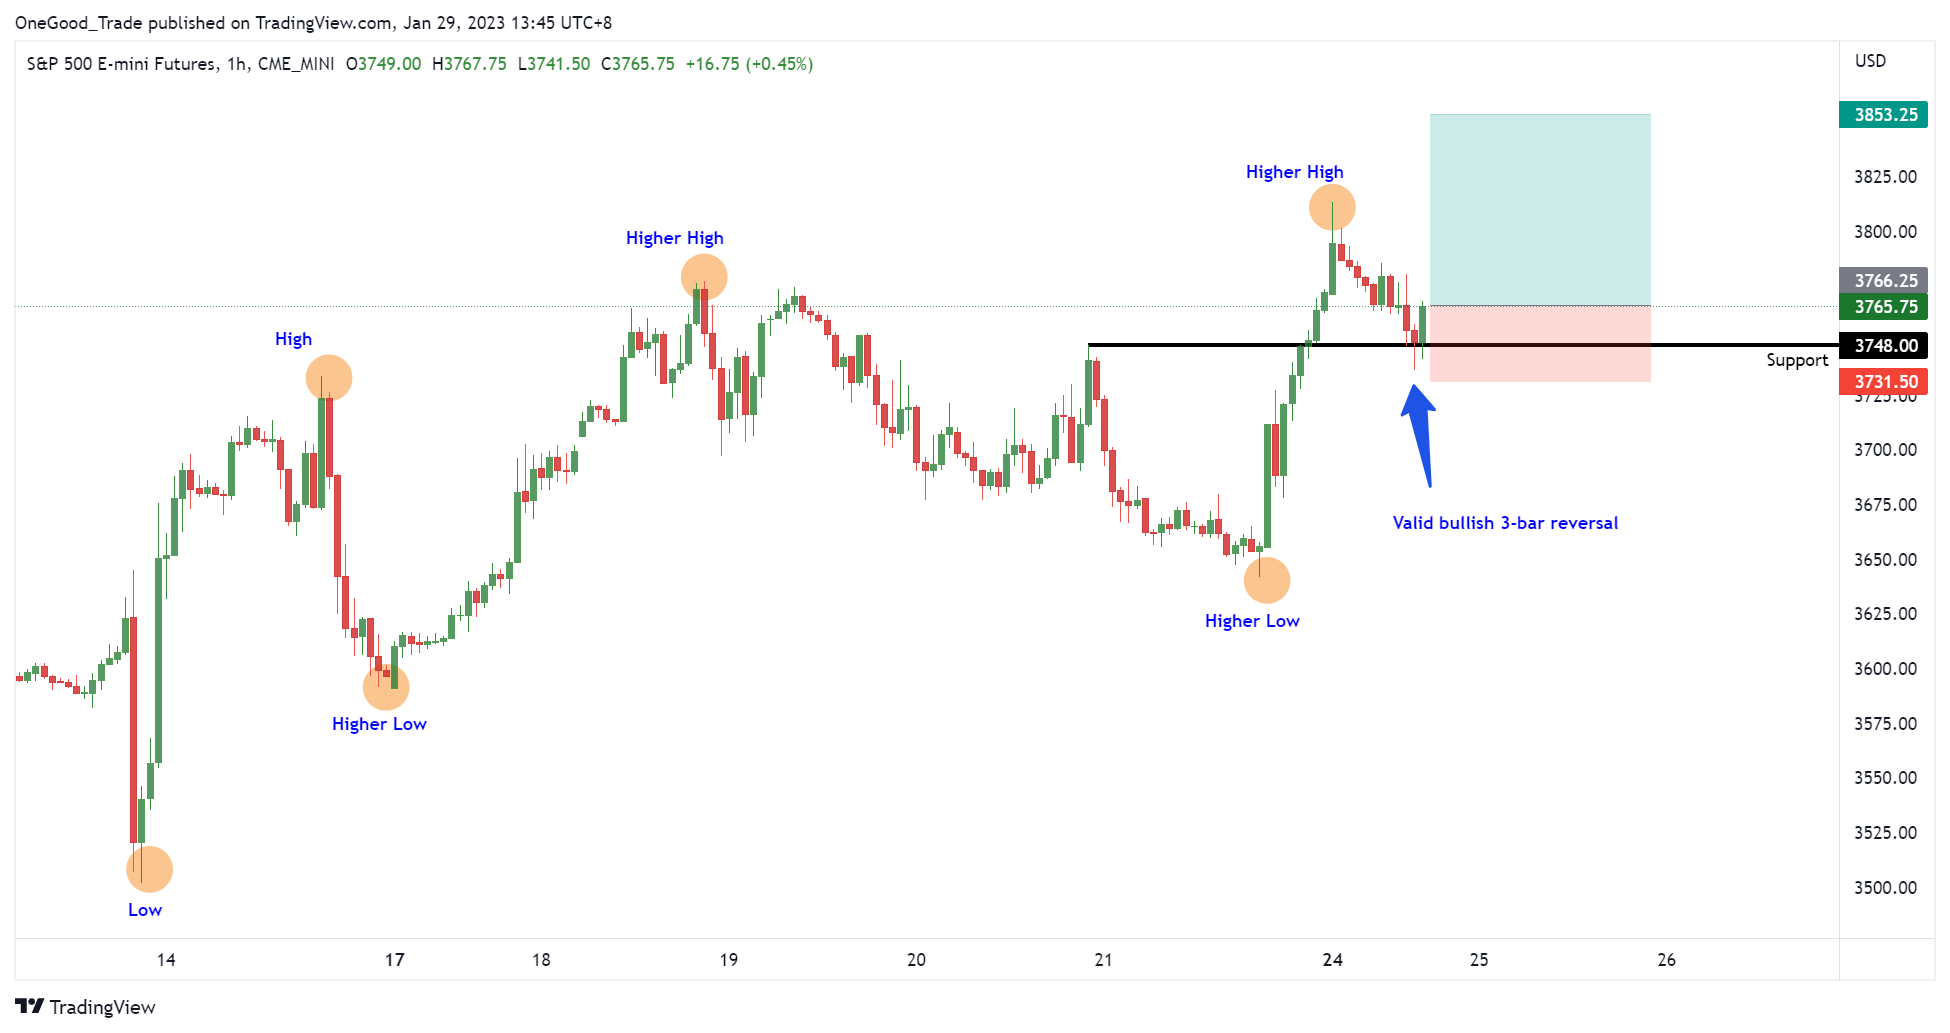
The price experiences a pullback and tests the support level of 3748.00. During the testing, the price is rejected and forms a valid three-bar reversal pattern, so the buy position is confirmed. The stop loss should be placed below the recent low of around 3731.50, while the take profit could be positioned around 3853.25.
See Also:
The chart below shows how the trade progresses. After forming a three-bar reversal pattern at 3748.00, the price continues to rise and successfully reaches the take profit at 3853.25. In that case, you would have earned a handful amount of profits from that trade.
Final Thoughts
The modified version of the three-bar reversal pattern is noteworthy for its effectiveness. By adding a simple rule, the typical pattern has been transformed into a strong trade setup. It's important to note that this added rule requires confirmation of the pattern before entering the trade.
The technique of candle blending can also be used to improve the standard three-bar reversal pattern. If the third bar (Bar 3) in the pattern is followed by strong movement in the fourth bar (Bar 4), combining the two bars can create an enhanced version of the pattern. This modified pattern can be used in combination with other indicators or price patterns to identify high-probability trade setups, such as the example of a head and shoulders formation and a three-bar reversal pattern.
However, because of this additional criterion, the signal bar (Bar 3) tends to have a wider range, which can increase the risk of the trade. To manage this risk, traders may need to reduce their trade size or place their stop loss orders closer to the signal bar. If the risk cannot be managed, it may be best to skip the trade setup altogether.
It's important to note that if the middle bar of the three-bar reversal pattern is an outside bar, traders should exercise extra caution. An outside bar is a bar that has a higher high and lower low compared to the previous and following bars. This type of bar is often seen as a sign of increased volatility and unpredictability in price action, so traders should be mindful of the potential risks involved in trading this pattern.
For more tips on trading price action strategies, you could check out Price Action Secrets You Need to Watch For.


5 Comments
Justin
Feb 1 2023
I recently came across this article discussing the concept of the 3 bars reversal pattern in trading, and I found it quite intriguing. However, I would like to know more about the reliability and effectiveness of this pattern before considering it in my trading strategy.
Based on the article you mentioned, it seems that the 3 bars reversal pattern can be a tempting trading signal. It suggests that after three consecutive bars moving in a specific direction, a reversal is likely to occur. This pattern can potentially provide traders with early entry opportunities and the chance to capture trend reversals.
To gain a deeper understanding, I would like to explore the reliability of the 3 bars reversal pattern. Are there any statistical studies or historical data that support its effectiveness? Additionally, what are the key factors or criteria that traders should consider when identifying and validating this pattern? Are there any specific market conditions or timeframes in which the 3 bars reversal pattern tends to perform better?
Rendy
Jun 11 2023
@Justin: Hey there! The 3 bars reversal pattern does sound intriguing, doesn't it? It's always smart to dig deeper and understand the reliability before adding it to your trading strategy.
To evaluate the pattern's effectiveness, it's good to look for statistical studies or historical data that back it up. Check if there are any reputable sources or trading platforms that have conducted research on this pattern. They might have analyzed a large dataset and provided insights into its success rate.
When identifying and validating the pattern, keep an eye on a few factors. Firstly, look for three consecutive bars moving in a specific direction, signaling a potential reversal. Make sure there is a clear change in momentum or sentiment. Secondly, consider the volume during the pattern formation. Higher volume can indicate stronger confirmation.
Gredinho
Jun 17 2023
When it comes to analyzing price structures in trading, it's essential to understand the two main types: trending and sideways. So, how can traders determine whether the market is in a trending or sideways condition? Are there any indicators or patterns that they should keep an eye on? And within a trending market, what are the telltale signs of an uptrend or a downtrend? I'm curious to know if there are specific formations or patterns that traders use to confirm these trends. Having a solid grasp of these basic principles of price structure can really help traders make more informed decisions and navigate the market with confidence.
Leandro
Jun 19 2023
@Gredinho: To determine if the market is in a trending or sideways condition, traders look for certain indicators and patterns. One popular tool is moving averages, which help identify trends. When the price consistently moves in one direction with the moving averages sloping in the same direction, it's likely a trend. On the other hand, if the price fluctuates within a range and the moving averages flatten out, it indicates a sideways market.
Now, within a trending market, traders rely on a variety of formations and patterns to confirm whether it's an uptrend or a downtrend. One classic pattern is higher highs and higher lows for an uptrend, indicating buying pressure and upward momentum. Conversely, lower highs and lower lows signal a downtrend, with selling pressure and downward momentum.
In addition to these patterns, traders use trendlines to validate trends. Drawing a trendline along the swing lows in an uptrend or swing highs in a downtrend helps visualize the trend's strength and provides potential entry and exit points.
Candlestick patterns, such as bullish engulfing or bearish harami, also play a role in confirming trends. These patterns give insights into market sentiment and can provide further confirmation of an uptrend or downtrend.
Read : 3 Best Ways to Confirm Trend Continuation
Benitez
Jul 3 2023
How can support and resistance levels be used to identify and confirm the effectiveness of the modified three-bar reversal pattern? Considering that the modified pattern requires confirmation before entering a trade, are there any specific techniques or indicators that can be combined with support and resistance analysis to increase the probability of successful trade setups? Furthermore, when the signal bar in the pattern has a wider range, potentially increasing the trade's risk, what risk management strategies can traders employ to mitigate these risks? Are there instances, such as when the middle bar is an outside bar, where traders need to exercise extra caution when using the three-bar reversal pattern?