 Dedicated FREE FOREX VPS
 Free FOREX Virtual Private Server
 MT4 Demo Contest, Get $500
 Sign Up for an Account, Claim 60% Deposit Bonus
 Free MT4/MT5 VPS 2024
 Send E-mail and Get Free Merchandise
 $1K Refer a Friend Bonus for Pepperstone Pro clients
 Maximize Your Earnings with 100% Deposit bonus
 Trade to Win, $5,000 Monthly Demo Contest
 Claim 30% + 15% Deposit Bonus from LiteFinance
Not many know that price action has hidden secrets. From order absorption to how to trade it with trend lines, learn all about them in this article.
Price Action strategy is a simple way of trading without indicators. Its direct method of making price patterns as signals makes its accuracy unquestionable. However, few believe that the ability to read Price Action is a strategy that is easy to master. That is why unknown Price Action theories become one of the exciting topics to study. The following secrets of Price Action may no longer be "secret" for professional traders, but for beginners, they can add more insights to improve their analysis quality.

1. Order Absorption
So far, many are used to the notion that the more support or resistance line is tested, the stronger it will be. Nevertheless, in the breakout scenario, the opposite happens. Experts believe that the strength of buyers and sellers changes the balance every time the price tests support or resistance. For example, when the price touches a resistance during an uptrend, sellers will enter to take advantage of the opportunity from that key level. However, in the next test, the strength of the incoming sellers is often reduced. So even though the resistance is tested, the momentum is actually getting weaker. This situation is called order absorption. Its main characteristics often appear in the price return to the support or resistance level, which is getting shorter after every retest.
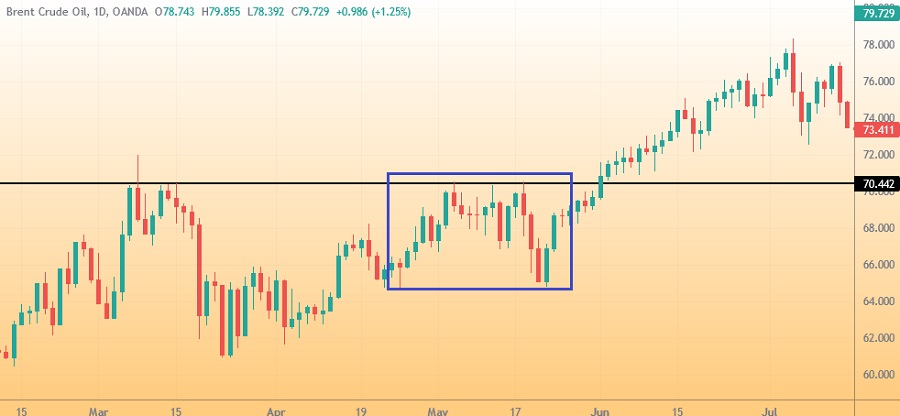
This phenomenon is referred to as the retest distance, which is getting narrower and indicates a breakout. Chart patterns like triangle and cup and handle are based on this order absorption theory.
2. The 5 Phases of Price Movement
It is common knowledge that price movement is divided into an uptrend, downtrend, and sideways. However, it can be broken down further into 5 phases in each direction.
- Trends: Buyers or sellers strongly dominate. If the price continues to rise, it is a rally, bull market, or uptrend. On the other hand, a consistently falling price is called a bear market, sell-off, or downtrend.
- Correction: The opposing side "fights back" in a short term. A correction is a short move against the current trend. During an uptrend, a correction means the price decreases briefly, whereas in a downtrend the term means a slight upward movement.
- Consolidation: Buyers and sellers are balanced (the trend pauses temporarily). The sideways phase is a horizontal price movement within clear support and resistance boundaries. It is essential to remember that the price moves in a corridor during consolidation, and no impulse triggers the start of a trend.
- Breakout: One side (buyer or seller) has managed to overpower the other to end the draw in the consolidation phase. Sooner or later, the balance between the two sides of the market will begin to topple. This change causes a breakout after the price has consolidated. The price will break the support (if the seller wins) or resistance (if the buyer wins) after which it will start a new trend.
- Reversal: The opposing side has succeeded in seizing market dominance. If a correction does not end and moves back to the primary trend or becomes a consolidation phase, the situation will continue to be a reversal. The signs can be seen in the intensity of the correction which continues to increase. Just like a breakout, a reversal also marks the start of a new trend.
3. Focus on Patterns in Key Areas
What do you do if a basic candlestick or chart pattern indicates a reversal or consolidation? Enter the market based on the signal? What many rookies don't know is that it is best to avoid such a move. Focus only on patterns formed in key areas, such as support resistance (SR), supply-demand (SD), overbought/oversold areas, etc. Such areas are considered crucial for good reason. Putting importance on price action around those zones can serve as an ideal confirmation for entry or exit signals. Typically, reversal patterns such as engulfing, pin bar, head and shoulders, and triple bottom have the most prominence around key areas.
4. Don't Stick to Textbook Rules
Why do many novice traders struggle or even fail to trade with price action? One of the reasons actually has to do with their obedience to the so-called textbook rules. Price movements are dynamic so they constantly change all the time. If you only trade on the same pattern as what you are learning, the big players will take advantage of that naivety to trade against you. So, stop looking for perfect patterns when trading with price action. Learn to think and trade like a professional trader; that is, by understanding what goes behind price pattern formations so that you know how to recognize valid patterns even though their shape is not the same as what you initially learned.
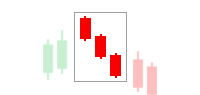
5. Read Candlesticks on Their 4 Elements
Candlesticks are one of the most (if not the most) favorite types of price charts because of their detailed and easy-to-read display. The anatomy of the candlestick itself is simple, but the various ways of its interpretation confuse novice traders when they first learn about it.
The easy way to read candlesticks lies in its 4 elements:
- The shadow's length. The longer the shadow, the higher the uncertainty and volatility.
- The position of the shadow. Longer shadows at the lower part of a candlestick generally signal the market's refusal to continue moving downward. Conversely, a more elongated upper shadow means a rejection to continue a price increase.
- The position of the body. Is the body candle closer to the top or bottom side? Body position closer to the top indicates bullish pressure and vice versa.
- The size of the body. Candles with big-sized bodies and short shadows generally reflect a strong trend. On the other hand, candles with small bodies and long shadows are usually riddled with uncertainties.
6. Broker Server Time is Not That Significant
Often, traders question price differences between brokers' platforms.
"Why does broker A have a bearish candle while broker B does not?"
"How come the candle at broker A has a very long shadow while the candle at broker B does not?"
It is important to note that charts from each broker are not necessarily based on the same server time. Therefore, differences in the price formations are primarily due to the discrepancies in the server time. Brokers with London server time, for example, will, of course, follow the closing price that takes place earlier than the New York server time. Therefore, it's common to find an engulfing pattern in one broker's platform and not find it in another's. Typically, both platforms would each show reversal patterns but in different formations. It can be engulfing and pin bar, morning star and hammer, and so on.
Such conditions are nothing to worry about. Too much comparing charts between brokers will only make your price action analysis more confusing and inconsistent. As a trader, you only need to carefully identify and confirm the price action signals on your trading chart.
See Also:
7. The First Breakout Is Not Always What Matters
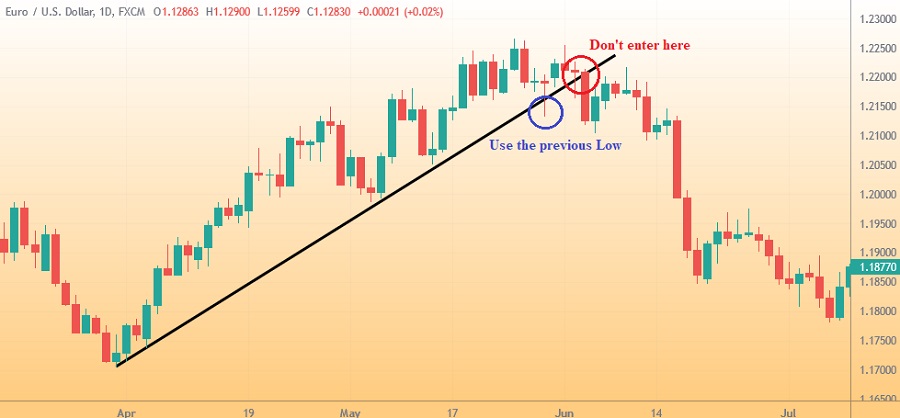
The last price action comes from using trend lines. This tool is one of the most basic and easy-to-understand even for newbies. However, its implementation can be considered tricky because trend line drawing is subjective for each trader. Hence, you should not immediately enter the market after the price breaks a trend line to avoid false breakouts. You also do not have to wait too long for an opportunity from a pullback because there are more realistic recommendations to look for entry spots following a trend line breakout.
In this case, the trick is to wait until the price breaks through the last High or Low. For example, if you see a short opportunity after the price falls through an ascending trend line, wait until the price moves past the previous Low to place an Entry position. The same can also be applied for a bullish signal following a breakout from a descending trend line.
Price action secrets only work if... you are being realistic. That is, do not force signals that are not valid to fit your perspective. Price action analysis primarily relies on understanding to read price movements and make the most of ideal patterns. So, you will be vulnerable to making subjective decisions that can be detrimental if they're not based on a basic understanding of the price action itself.