 Dedicated FREE FOREX VPS
 Free FOREX Virtual Private Server
 MT4 Demo Contest, Get $500
 Sign Up for an Account, Claim 60% Deposit Bonus
 Free MT4/MT5 VPS 2024
 Send E-mail and Get Free Merchandise
 $1K Refer a Friend Bonus for Pepperstone Pro clients
 Maximize Your Earnings with 100% Deposit bonus
 Trade to Win, $5,000 Monthly Demo Contest
 Claim 30% + 15% Deposit Bonus from LiteFinance
Price action traders usually rely on the price chart when making important market decisions. What are the best indicators that can help validate price action signals?
A price action indicator is a trading tool that allows you to analyze the price movement of an asset over time. This can be used for any type of financial asset such as currency pairs, commodities, indices, and stocks. Price action indicators are especially used by short-term traders who rely on the predictions by these indicators in order to place their positions.
Many price action indicators use unique characteristics in order to stand out when placed on top of a chart. This makes it easier for traders to understand what the indicator is predicting. There are plenty of price action indicators on the market so it's really important to use one that works best with your trading strategy.
With numerous price action indicators on the market, it is important to know which has the most success in order to prevent making any losses due to falsely reading price action signals. It is also important to know that what may work for someone else's indicator may not work that great for you. Here are some top price action indicators that have the most success rates among traders worldwide:
Moving Averages
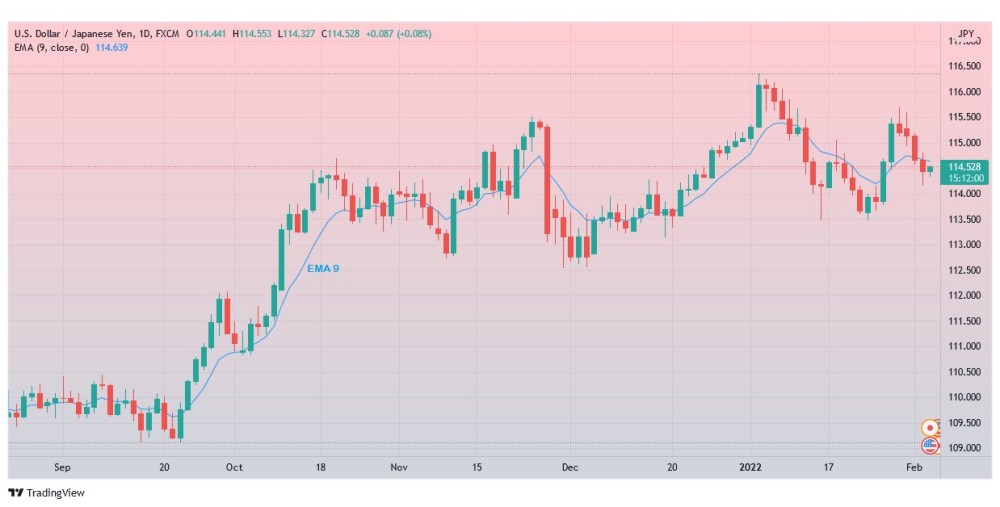
Moving averages are lagging price action indicators that are used to identify price trends in the market. There are three types of moving averages: Simple Moving Average (SMA), Exponential Moving Average (EMA), and Weighted Moving Average.
Simple Moving Average takes into account the market over a long period of time whereas both Exponential Moving Average and Weighted Moving Average focus on the current market prices. Exponential Moving Average is generally the most popular type of moving average as it is said to be the most accurate among traders.
Bollinger Bands
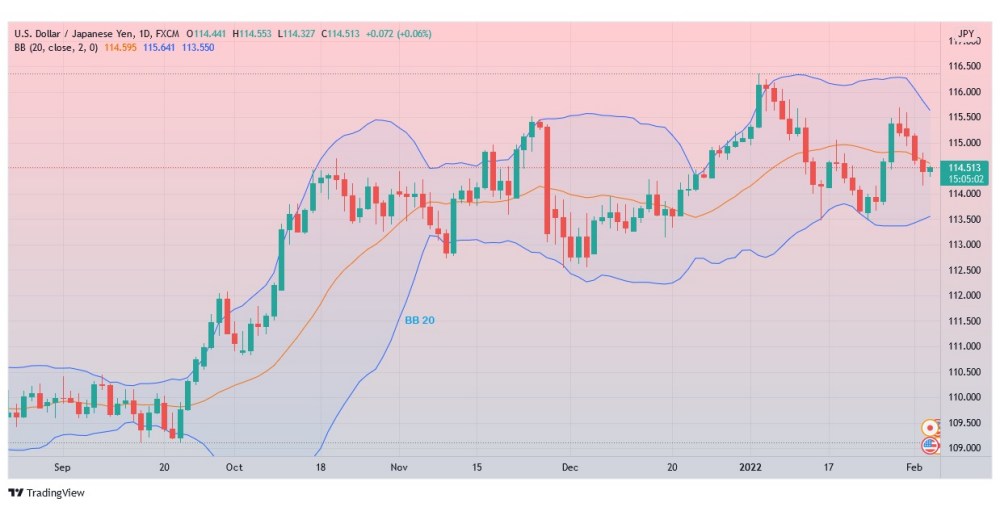
Bollinger Bands is a type of price action indicator that focuses on the volatility of price movements. This method first came into existence in the 1980s by founder John Bollinger who named the indicator after himself. This method can be used on any type of financial instruments such as currency pairs, stocks, and commodities.
This indicator displays three lines or bands. The top and bottom lines are standard deviations of about +/- 2 while the middle line follows a 20-day Simple Moving Average. If the price becomes volatile, the bands will expand to signify this. Similarly, if the price reduces in volatility, the bands would compress as well.
Price Volume Trend
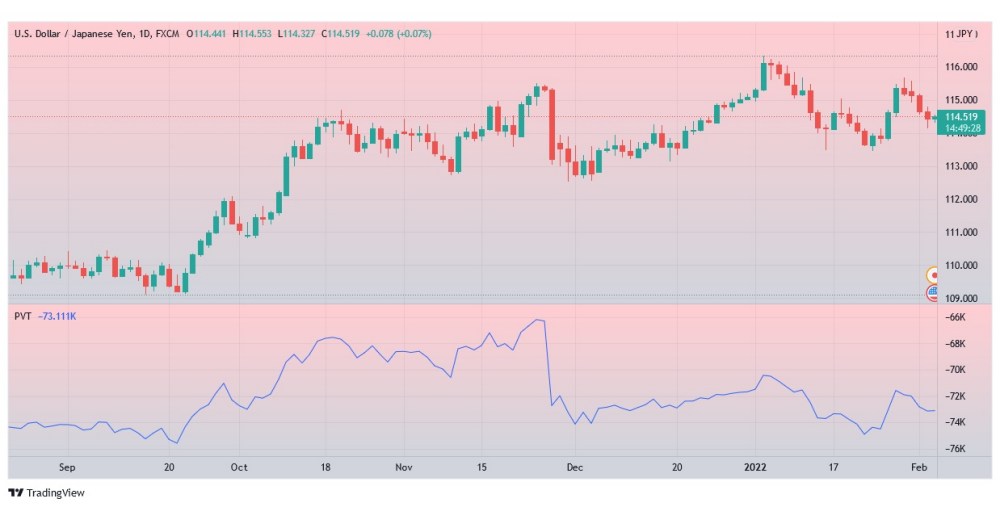
A price volume trend indicator analyzes an asset's demand and supply in order to predict the movement in its price. If something is in high demand but low in supply, it is likely that it will increase in market value. Similarly, if something is in low demand but high in supply, the market value of that asset will fall significantly. This indicator would measure the percentage change in price in order to determine the supply and demand of a particular asset. The volume is used to determine what is causing the price to move in a particular direction.
EndNote
The use of price action indicators can simplify price information, confirm trend signals, and provide notifications on reversals. Not only the three indicators above work on almost any time frame, but you can also tweak the period according to your trading preferences. Furthermore, traders have the freedom to combine those indicators with other indicators in order to be able to get accurate exit and entry signals.
Experimenting with the appropriate indicators can be a tricky process. So, don't forget to use a demo account to test strategies and price action indicators before applying them to the real market.


2 Comments
Fendy
Jan 26 2024
Hey, I'm a beginner in this field, and I've been thinking about the price action indicators mentioned in the article. I've got a grasp on moving averages and Bollinger Bands because they're widely discussed in various articles. However, the concept of the price volume trend is a bit unclear to me. The article mentions that this indicator analyzes the demand and supply of an asset to predict its price movement. If something is in high demand but low in supply, it's likely to increase in market value, and vice versa. I'm curious about why the dynamics of supply and demand work this way. Could someone provide examples to help me understand better?
Sammy
Feb 1 2024
Let me explain to you with example!
Imagine Company X has just released a groundbreaking product, and there's a significant buzz in the market about its potential success. Investors, anticipating high demand for Company X's stock, start buying shares. This surge in buying activity (demand) leads to an increase in trading volume. As more people want to buy the stock than sell it, the price starts to rise.
Now, let's take Company Y, which has been facing financial difficulties, and there's pessimism in the market regarding its future. Investors, worried about the company's prospects, start selling their shares. The increased selling activity (supply) results in higher trading volume, but this time in the sell direction. With more shares available for sale than there are buyers, the stock price experiences a decline.
In these examples, the price volume trend indicator would pick up on the correlation between the price movements and the corresponding trading volumes. It helps investors analyze whether a price trend is backed by substantial demand or supply, providing insights into potential future movements.
Hope it can help!