 Dedicated FREE FOREX VPS
 Free FOREX Virtual Private Server
 MT4 Demo Contest, Get $500
 Sign Up for an Account, Claim 60% Deposit Bonus
 Free MT4/MT5 VPS 2024
 Send E-mail and Get Free Merchandise
 $1K Refer a Friend Bonus for Pepperstone Pro clients
 Maximize Your Earnings with 100% Deposit bonus
 Trade to Win, $5,000 Monthly Demo Contest
 Claim 30% + 15% Deposit Bonus from LiteFinance
Have you ever heard of the Stochastic indicator? Let's learn the basics and how to read its various signals to help your trading analysis.
Stochastic is an oscillator indicator first introduced by George Lane in the late 1950s. It is known as one of the earliest indicators that were used to predict the direction of future price movements. George started from the idea that when the market is in an uptrend, the prices will tend to move higher or the same as the closing price in the previous period, while a downtrend is when the price tends to move lower or the same as the closing price in the previous period.
Using a scale to measure the magnitude of the change between closing prices in one period to the next, the Stochastic indicator can provide predictions of possible price movements in the direction of the ongoing trend.
In short, Stochastic can be effectively used to:
- Identify crossover signals.
- Help traders with divergence analysis.
- Detect overbought and oversold conditions.
Now, let's discuss how to use Stochastic for each of the functions above.
How to Use the Stochastic Indicator for Analysis
The following are the main uses of the Stochastic indicator in forex trading:
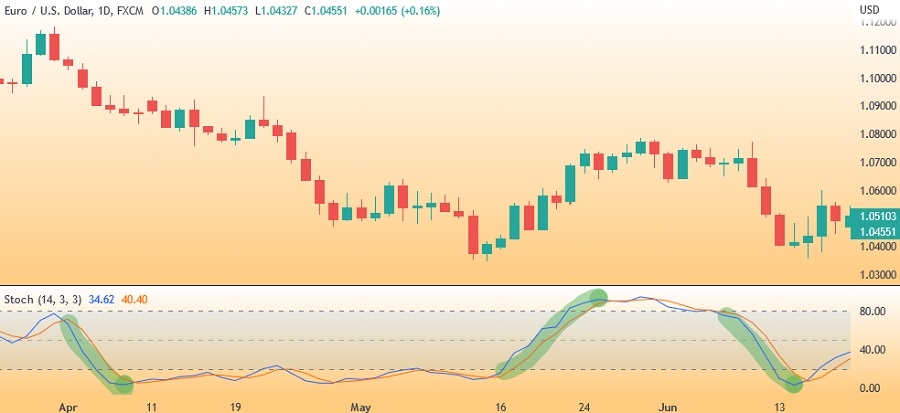
Crossovers
A crossover occurs when the %K line and the %D line intersect each other.
To use a crossover, here are some rules that you need to remember:
- If the %K line cuts the %D line from below, it means that it's a bullish sign.
- If the %K line cuts the %D line from above, it means that it's a bearish sign.
Divergence
Divergence refers to the gap that occurs between the %K and the %D. This might occur because the %K line generally moves faster than the %D, so the gap shows the trend's strength. The wider the gap, the stronger the trend. So if the two lines are moving towards each other and the gap is very narrow, it means that the current trend is weak. This can also be a signal that the trend might reverse soon.
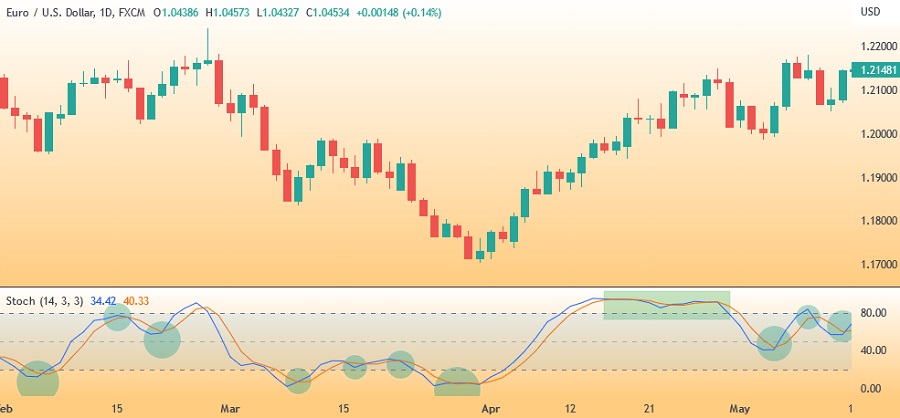
Overbought and Oversold Condition
An overbought condition is indicated when the %K reading is above 80. This condition can also be interpreted as a Sell signal. Conversely, an oversold condition is indicated when the %K is below 20. This condition can also be interpreted as a Buy signal.
Stochastic Components
A Stochastic indicator consists of two main lines:
- The %K line measures the current rate of price changes. It compares the highest high and the lowest low of a given period, then presents the last closing price as a percentage of this range.
- The %D line is the Moving Average of %K. It is also known as the signal line or the smoothed %K.
The value of %K is calculated with the following formulas:
%K (N) = 100 x (CP – LP) / (HP – LP)
- CP is the most recent closing price of N period
- LP is the lowest price in the last N period
- HP is the highest price in the last N period
You can use any number of periods you want, but George Lane recommends 14 as the standard. Other than that, 21 and 9 are also commonly used among traders.
Meanwhile, %D is calculated with this formula:
%D (N) = Simple Moving Average of %K in N period
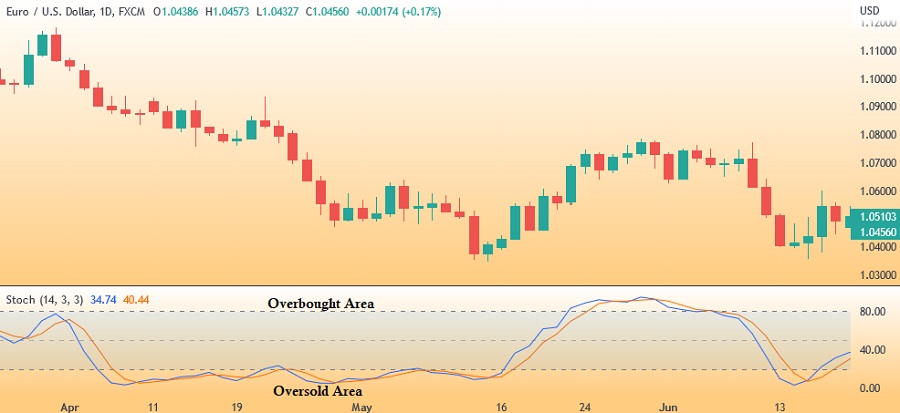
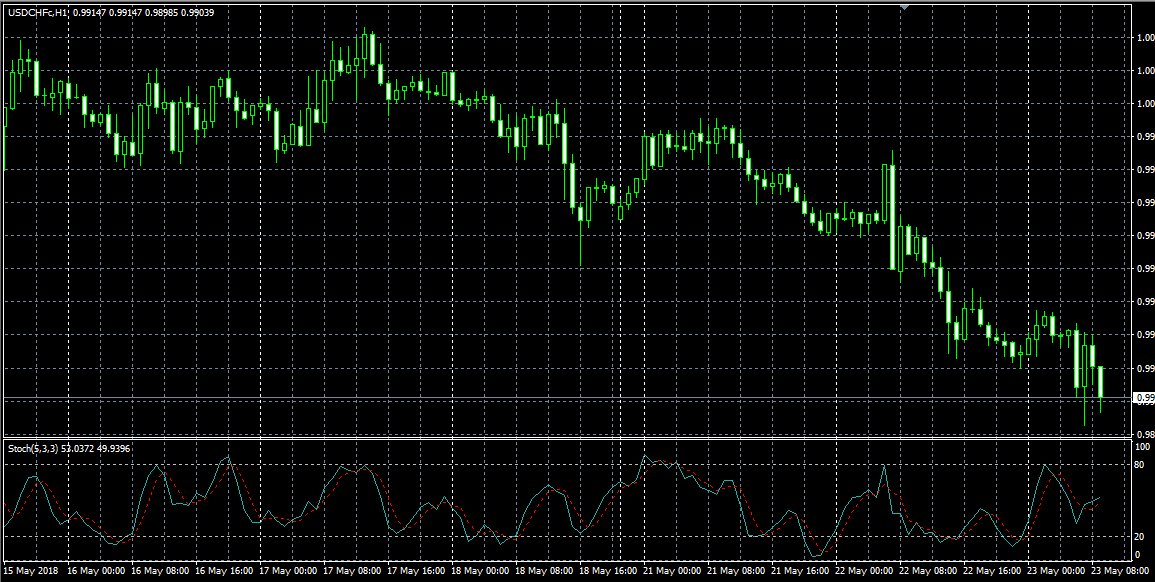
%D is also known as the Slow Stochastic because it reacts more slowly to the price movements, while %K is commonly referred to as the Fast Stochastic. The combination of %K and %D is called Full Stochastic. Let's take a look at the image below. The orange line refers to the value of %D, while the blue line refers to the value of %K.
How to Install the Stochastic Indicator
Installing Stochastic is pretty easy as you don't need to calculate or draw manually. Most trading platforms like MetaTrader include Stochastic in their indicators line-up. You need to click "Insert" and "Indicators", then click "Oscillators" and choose "Stochastic Oscillator".
After that, you'll see the default settings of the indicator as shown in the image below.
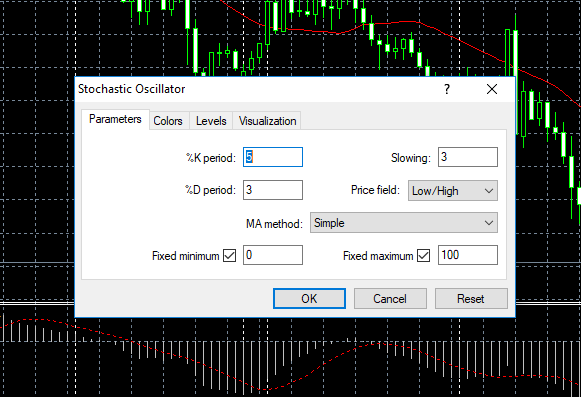
You can click "OK" to continue with the default settings or make changes and customize the indicator according to your needs and preferences. Once you're finished, click "OK".
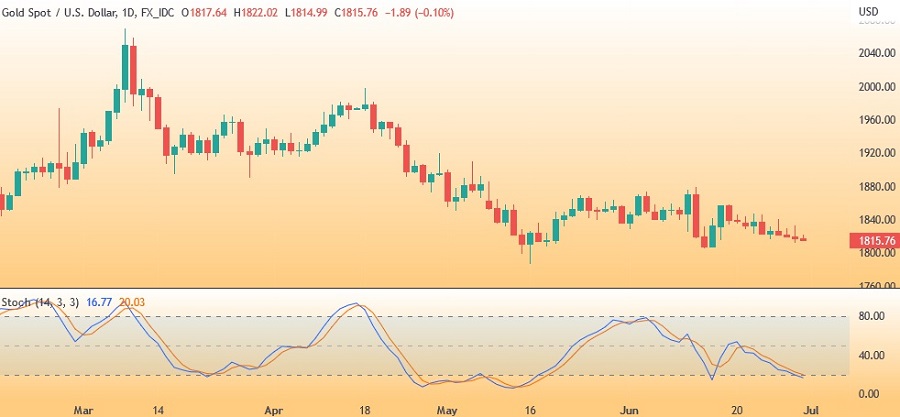
The platform will automatically apply the indicator on the chart and appear at the bottom of the screen. Take a look at an example below.
It's worth mentioning that you can customize your Stochastic even after it is installed on the chart. For example, if the lines are difficult to read, you can change the color or type. Alternatively, you can use charting service providers like TradingView to help set up the indicator and improve its readability.
Trading with a Stochastic indicator may sound simple at a glance. Still, in reality, it takes practice to be able to actually take full advantage of the indicator and consistently gain significant profit in the long term. Additionally, combining Stochastic with other indicators is highly recommended to minimize the chance of getting false signals. It would also be useful if you analyze multiple time frames to understand the market condition as a whole better.


1 Comment
George mwangi
Sep 30 2022
Thanks for the insight