 Dedicated FREE FOREX VPS
 Free FOREX Virtual Private Server
 MT4 Demo Contest, Get $500
 Sign Up for an Account, Claim 60% Deposit Bonus
 Free MT4/MT5 VPS 2024
 Send E-mail and Get Free Merchandise
 $1K Refer a Friend Bonus for Pepperstone Pro clients
 Maximize Your Earnings with 100% Deposit bonus
 Trade to Win, $5,000 Monthly Demo Contest
 Claim 30% + 15% Deposit Bonus from LiteFinance
Anyone can use Fibonacci in financial trading as long as you know how to draw Fibonacci Retracement and learn how to trade with it.
Fibonacci is a series of numbers that are often used in various fields, including trading in financial markets (forex, stocks, cryptos, and so on). Where did Fibonacci come from and how do you use Fibonacci analysis in financial trading? This article will help you learn how to use Fibonacci, starting from drawing the lines up to identifying buy/sell signals.
The Origin of Fibonacci
The Fibonacci series of numbers was described by Leonardo Pisano (1175-1250), an Italian mathematician, in his book "Liber Abaci" or Book of Calculation. The French historian, Guillaume Libri, nicknamed him "Fibonacci" - short for "filius Bonacci" ("son of Bonacci") - because his father's name was Guglielmo Bonacci. This name later became so well-known that people called him Leonardo Fibonacci, and that is also the reason why "Fibonacci" is used as the title for the numbers he describes.
The Fibonacci numbers themselves were not actually discovered by Leonardo "Fibonacci" Pisano, but have long been discussed by Indian mathematicians, especially in connection with the Sanskrit prose system. However, Leonardo was the first to introduce this series of numbers in the book "Liber Abaci" to the Western world; along with the arithmetic systems we know today, such as the concepts of blanks, commas, decimals, and fractions.
Fibonacci Numbers and the Concept of Golden Ratio
In "Liber Abaci", Leonardo Pisano describes a series of numbers where each number after 0 and 1 is the sum of the two previous numbers. So, the series consists of: 0, 1, 1, 2, 3, 5, 8, 13, 21, 34, 55, 89, 144, 233, 377, 610, and so on to infinity. In the Fibonacci number series, each number is approximately 1,618 times larger than the previous number.
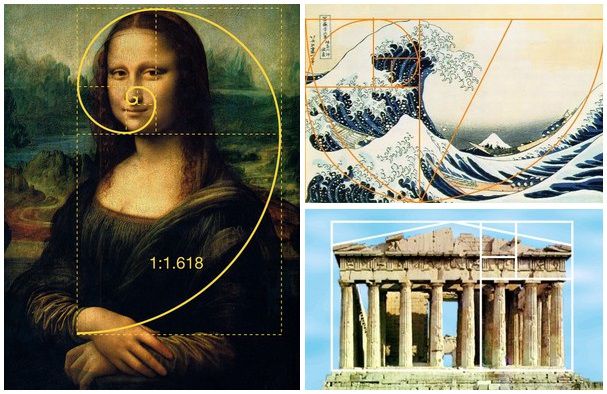
In mathematics, the number 1.618 is also called Phi, or the Golden Ratio; while the opposite is 0.618. The Golden Ratio is said to appear mysteriously in the structure of natural phenomena, architectural and artistic masterpieces, as well as in the biological sciences. Among them are Leonardo Da Vinci's Mona Lisa painting, Katsushika Hokusai's The Great Wave Off Kanagawa, the Parthenon (Greece) temple, sunflowers, snail shells, human faces, and even the circle of galaxies in outer space. Many artists consider the Golden Ratio to represent a certain harmony that causes something to be seen as beautiful.
In financial trading, we don't use Fibonacci numbers as it is but based on the distance between the numbers in the series. For example, dividing 89 in the Fibonacci sequence by the following 144 will result in 0.6180 (61.8%). Furthermore, if the number 89 is divided by the second number after it in the Fibonacci sequence, it will come out as 0.3819 (38.2%), and so on.
Based on these rules, we acquire Fibonacci Retracement levels and Fibonacci Extension levels which can surprisingly explain price movements when applied to the price chart. Therefore, Fibonacci is also used in forex trading as a technical analysis tool.
Fibonacci in Financial Trading
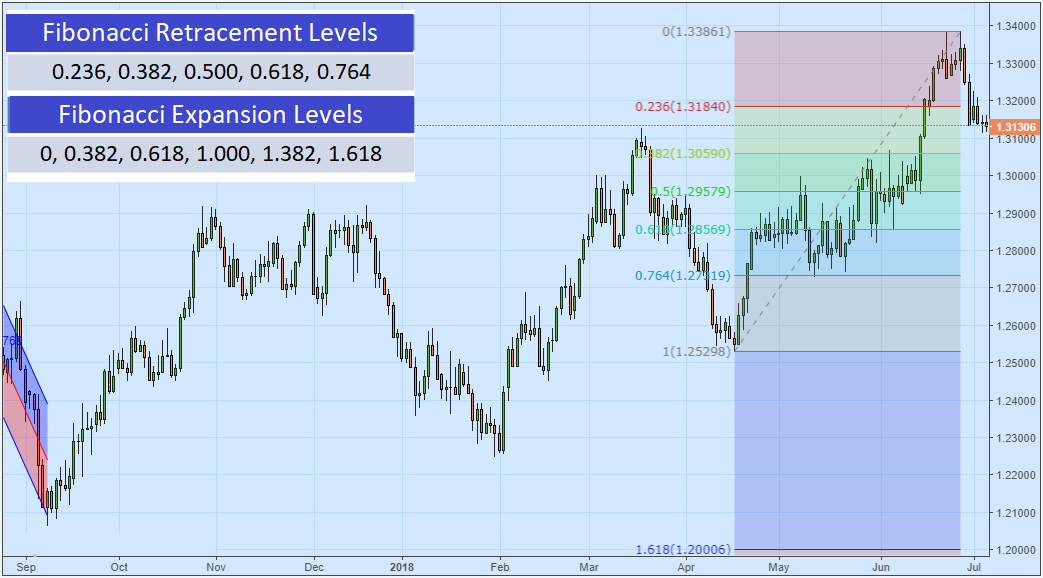
Financial traders and investors mainly apply Fibonacci Retracement and Extension. There are also variations such as Fibonacci Expansion, Fibonacci Fan, and so on, but beginners should first understand how to use Fibonacci Retracement.
The Fibonacci Retracement and Extension consist of levels calculated from the distance between the numbers in the previously described series, plus 50.0% (0.500). Although 0.500 is not based on Fibonacci numbers, this level is considered a phase with fairly high potential for price reversal in Dow Theory and the works of renowned technical expert WD Gann.
Look at the chart below. Keep in mind how price reversals and Fibonacci Retracement levels line up. It may be difficult to explain scientifically, but it is real. Because of that, a lot of people employ Fibonacci analysis to trade forex, cryptos, and stocks.
How to Draw Fibonacci Retracement?
To draw Fibonacci Retracement, we have to mark the highest price point (High) or the lowest price (Low) on the chart within a certain time period. It seems easy, but it is actually highly dependent on your sensitivity and trading setup. For example, in the price chart below, you can see several highs and lows at a glance. But, where are we going to draw Fibonacci Retracement?
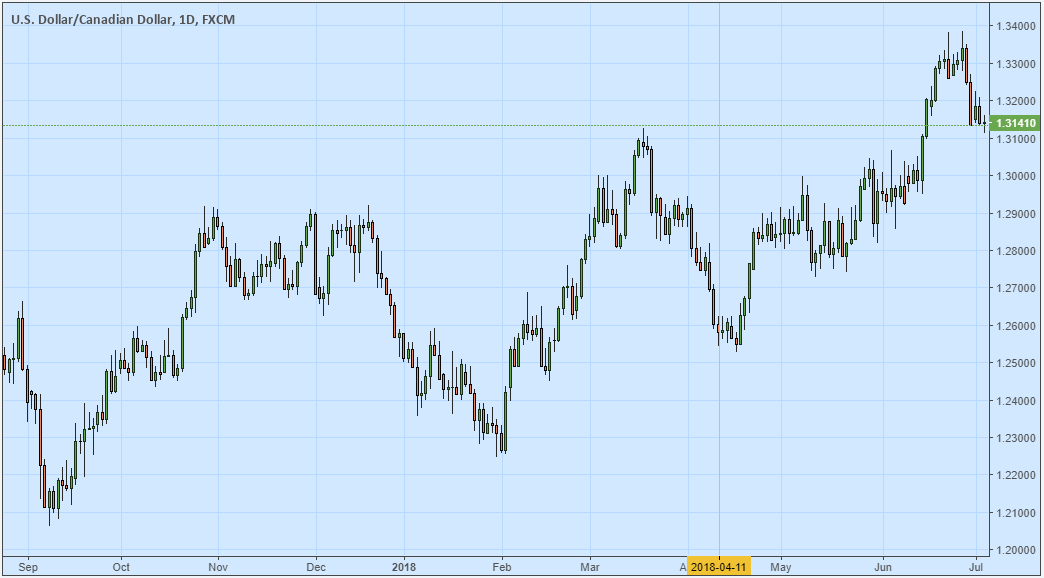
To draw Fibonacci Retracement, we can limit it to the length of the last few candles. For example, the last 60 candles are marked with a gold vertical line in the chart. Thus, we only need to take into account the highs and lows of the last 60 candles on the rightmost side of the chart.
Then look for a tool in your trading platform that can draw Fibonacci Retracement. It can usually be found on the menu bar. If you use the Metatrader platform, you can find it on the Insert menu >>> Indicators >>> Fibonacci >>> Retracements. Drag your cursor from left to right. Click on the High or Low on the left side of the chart, then click on the High or Low on the right side of the chart.
Please take note: the correct path to draw Fibonacci Retracement is from left to right; so the retracement direction can be either from top to bottom (Downtrend) or from bottom to top (Uptrend). Here is the result:
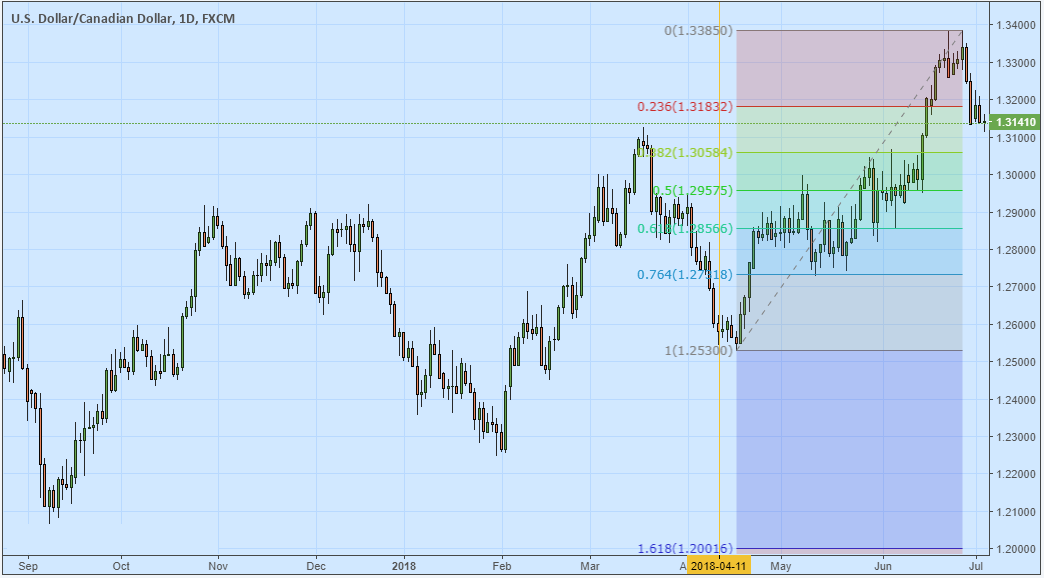 USD/CAD Daily chart with Fibonacci Retracement during an uptrend
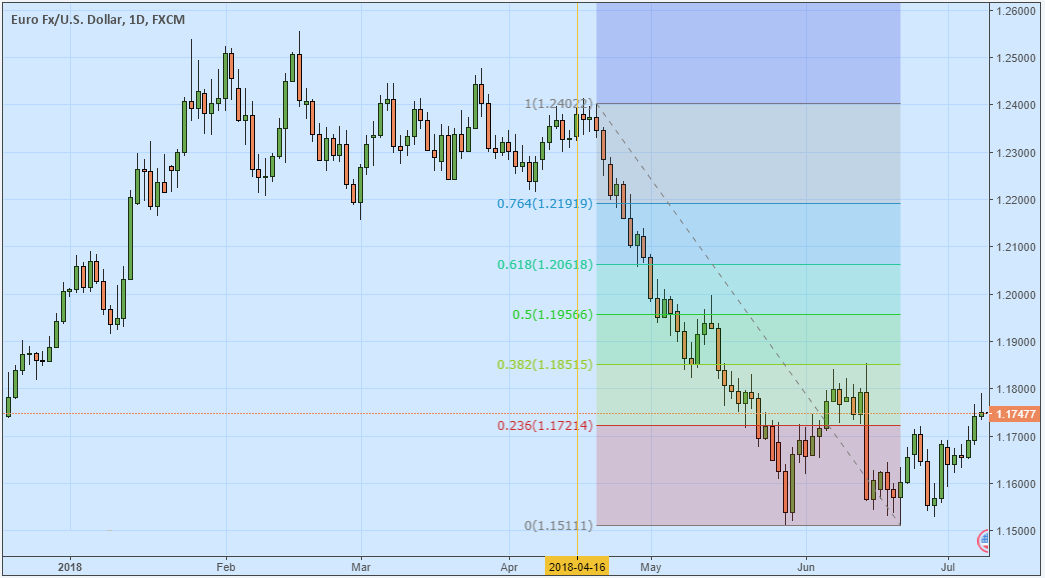 EUR/USD Daily chart with Fibonacci Retracement during a downtrend
How to Trade Using Fibonacci Retracements?
Fibonacci Retracements can be used to identify Support and Resistance levels. We can also combine it with technical indicators to spot trading opportunities and determine entry/exit levels. One simple and popular strategy combines Fibonacci Retracements with a trend-based trading strategy. Here are the details:
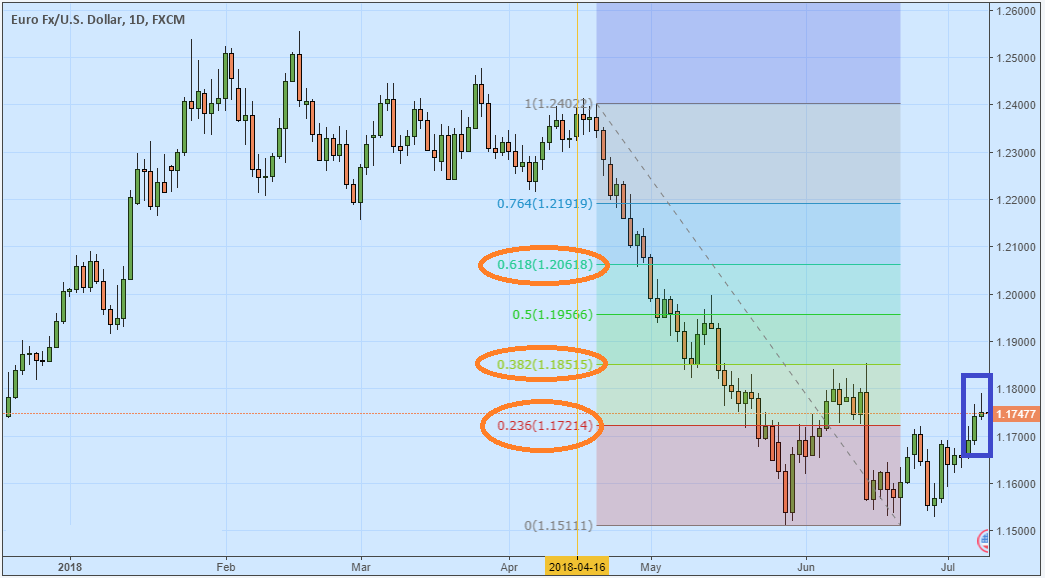
- Identify where prices move. For example in the picture above, it seems that prices are going down (bearish). In this situation, traders will look for opportunities to sell when prices temporarily retrace higher.
- Mark the horizontal lines where Fibonacci Retracement 23.6% (0.236), 38.2% (0.382), and 61.8% (0.618) are located. These lines are used to identify levels where prices are more likely to reverse.
- Observe close prices on the candle that represents price movements near the aforementioned Retracement levels. When prices have risen up to Fibonacci levels of 0.236, 0.382, or 0.618, take note of where the next candle closes.
If there is a candle that closes below a certain Fibonacci level; then prices may go down again, at least until the next Fibonacci Retracement level. We can open short positions as long as there is confirmation from other supporting technical indicators.
If there is a candle that closes above a certain Fibonacci level; it means prices will continue to rise. However, because the trend is generally still bearish, it is not recommended to buy unless there are other technical indicators that signal a significant trend reversal.
Fibonacci role in financial trading mainly marks important Support and Resistance levels. Therefore, although Fibonacci Retracement levels can "magically" pin important moments in historical price charts, the actual use of Fibonacci must be complemented with technical indicators (eg. Moving Average) or candlestick patterns.