 Dedicated FREE FOREX VPS
 Free FOREX Virtual Private Server
 MT4 Demo Contest, Get $500
 Sign Up for an Account, Claim 60% Deposit Bonus
 Free MT4/MT5 VPS 2024
 Send E-mail and Get Free Merchandise
 $1K Refer a Friend Bonus for Pepperstone Pro clients
 Maximize Your Earnings with 100% Deposit bonus
 Trade to Win, $5,000 Monthly Demo Contest
 Claim 30% + 15% Deposit Bonus from LiteFinance
We can get the best RSI settings for 15 min chart by lowering the periods. Here is the rationale behind it.
Relative Strength Index (RSI) is one of the most popular trading indicators among forex, stock, and crypto traders. Some scalpers and day traders dislike it because RSI generates fewer trading signals in lower timeframes. However, we can rearrange RSI settings to make them more suitable for short-term trading.
The article will first explain how RSI works, and then help you determine the best RSI settings for 15 15-minute chart. You can also learn how to adjust it for higher timeframes.
How Does the RSI Indicator Work?
The calculation of RSI begins with a comparison of average gains and losses for the periods you specify. Here's what it looks like:
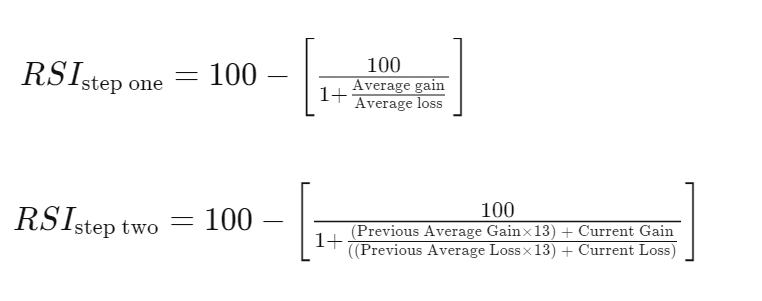
Confused? Worry not, we will examine it using a beginner-friendly example below.
Let's say, you want to use the RSI with the most common default period: 14. You will then calculate the average gains and average losses during the last 14 candles. Compare them, then plot the result as numbers between 0 and 100 on the charts.
If the gains outweigh the losses for the designated period, the RSI will climb. Otherwise, the RSI will drop.
What if the gains and losses are equal? In that case, the RSI will straighten for the designated period.
Such a conclusion holds in most circumstances. Therefore, when the RSI increases continuously until it enters zone 70 or 80, people will say that prices are overbought. Conversely, when the RSI decreases continuously until it enters zone 30 or 20, people will say that prices are oversold.
However, it's not always going to be accurate. Why? Because the designated periods (in this example, 14) limit the effectiveness of the RSI to examine price changes. Consider this:
- On the 5-minute chart, the RSI indicates changes in historical prices from the last 70 minutes (5x14).
- On the 15-minute chart, the RSI indicates changes in historical prices from the last 3.5 hours.
- On the 30-minute chart, the RSI indicates changes in historical prices from the last 7 hours.
- On the 60-minute chart, the RSI indicates changes in historical prices from the last 14 hours.
- On the daily chart, the RSI indicates changes in historical prices from the last 14 days.
- On the weekly chart, the RSI indicates changes in historical prices from the last 14 weeks.
- On the monthly chart, the RSI indicates changes in historical prices from the last 14 months.
Then, the questions are:
- Do we need to consider changes as far back as 3.5 hours ago to scalp on a 15-minute chart? That seems excessive. Also, you will see fewer buy and sell signals from RSI 14 in lower timeframes.
- Are 14 months of historical prices enough to measure a long-term trend and trade a monthly chart? It is insufficient. Furthermore, its overbought and oversold areas will almost certainly be incorrect over longer periods.
In conclusion, the default RSI period of 14 is not always accurate. We have to adjust RSI settings following our preferred timeframe and trading style.
Overbought and Oversold in RSI Indicator
RSI measures the strength of price movements by comparing price increases with price decreases over a certain period. The RSI indicator is often used to identify market conditions that are overbought or oversold. However, you need to remember that the overbought and oversold signals on this indicator will only be valid when the market is in sideways conditions.
To make it easier to understand the RSI indicator in reading overbought and oversold signals on the RSI indicator, please see the explanation below.
Overbought
When the RSI is above the 70 level, it indicates that the asset may have experienced a too-rapid price increase and is in the overbought area. Traders often see this condition as a potential signal to take profits or even consider selling the asset due to the potential for a price reversal or correction.
Oversold
Conversely, when the RSI is below the 30 level, it indicates that the asset may have experienced a significant price decline and is in the oversold area. This condition can be considered as a potential signal to buy the asset because there is a possibility of an upward price reversal or upward correction.
How to Determine the Best RSI Settings for 15-Min Chart?
We can adjust RSI settings by lowering the periods for trading in lower timeframes or increasing the periods to trade in higher timeframes. Generally, here's how experienced traders do it:
- Periods between 9 and 11 are favored by day traders and scalpers, including those who trade in 5 min, 15 min charts, and so on up to hourly timeframes.
- The default RSI setting of 14 is widely used by medium-term swing traders.
- Periods between 20 and 30 are chosen by long-term traders and investors.
So, what are the best RSI settings for 15 15-minute chart? Take your pick in the range of 9-11. Combine it with other indicators used in your trading strategy, then try them out on a demo account.
Below is a comparison between default RSI settings (14) and adjusted RSI settings (9) on the EUR/USD 15-minute chart. See how the RSI indicator shows overbought and oversold more decisively when set at 9.
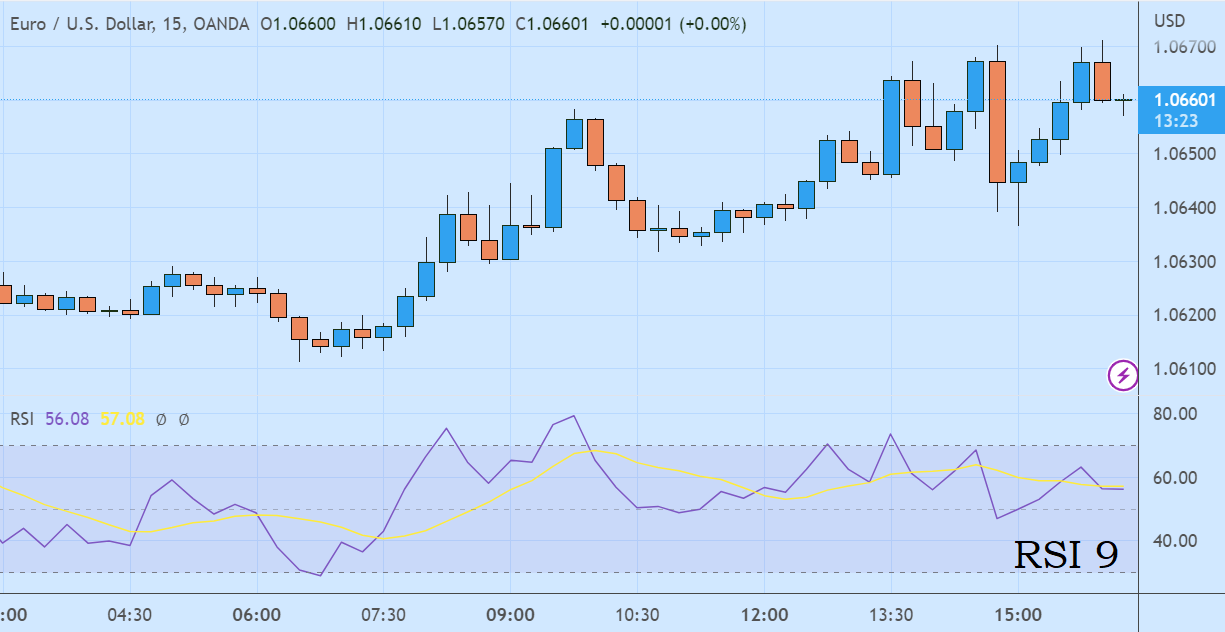
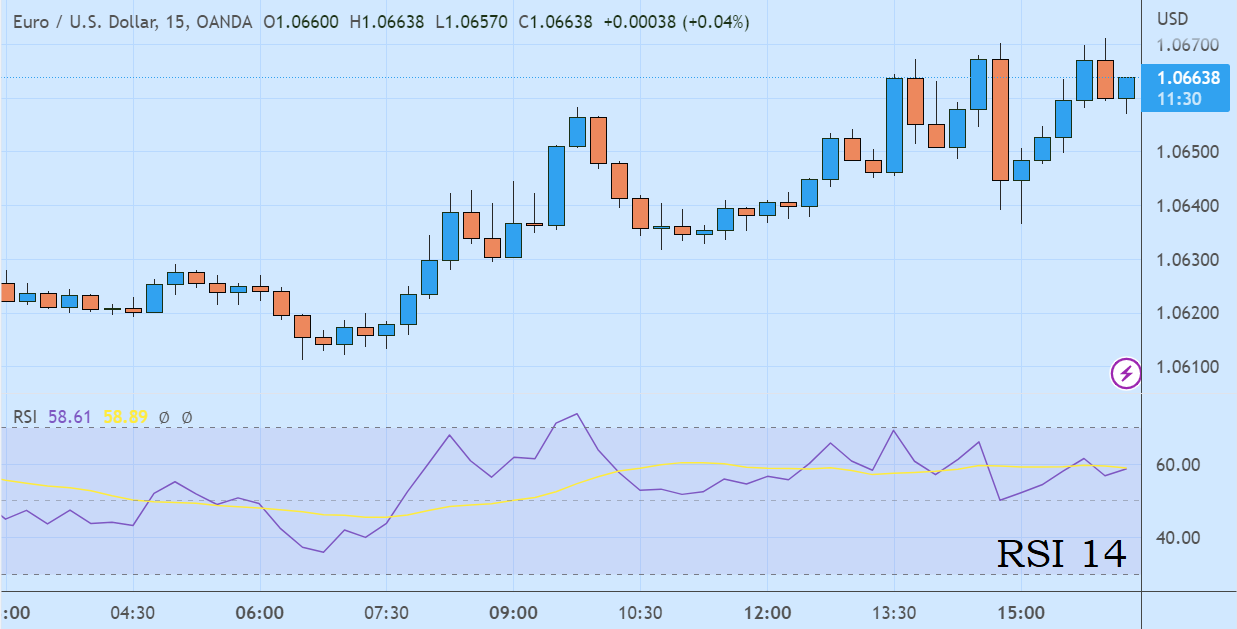
The best RSI settings should have less noise, along with more frequent and reliable signals. Nevertheless, keep in mind that no matter which period and what indicator you use, there will be a certain degree of error. Always be prepared to handle unexpected situations by improving your risk management skills.


2 Comments
Hendra
Jan 13 2024
Hey man, using RSI seems kinda straightforward, but it's also a bit sketchy, you know? I mean, just like the article mentions, when RSI goes above 70, it's screaming that the asset might have shot up too fast and is in the overbought zone. Traders often take it as a sign to grab their profits or even think about selling because there's a chance the price might flip or correct.
And then there's the flip side – when RSI dips below 30, it's shouting "oversold." But here's the thing, is the market always playing by these rules? Is it like a strict code where overbought means it's time to sell, and oversold means it's time to buy? Or is it just one of those things that work most of the time, but not always? Curious to hear your take on this!
Jorge
Jan 15 2024
Hello! Let's view RSI as a reliable instrument, not a magical wand. It's a single puzzle piece, not the entire picture. Trading is a blend of art and science, demanding adaptability. Keep a close watch on RSI, but also trust your instincts because the market is quite the rollercoaster.
To illustrate, think of RSI as your trading buddy, but it's wise to build a team. Incorporating additional indicators is akin to assembling a squad to cover all angles.
Consider adding Moving Averages—they iron out erratic price swings, aiding in trend identification. If RSI is screaming "overbought," but your Moving Averages are holding steady, it could be just a short-lived excitement. (Moving Average: The Essential Tool for Trading)
Also you can combine with Bollinger Bands too! Bollinger Bands are like the bodyguards of trading indicators. They wrap around the price chart and can reveal when an asset is feeling squeezed. If RSI is going wild but your Bollinger Bands are chill, it could be a false alarm. (read : Bollinger Bands and RSI Combo Strategy)