Dedicated FREE FOREX VPS
 Free FOREX Virtual Private Server
 MT4 Demo Contest, Get $500
 Sign Up for an Account, Claim 60% Deposit Bonus
 Free MT4/MT5 VPS 2024
 Send E-mail and Get Free Merchandise
 $1K Refer a Friend Bonus for Pepperstone Pro clients
 Maximize Your Earnings with 100% Deposit bonus
 Trade to Win, $5,000 Monthly Demo Contest
 Claim 30% + 15% Deposit Bonus from LiteFinance
Without using any technical indicator, pure price action traders can determine their entry and exit points and make profits with their trades. How so?
The price of a financial asset is essential for trading because the shift in the prices can result in profit or loss. Understanding the market means understanding the price movements – what it means and what causes them to happen.
This is why price action is one of financial markets' most commonly used trading strategies. Whether you are a short-term or a long-term trader, analyzing the price of an asset is perhaps the simplest, yet most powerful way to get a grip on the market.
But is it possible to solely trade based on pure price action analysis?
The Definition of Pure Price Action Trading
Price action refers to the characteristics of a certain asset's movements. It is basically the action of the price of an asset. Such price movements are often analyzed with respect to price changes that occurred in the past.
Meanwhile, trading with price action means reading the market and predicting future movements based on recent and actual price movements.
Rather than relying on technical indicators, price action traders focus on raw charts with nothing but candlestick price bars. This is why the method is often called pure price action strategy or naked trading. Experienced traders can sometimes even spot the signals at a glance by identifying certain shapes or patterns on the price chart.
The Three Pillars of Price Action Trading
Price action can be used for both short-term as well as long-term traders. It is also suitable in basically any financial market. While the price action itself is the most important aspect of the strategy, there are three key pillars that every price action trader must take into consideration:
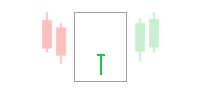
1. Candlesticks
Candlesticks are highly versatile, so they can contain much more information than other charts. This will help you understand the market and can be used to predict future market behavior.
A single candle is composed of the asset's high, low, open, and close prices. This represents a lot of things related to the market sentiment at the moment.
You can also look for candlestick patterns, which consist of one or more specific candlestick formations. These patterns may display several signals such as continuation, reversal, as well as consolidation.
2. Trends
The second thing to think about is the trend of the chart. Trends refer to the direction of where the price of an asset is currently heading. This is highly related to the future prices and how much risk the trade may have. There are three main trends that every trader must know, namely bullish, bearish, and sideways.
- A bullish trend shows that the price is currently rising by making higher highs and higher lows.
- A bearish trend shows that the price is going downward, comprising lower highs and lower lows.
- Meanwhile, a sideways trend shows that price is ranging because neither the buyer nor seller is in control of the market.
3. Support and Resistance Levels
The last aspect you need to pay attention to is support and resistance levels, which can be highlighted by horizontal or angled lines called trend lines. These lines are created by connecting the highs and lows during a trend and then extending that line to the right to see where the price might find support or resistance in the future.
Support and resistance levels are also psychological areas that may impact the price due to market memory and psychology.
- The support level is where the buyers have won the battle and pushed the markets higher after a price drop
- Whereas the resistance level is where the sellers have taken over the market and pushed the price lower after a rise.
Knowing how to spot these levels will help you determine your potential entry and perhaps exit point as well. Generally, you would want to buy near the support level and sell near the resistance level. However, there's no telling whether these levels will hold up or not, so consider waiting for a confirmation signal before entering the market.
How Do You Trade with Price Action
Since you are trading with raw price charts and no indicator, then you need to be able to "read" the market well. In the pure price action strategy, there are at least three zones that you should be able to identify, namely dead zones, red zones, and end zones. Let's learn about each one and how to spot them.
The Dead Zone
The dead zone refers to the area where the price action is going sideways, not making any highs or lows. This indicates that the buyers and sellers are at a standoff and that no one is winning the battle.
As a result, trading in this condition will only give you mediocre results. If you're searching for a big opportunity, you must avoid this zone. It's better to wait for a better chance and win big.
Here's what a dead zone looks like on the chart.
As you can see, the price only makes small movements because the buyers and sellers have the same strength. In other words, none of them can overthrow the other.
This situation will keep going until either the seller or the buyer wins. While this may be a great opportunity for scalpers, such small movements may not matter much for medium and long-term traders.
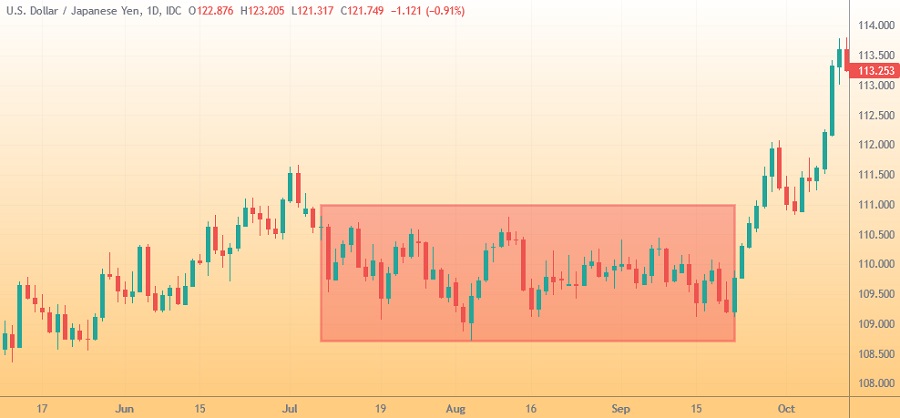
The Red Zone
Derived from the term in American football, the red zone is the area between the 20-yard and goal lines. It means that this is the spot where all the actions and big movement happens – the complete opposite of the plain and boring dead zone. Along with the big movements, red zones also present big opportunities to earn huge returns with price action trading.
Here's what a red zone would look like on the chart.
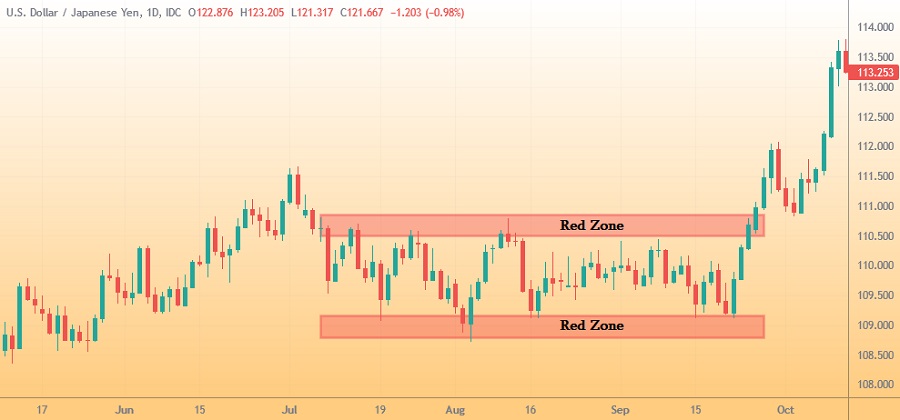
Spotting a red zone is rather easy. You have to find a dead zone and then draw a red zone rectangle above the resistance level and below the support level. The width of the rectangle can range from 10 to 20 pips wide.
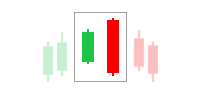
Now that you understand how to identify the zone, let's learn how to actually use it. Basically, if the price hits the upper red zone and continues to the upside, then it would be great timing to open a buy trade because it indicates that the price is going in an uptrend.
Meanwhile, if the price hits the lower red zone and continues to the downside, then it means that the sellers are taking over, so it's a great idea to open a sell trade.
The End Zone
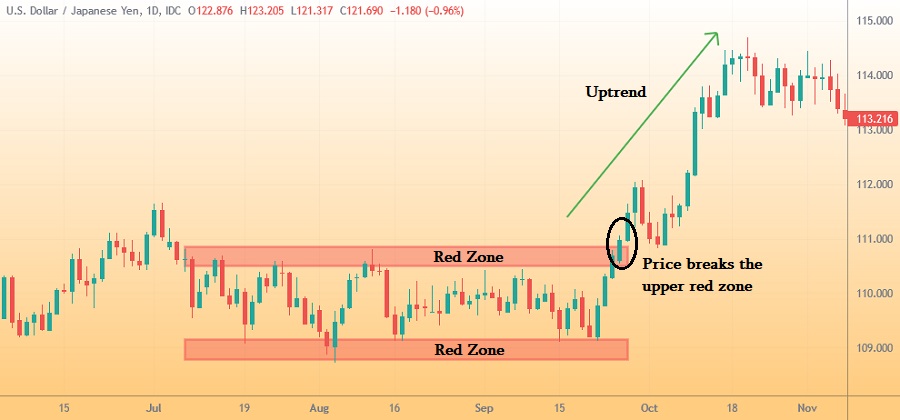
Last but not least, there's also the end zone. You need to extend the red zone and use it as the main focus of your next trade. This is where many traders make up their minds and choose their next move, so you need to be able to assess the situation and act on it.
The chart below shows that the price didn't fall under the upper red zone again, indicating a buy signal. In this case, you should look for a strong breakout signal.
End Thoughts
At first glance, the pure price action strategy might seem too simple because you only rely on price movements, but the truth is that you don't need a bunch of fancy indicators to make money.
Remember that the profitability of a strategy depends on how it is executed. If you know the key components of the market and are able to make a good analysis out of it, then you can definitely generate considerable income from your trades.