 Dedicated FREE FOREX VPS
 Free FOREX Virtual Private Server
 MT4 Demo Contest, Get $500
 Sign Up for an Account, Claim 60% Deposit Bonus
 Free MT4/MT5 VPS 2024
 Send E-mail and Get Free Merchandise
 $1K Refer a Friend Bonus for Pepperstone Pro clients
 Maximize Your Earnings with 100% Deposit bonus
 Trade to Win, $5,000 Monthly Demo Contest
 Claim 30% + 15% Deposit Bonus from LiteFinance
Supply and demand zones are different from support and resistance. Discover the key principles and tools needed to accurately identify these important zones.
The laws of supply and demand are fundamental principles that govern all marketplaces, whether they be for goods, services, or financial instruments.
They can be understood through a few simple concepts:
- When demand for a financial instrument is greater than its supply, the price tends to rise.
- When demand is equal to supply, the price tends to remain stable,
- When supply is greater than demand, the price typically falls.
When traders engage in market trading, they often rely on technical indicators to identify trends and imbalances in the market. However, some traders use supply-demand trends and zones to formulate a trading strategy based on economic theory. These traders believe that price movements are determined by the interaction of supply and demand, and they use this information to make trading decisions.
Contents
What are Supply and Demand Zones?
Supply-demand zones are price levels at which unfulfilled orders are waiting to be completed. These zones are created by banks and other financial institutions that use complex algorithms to identify key areas of supply and demand. By understanding these zones, traders can gain a better understanding of the market and make more informed trading decisions.
Supply Zone
A supply zone refers to the price level at which traders usually sell. It is situated above the current price, where the potential or interest in selling is the highest. When the price reaches this level, unfilled orders are completed, resulting in a drop in the price. The accompanying chart below provides a better understanding of the supply zone concept.
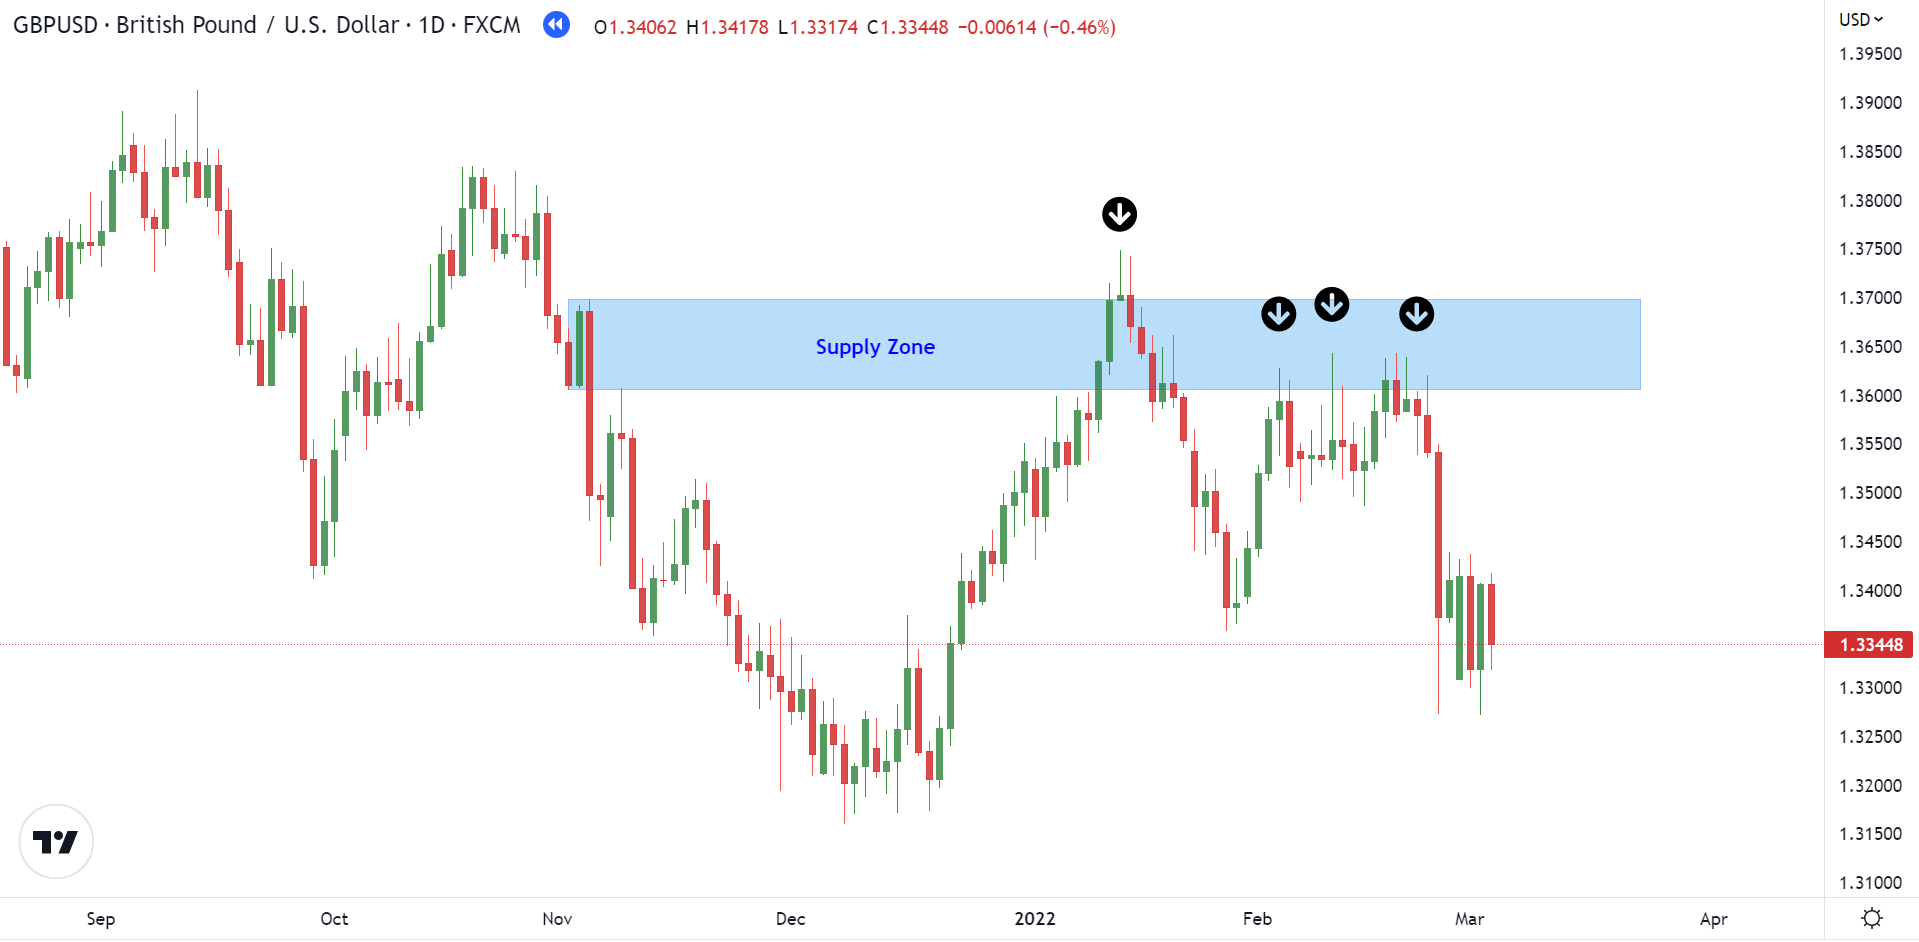
As shown in the above chart, the price reaches a specific zone, remains there for a while, and then goes back down. This pattern keeps repeating until all the unfulfilled orders are executed.
Demand Zone
On the other hand, a demand zone refers to the price level at which traders usually buy. It is situated below the current price, where the buying interest or potential is the highest. This means that the demand zone has many buyers available, owing to numerous buying orders at that level. The following chart will help you understand the demand zone concept more thoroughly.
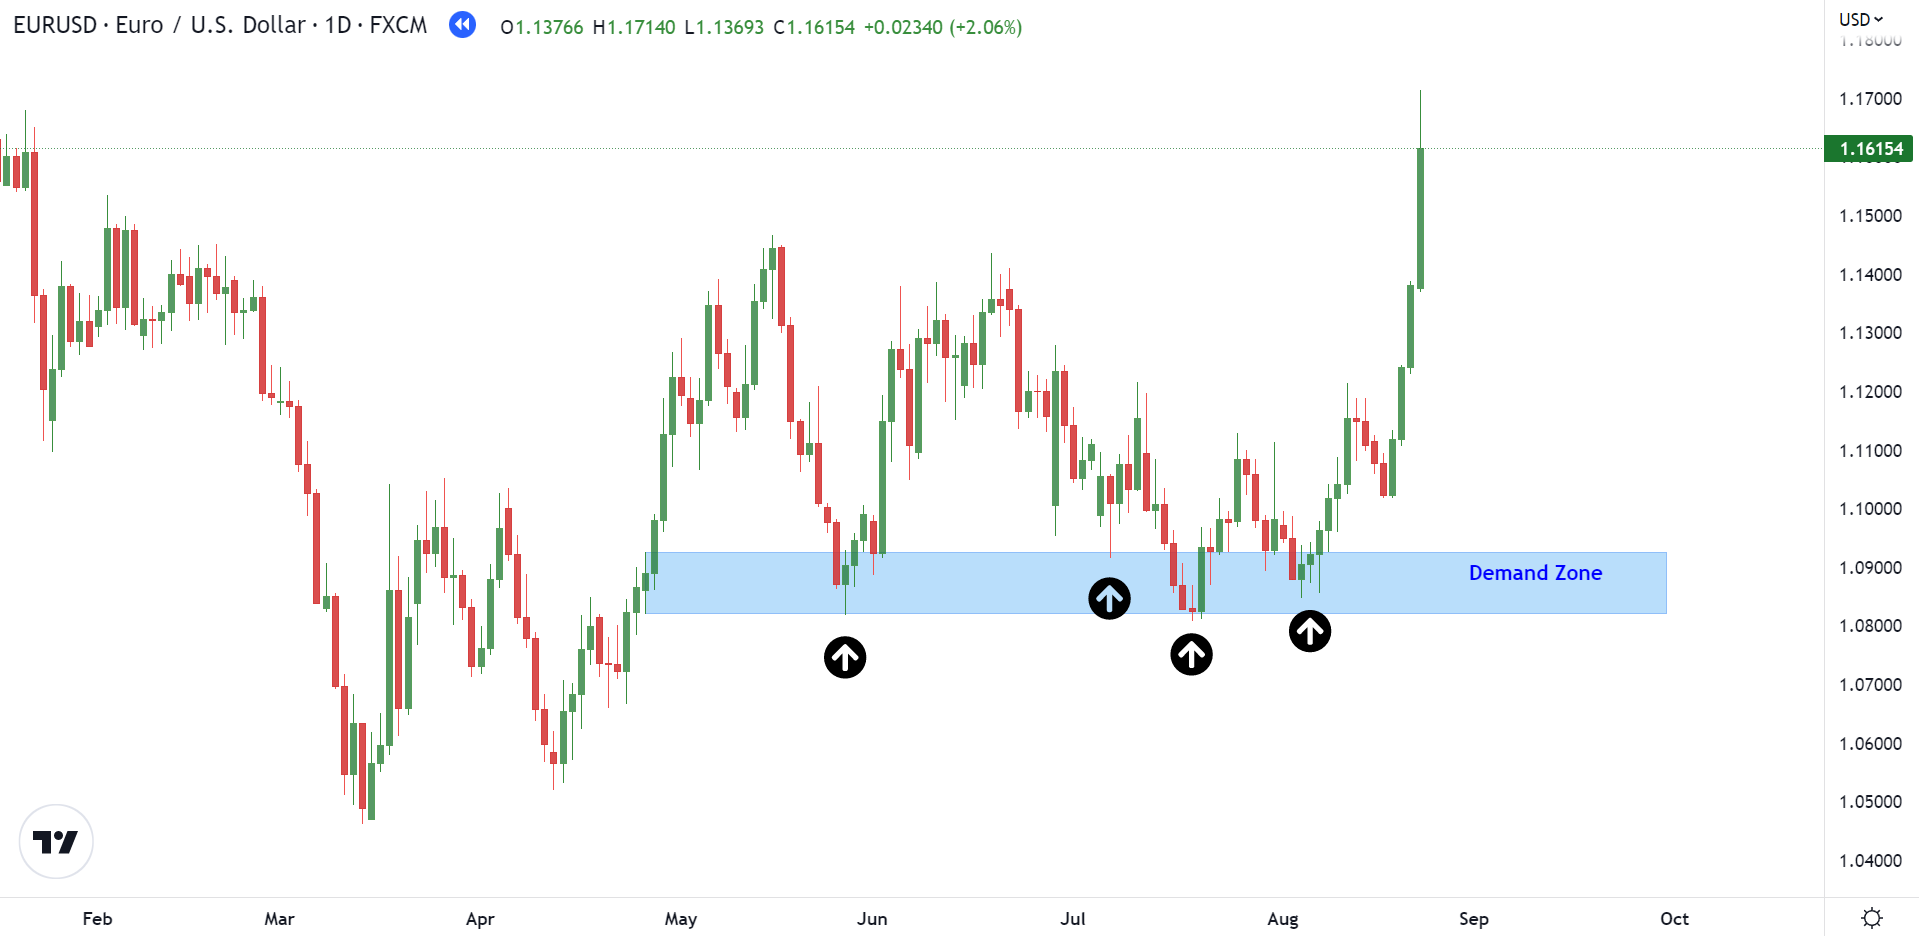
In the chart, you can see an instant upward move. This is because when the price rallies up from the demand zone, some orders are fulfilled, while the unfilled ones get absorbed.
Types of Supply and Demand Zones
Understanding the patterns involved in supply and demand zones is crucial. Like traditional price pattern analysis, supply and demand zones also have reversal and continuation patterns.
Reversal Patterns
Reversal patterns refer to situations when the price trend reverses from up to down or vice versa. Let's take the example of two structures to understand these patterns more clearly:
- Drop-Base-Rally: In this structure, the price drops, creates a base structure, and then rallies upward.
- Rally-Base-Drop: In this structure, the price rallies up, creates a base structure, and then drops significantly.
On the chart below, you can identify the supply zone on the extreme left side, and the demand zones are represented by the next two structures.
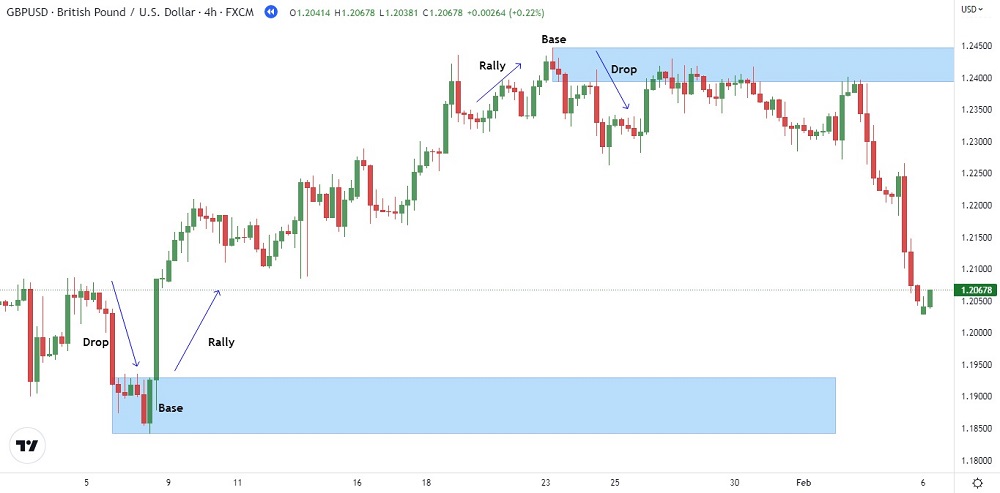
In the demand zone structure, you can clearly see the price dropping significantly, creating a base, and then rallying up, following the drop-base-rally structure.
While in the supply zone, you can see the price rallying up, pausing for some time, and then dropping significantly, following the rally-base-drop structure. Note the long candles representing the drop, indicating the intensity of the imbalance at that price level.
Continuation Pattern
Continuation patterns refer to situations when the price trend continues moving either up to down or down to up. These patterns are generally weak as most of the time, price tends to break through these structures. Let's have a look at their two types:
- Drop-Base-Drop: In this structure, the price drops, creates a base, and then continues to move down in a strong fashion.
- Rally-Base-Rally: In this structure, the price rallies up, creates a base, and continues to move upward.
In the chart below, the demand zone is present on the extreme left side, and the supply zones are represented by the next two structures.
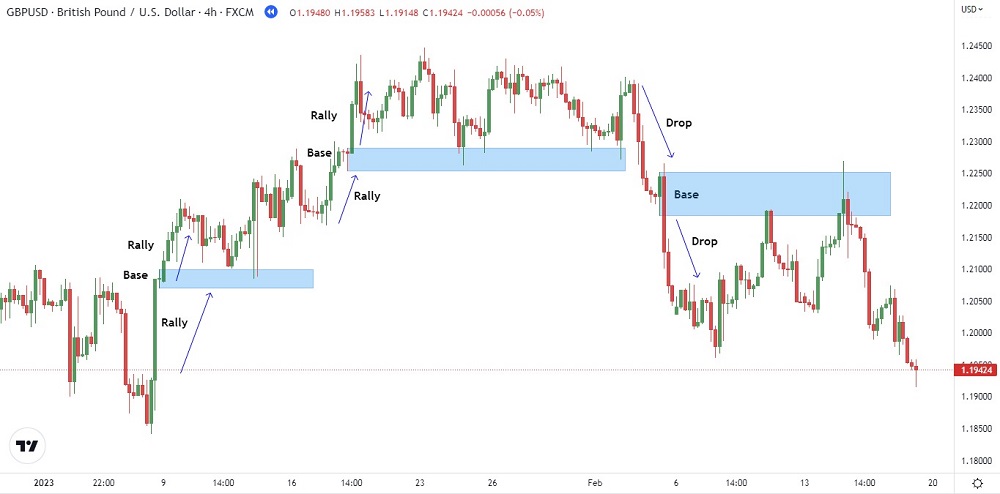
In the demand zone, you can see the price rallying up, waiting for a while to create the base, and then continuing to move upward, following the rally-base-rally structure. Note the long candles showing the continuation of the price rise.
In the right supply zone, you can see the price dropping significantly, waiting for a while to create the base, and then continuing to move downward, following the drop-base-drop structure.
It's worth noting that reversal patterns have a higher chance of success than continuation patterns due to their strength.
How to Identify Supply and Demand Zones
Supply and demand zones are important concepts in technical analysis that can help traders identify potential areas of price reversal or continuation. To mark a supply and demand zone on a chart, there are a few key steps to follow.
- Identify the current market price. This is the price level where the asset is currently trading.
- Look to the left on the chart to find a strong movement in either direction. This will be the basis for identifying the supply or demand zone.
- Look for big candles. Once you've identified the strong movement in either direction, look for big green or big red candles in that area. These candles represent a large shift in demand or supply and can be a good indicator of a potential supply or demand zone.
- Find the origin of the big candles. This is the point where supply or demand overcame the opposing force and caused large price shifts.
- Mark the zone around the origin. This zone represents an area where supply or demand is likely to be identified in the future, potentially leading to a price reversal or continuation.
See Also:
How to Draw Supply and Demand Zones
Once you have identified the zone you want to mark on your chart, you can begin drawing the lines that represent it. The method you use to draw the zone will depend on your trading style and risk tolerance.
For supply zones, there are three common methods to draw the lines that represent the zone.
1. The conservative method. In this method, you place the distal line at the top of the candle wick and the proximal line at the lowest body of the base. This method is considered the safest and most reliable, but it may result in missing out on potential trades.
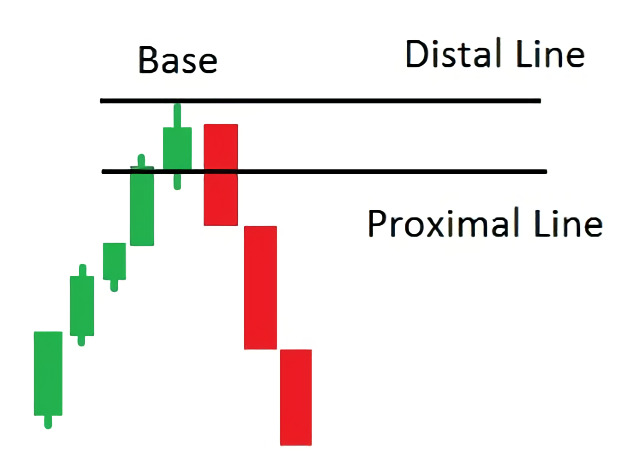
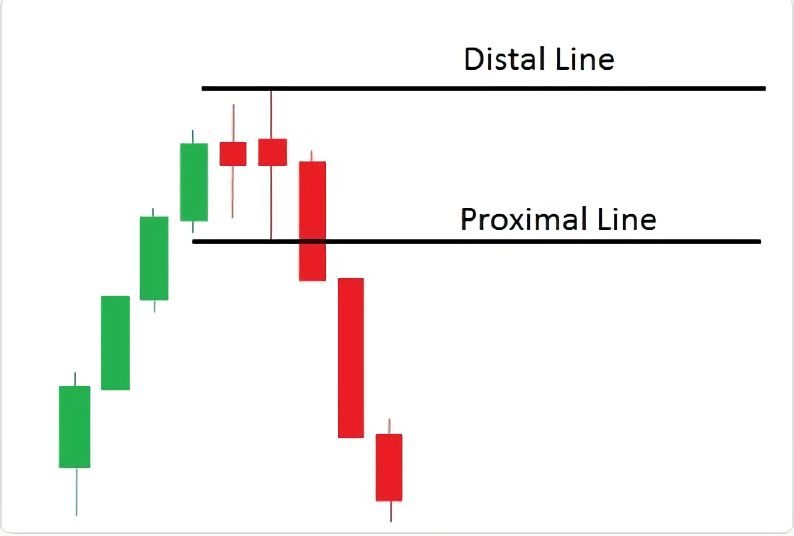
2. The high-risk method. In this method, you place the distal line at the highest wick and the proximal line at the lowest wick. This method can be riskier, but it may provide more trading opportunities.
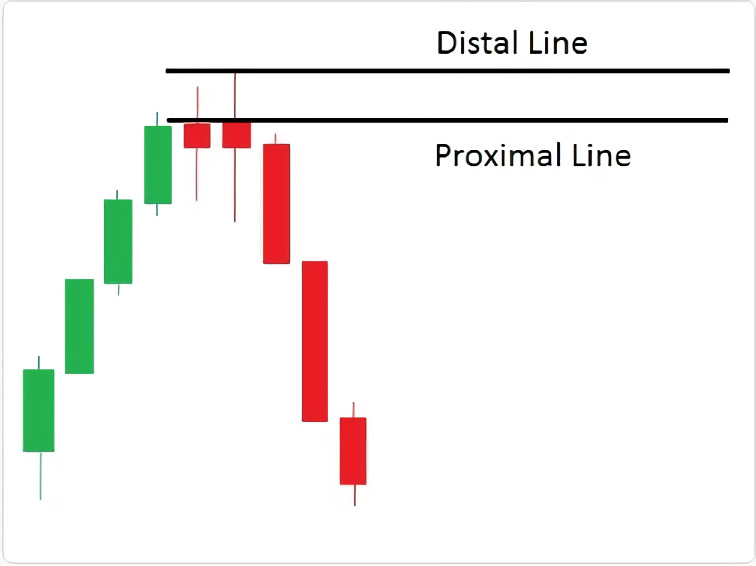
3. The low-risk method. In this method, you place the distal line at the highest wick and the proximal line at the highest body. This method is also considered low-risk and can provide a good balance between reliability and trading opportunities.
For demand zones, the three methods are the opposite of the supply zone methods.
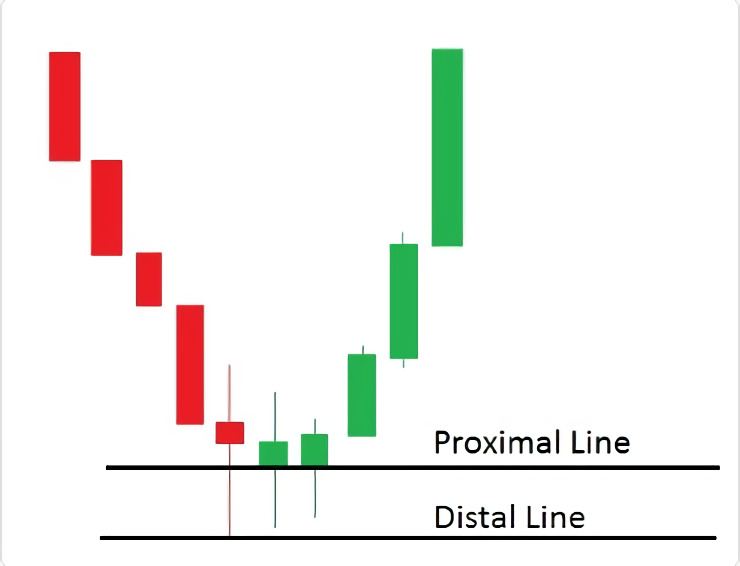
1. The conservative method involves placing the distal line at the lowest wick and the proximal line at the highest body.
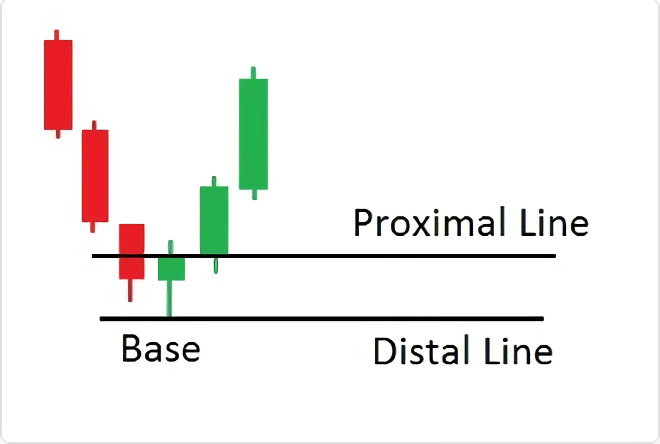
2. The high-risk method involves placing the distal line at the lowest wick and the proximal line at the highest wick.
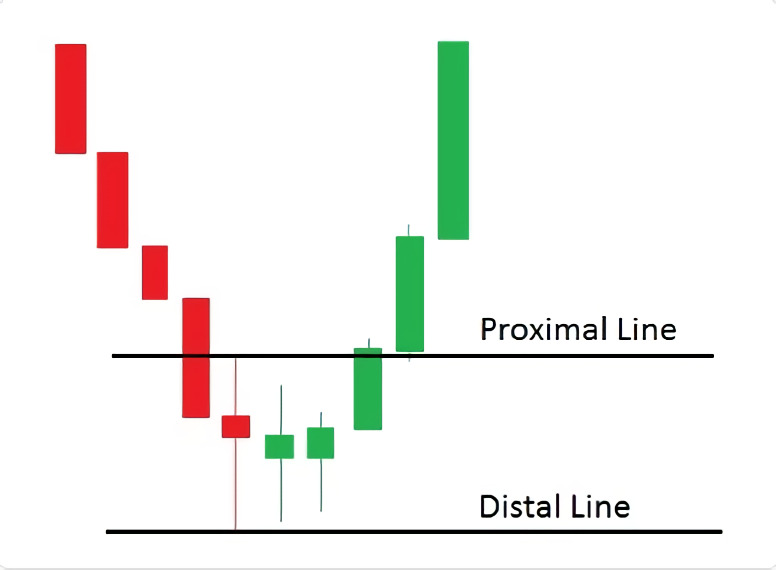
3. The low-risk method involves placing the distal line at the lowest wick and the proximal line at the lowest body.
Regardless of the method you use, it's important to remember that no method is foolproof. Supply and demand zones can be subjective and depend on each trader's interpretation. It's important to do your own analysis and use a combination of methods that work best for you.
How to Identify Strong Supply and Demand Zones
When trading using supply and demand zones, it's essential to know which signals are strong and which ones are weak. A strong signal in this context is an indication that a particular trading setup has a high probability of success. Conversely, a weak signal has a lower probability of success and may not be worth trading.
To get the best trading results, it's crucial to ignore the weak signals and take only the strong ones. The perfect supply and demand trade setup will exhibit all of the following features:
- Narrow price range: A wide trading range that exceeds the breakout with many long-wick candles indicates uncertainty and is less likely to represent accumulation from a whale. On the other hand, a narrow price range indicates a clear balance between supply and demand, making it an ideal zone for trading.
- Less than 10 candles: Demand or supply zones should ideally be between 1 and 10 candles. While accumulation and distribution can take time, if it takes too long, the zone may get exhausted before a re-test later. Shorter zones have a higher probability of being fresh and untested, providing an excellent opportunity for traders.
- Strong price move: A breakout candle with an "Extended range candle" (ERC) is a strong indicator of a significant price move. A weak move may not be sufficient to trigger a profitable trade.
- Fresh/Untested: The best zones are those that have not been revisited since the breakout. The more times supply and demand zones are tested, the more likely they are to fail, just like support and resistance. A fresh and untested zone indicates an excellent trading opportunity, as the price has not yet had a chance to retest and weaken the zone.
- Fakeout or 'Spring': A fakeout or spring occurs when the price temporarily breaks out in the opposite direction but then quickly reverses. This is a sign of "stop hunting" by big players to find extra liquidity for their accumulation or distribution. A fakeout or spring is a strong signal that the supply or demand zone is about to break, and traders should be ready to take advantage of it.
Best Supply and Demand Zones Indicators
When it comes to identifying supply and demand zones on a price chart, traders have a variety of indicators at their disposal. These indicators can help confirm zones and make it easier to enter and exit trades.
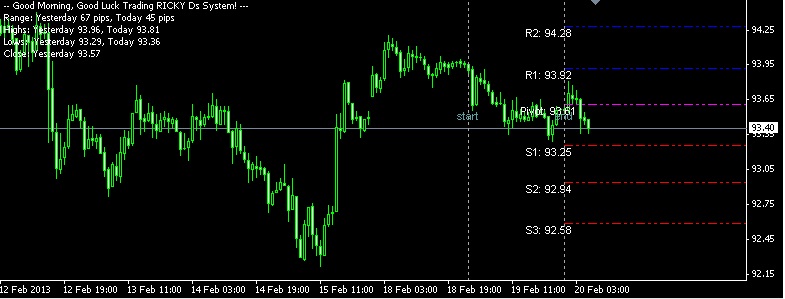
Pivot Point
One of the most common indicators for identifying supply and demand zones is the use of pivot points. Pivot points are technical indicators that are calculated by taking the average of the high, low, and closing prices from the previous trading day. These points can be used to identify both support and resistance levels, as well as supply and demand zones.
Support and Resistance Levels
Support levels are price levels where the downward movement of an asset stops due to increased demand, while resistance levels are levels where upward movement reverses with a sell-off. By identifying these levels, traders can better understand chart patterns in supply and demand forex markets and know when to enter and exit trades.
Fibonacci Levels
These levels are based on a mathematical sequence that can help traders identify possible turning points in the market. For example, the 61.8% Fibonacci level is often considered a significant level for identifying supply and demand zones.
Best Supply and Demand Zones Trading Strategies
When it comes to supply and demand forex trading strategies, there are several options to choose from that can be effective in identifying trading opportunities. Here are some of the most popular strategies:
Range Trading Strategy
If you have identified your supply and demand zones, you can use a range trading strategy. To do this, many traders rely on stochastic indicators to identify overbought and oversold market trends. Range trading is a non-directional trade that allows you to identify both long and short entries in the forex market. After viewing all the conditions on a longer-term chart, traders can zoom into a smaller-term frame to spot the perfect entry.
Breakout Strategy
Since prices are constantly fluctuating in the forex market, traders often look for ways to enter the market in favorable conditions, such as in the direction of a breakout, as it could be the start of a trend.
Risk Management Strategy
Supply and demand zones work similarly to support and resistance levels, providing information to the trader about where to place trades. Traders can implement different strategies depending on their risk tolerance. Range traders selling at the supply zone can set stops above the supply zone and aim for the demand zone. Conservative traders can aim above the demand zone and formulate various risk management techniques.
Final Words
In conclusion, identifying supply and demand zones is a crucial aspect of successful forex trading. By identifying these zones, traders can anticipate market trends, determine entry and exit points, and make profitable trades. However, it is important to note that identifying these zones requires practice, patience, and discipline. Traders need to analyze various technical indicators, study price charts, and keep track of market trends to identify these zones accurately.
Moreover, traders should also consider the fundamentals that can affect the forex market. Factors such as economic news releases, central bank decisions, and geopolitical events can impact the supply and demand of a currency. Therefore, it is important to combine technical analysis with fundamental analysis to make informed trading decisions.
By implementing the strategies and techniques discussed in this article, beginners can start identifying supply and demand zones with more confidence. It is important to remember that trading is not a get-rich-quick scheme, and success requires continuous learning, adapting, and improving. With time and experience, traders can improve their skills and strategies to become more profitable in the forex market.


11 Comments
Nexus
Feb 22 2023
I recently came across this interesting article that discussed demand and supply zones in trading. According to the author, it is suggested that these zones ideally consist of 1 to 10 candles. I found this intriguing, but I'm curious to understand the reasoning behind this specific range. Could you shed some light on why the author recommends such a specific number of candles? It makes me wonder whether using only 10 candlesticks would be accurate enough to analyze and identify fresh and untested zones. Don't you think there might be other factors or considerations that need to be taken into account when determining the optimal size of these zones? I'm genuinely curious to explore the nuances of this concept and how it affects trading strategies. What are your thoughts on this?
Torino
Mar 1 2023
@Nexus: Hey there! In my opinion, just sticking to a fixed number of candles might not cut it. We need to consider other stuff too. Things like the timeframe we're looking at, how volatile the market is, and the overall market structure all come into play.
And hey, let's not forget about price action confirmation. It's important to see if there are any reversals or patterns that back up the zones we identify.
To get a better picture, we should also look at multiple timeframes. It helps us understand the whole scene better, you know?
But honestly, trading is a wild ride. So, my take is that while the suggested number of candles is a good starting point, we've gotta be adaptable and consider the bigger picture. That way, we can develop a keen sense of demand and supply zones and use them to fine-tune our trading strategies.
Stefan
Feb 23 2023
When it comes to trading the forex market, breakouts can be a significant opportunity for traders to enter the market in favorable conditions, potentially signaling the start of a new trend. Could you explain how the breakout strategy works and how traders identify potential breakout opportunities?
I'm particularly interested in understanding the key principles behind breakout trading. What are the key factors traders consider when determining if a breakout is likely to occur? Are there specific technical indicators or chart patterns that can help identify potential breakouts? How do traders set entry and exit points when executing breakout trades?
Additionally, I'd like to know if there are different variations of breakout strategies. Are there specific time frames or market conditions that are more conducive to breakout trading? How do traders manage risk when trading breakouts, considering the potential for false breakouts or whipsaw movements?
Aldy
Mar 1 2023
If I got it right, the supply zone is basically a zone where the market price can't break through and hangs around there, while the demand zone is a zone where the price doesn't drop below a certain point. Am I on the right track?
Now, here's what I wanna know: Can beginner traders really benefit from understanding and using supply and demand zones? Like, can they use these zones to make smarter trading decisions? Oh, and can you draw those supply and demand zones easily on most trading platforms out there? And, let me ask you, is it something that most traders know about and actually use in their trading analysis? Spill the beans!
Marcus Alfonso
May 21 2023
@Aldy: Listen up, my friend! Understanding and using supply and demand zones can totally benefit newbie traders. These zones give you key insights into market dynamics, showing you where buying and selling pressure might kick in. By spotting these zones, you can make better decisions on when to enter or exit trades and even where to set those stop-loss orders.
Drawing supply and demand zones is a piece of cake on most trading platforms. You can use tools like horizontal lines or custom drawing tools to mark 'em on your charts. Easy peasy!
And guess what? Supply and demand zones are like bread and butter for traders. They're fundamental in technical analysis, alongside other indicators and tools. Many traders use these zones in their strategies to spot potential areas for price action and trend reversals.
So, yeah, understanding and using supply and demand zones can really give you an edge in trading. Keep on learning and practicing, my friend, and watch your trading game soar! Happy trading, rockstar!
Josh
May 25 2023
In the article, the concept of trading with supply and demand zones is extensively covered, providing valuable insights into this trading approach. However, one aspect that caught my attention is the discussion on proximal lines and distal lines within the graphical representations. While the article delves into these lines, I'm still unclear about the actual benefits, particularly of the distal line. I'm interested in understanding the significance of the distal line and its importance within the context of supply and demand zones. How does the distal line contribute to the overall analysis and decision-making process when trading in these zones?
Erie
May 28 2023
@Josh: the distal line is the extreme price level that was reached during a big price move before the zone formed. It shows where the supply and demand imbalance was strong enough to cause a significant price reversal.
The cool thing about the distal line is that it acts as a reference point for future price action. Traders pay attention to how price reacts when it gets close to or touches the distal line. If price bounces off the distal line strongly, it confirms that the supply or demand zone is legit and powerful. It means that the supply and demand imbalance there is still relevant and can affect future price moves.
But wait, there's more! The distal line also helps traders figure out their risk-reward ratios and set profit targets. By looking at the distance between the proximal and distal lines, traders can estimate the potential price move when price reaches the proximal line.
Chairul
Jul 13 2023
Hey there! jUst being interested in this article about supply and demand zones. However when I look into the article and read it carefully, I found something interesting. I mean, if you read this article about the supply and demand zones, you will find that those things are very similar to the support and resistance. It is very similar; I mean supply zones are above the candlestick or the upper of the candlestick meanwhile demand zones are below the candlestick or the lower of the candlestick. It really reminds me a lot of support which is the upper of the candlestick and also resistance that below the candlestick.
It raised some questions here and one of them is, what is the difference between supply demand zones and support resistance?
Ferdi
Jul 15 2023
@Chairul: Hey! That's a keen observation you made about supply and demand zones being similar to support and resistance levels. They do share some similarities, and it's always exciting to connect the dots in trading concepts.
So, here's the deal: supply and demand zones focus on specific areas where buying and selling activity has been intense. Supply zones are like the "ceiling" above the candlestick, indicating areas where sellers might dominate and push prices down. Demand zones, on the other hand, are like the "floor" below the candlestick, suggesting areas where buyers could step in and push prices up.
Support and resistance levels, on the flip side, act more like barriers to price movements. Support is like a level where buyers show up and say, "Nope, we won't let prices fall further!" Resistance, on the other hand, is like a level where sellers gather and say, "Uh-uh, we won't let prices go higher!"
The main difference is that supply and demand zones focus on the imbalance between buying and selling pressure at specific levels, while support and resistance levels are more about price barriers.
Kendrick
Nov 22 2023
I came across an intriguing point in the article mentioning that if you've pinpointed your supply and demand zones, you can apply a range trading strategy. To execute this, a lot of traders turn to stochastic indicators to spot overbought and oversold market conditions. Now, what exactly is this stochastic indicator? And when they talk about overbought and oversold, what does that mean? Also, could you shed some light on how one identifies supply and demand zones in this context? I'd appreciate a breakdown on this. Thanks!
Foden
Nov 24 2023
Let me break down to you dude! The stochastic indicator is a popular technical analysis tool used in trading. It helps identify potential reversal points in the market by comparing the current closing price to the price range over a specific period. The indicator consists of two lines, %K and %D, and is often used to highlight overbought or oversold conditions.
In the context of stochastic indicators, overbought and oversold refer to extreme conditions in the market. When the stochastic indicator rises above a certain threshold (commonly 80), it suggests that the asset may be overbought, meaning the price may have risen too quickly and a reversal could be imminent. Conversely, if the indicator falls below another threshold (typically 20), it indicates oversold conditions, suggesting that the price might have dropped too quickly and could be due for a rebound. (read : How to Use Stochastic in Forex Trading)
To identify supply and demand zones, traders look for areas where the price has historically struggled to move beyond (supply) or areas where it has found support (demand). This analysis is often complemented by tools like support and resistance levels, trendlines, and chart patterns.
Hope it can help!