 Dedicated FREE FOREX VPS
 Free FOREX Virtual Private Server
 MT4 Demo Contest, Get $500
 Sign Up for an Account, Claim 60% Deposit Bonus
 Free MT4/MT5 VPS 2024
 Send E-mail and Get Free Merchandise
 $1K Refer a Friend Bonus for Pepperstone Pro clients
 Maximize Your Earnings with 100% Deposit bonus
 Trade to Win, $5,000 Monthly Demo Contest
 Claim 30% + 15% Deposit Bonus from LiteFinance
Leading indicators are not always better than lagging indicators and vice versa. Why is that so? How to determine which type of indicator is the best one for you?
As a forex trader, you must be familiar with the term 'indicator', especially a technical indicator attached to the price chart. A technical indicator is a technical tool based on calculating the price movement from a currency pair.
The indicator's main function is to help map the current market condition and predict the price movement based on the established chart. Commonly, traders apply indicators to get trading signals, monitor the direction of the market trends, and confirm signals to open a trade.
The types of indicators are only divided into two types: leading and lagging.
- Leading indicators are identified by their leading movements that precede the price.
- On the other hand, lagging indicators tend to move slower than the price.
Both leading and lagging indicators have benefits for traders. Now, which technical indicators are considered leading and lagging?
Leading Indicators
In the implementation, leading indicators are expected to "lead" traders before making decisions. The advantage of a leading indicator is that it can confirm the price movement from only 1 candle, so it will be very helpful in making entry decisions quickly. Trading using a leading indicator is quite risky.
The leading indicators can indeed provide faster entry signals, but it is also very possible that the signal they point is false. In this condition, the skills and experience of each trader are one of the important keys to avoiding mishaps. Moreover, various tips on filtering false signals can be applied as additional references.
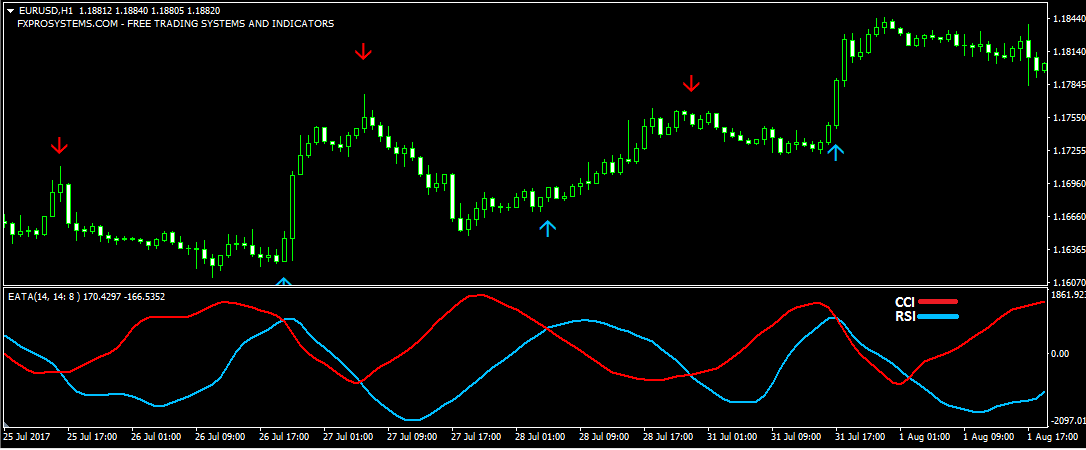
Leading indicators are generally included in the Oscillator group, a type of technical indicator showing the Overbought and Oversold conditions. If you want to trade using signals from the leading indicators, Stochastic and RSI are two of the most recommended Oscillators for beginners.
Stochastic
George C. Lane first created stochastic in the late 1950s. As an Oscillator, Stochastic can show when the price movements have reached the Overbought and Oversold levels. This indicator has been used by traders, investors, analysts, and market experts for over 50 years.
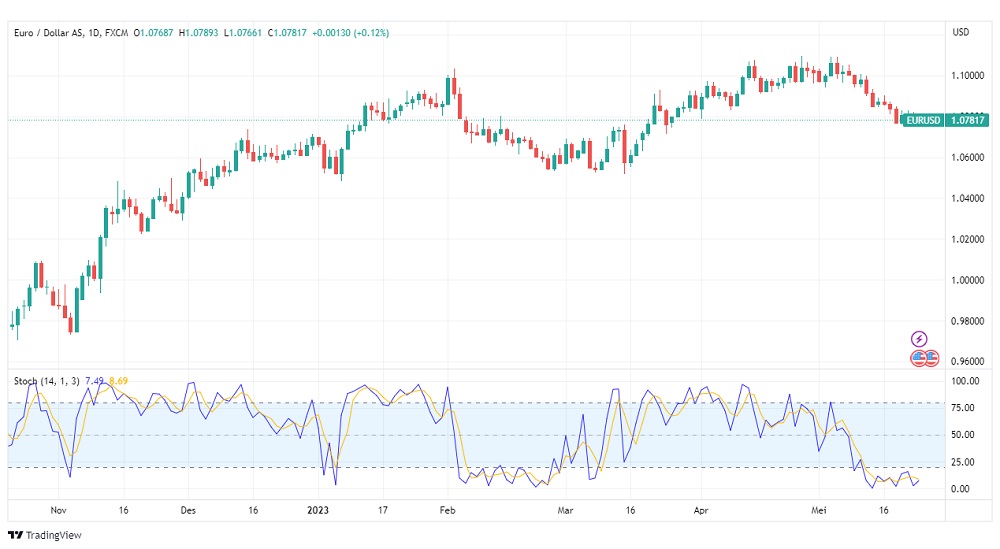
Stochastic consists of two lines, namely the %D and %K lines. Both lines are later useful to identify the current trend behavior, based on the distance between the %D and %K lines.
If the distance between the %D and %K lines widens, there is a tendency for the trend to get stronger. Meanwhile, if %D and %K tighten, we can assume that the trend is starting to get weaker. The weakening of a trend can be a starting point for a trend reversal, an opportunity to enter the market with great profitability.
As for the Overbought and Oversold conditions, Stochastic has two extreme points at 20 and 80 to indicate them. Overbought happens when the Stochastic lines break the 80 level, whereas the Oversold condition is confirmed when Stochastic lines move below the 20 level.
Relative Strength Index (RSI)
The relative Strength Index (RSI) was first introduced by J. Welles Wilder in 1978 in his book called "New Concepts in Technical Trading Systems". Since then, the RSI indicator has been known as a popular Oscillator and is considered reliable by many.
Plus, this indicator is widely used in almost all types of markets, including the forex market. This is what RSI looks like in a price chart:
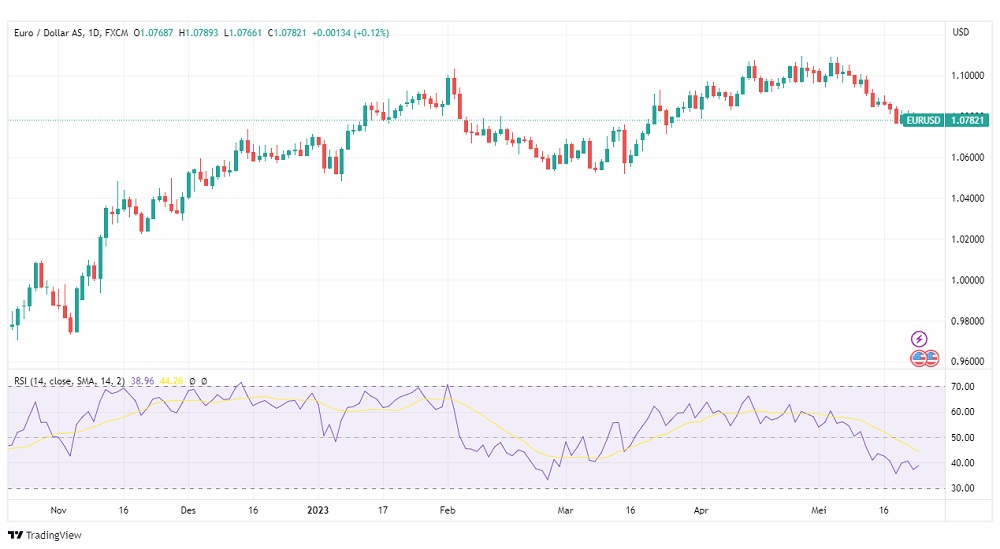
RSI is useful as an indicator of Overbought and Oversold just like Stochastic. The difference is, this indicator only consists of one RSI line. Besides, Overbought and Oversold levels can be adjusted based on the traders' desire. If Stochastic's levels are normally set at 20-80, the RSI's levels can be pegged at 30-70 or 20-80.
In using the RSI, take note that the entry of the line into the Oversold area indicates a weakening of a Downtrend. Meanwhile, if the RSI line breaks the Overbought limit, it could signal a weakening Uptrend.
How can the RSI show entry positions? If you want to enter a SELL position, then the position of the RSI indicator line must be at the Overbought level first, then wait until the line drops below the Overbought level. Conversely, if you want to enter a BUY position, ensure that the RSI line crosses the Oversold level, then wait for the line to rise again above the Oversold area.
Lagging Indicators
In contrast with leading indicators, lagging indicators tend to provide slower entry signals because they follow and respond to the price instead of creating predictions. Traders may miss opportunities to harvest maximum profits using this type of indicator.
Usually, lagging indicators are often found in indicators that measure a trend direction, which is also known as "trend-following indicators". You can still use lagging indicators to identify trading signals despite their lagging disposition.
They help traders when the price is trending, hence their popularity among trend followers. Lagging indicators can tell when the price is about to return to its major trend so traders can join in the trend and profit from it. Here are some well-known lagging indicators that also serve as trend-following indicators:
Moving Average (MA)
Moving Average can be mentioned as a simple and easy-to-use indicator, making it widely used by novice traders. Besides its simple appearance, the Moving Average has much information that can be used as trading signals.
As a trend direction indicator, MA can indicate the Uptrend and Downtrend conditions based on the price position against the MA line. If the price exceeds the MA line, the market is in an Uptrend. On the other happen, if the price is below the MA line, it can be said that the Downtrend is in control.
Furthermore, MA can be used to find opportunities from crossing the lines. By using two or more MA lines with different periods, traders can watch for crossing signals as their confirmator before entering the market.
The example of finding an entry position based on the crossing between 5 MA and 20 MA can be seen on the following chart:
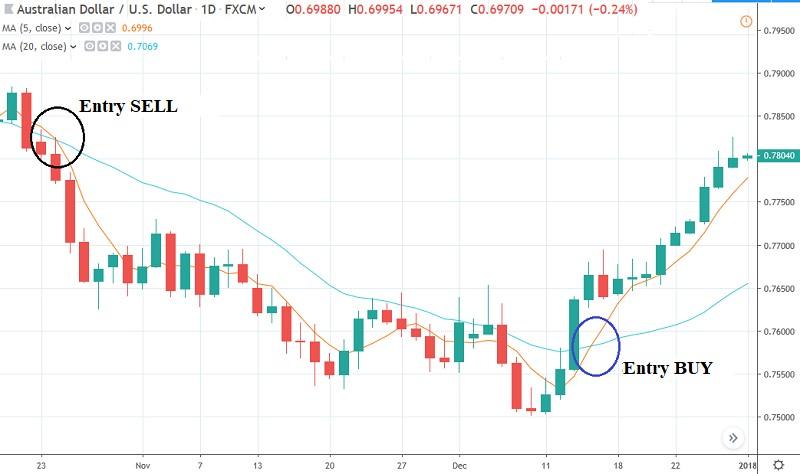
Based on the chart above, here are the BUY and SELL rules:
- Buy when the small period MA cuts the big period MA from below.
- Sell when The small period MA crosses the big period MA from above.
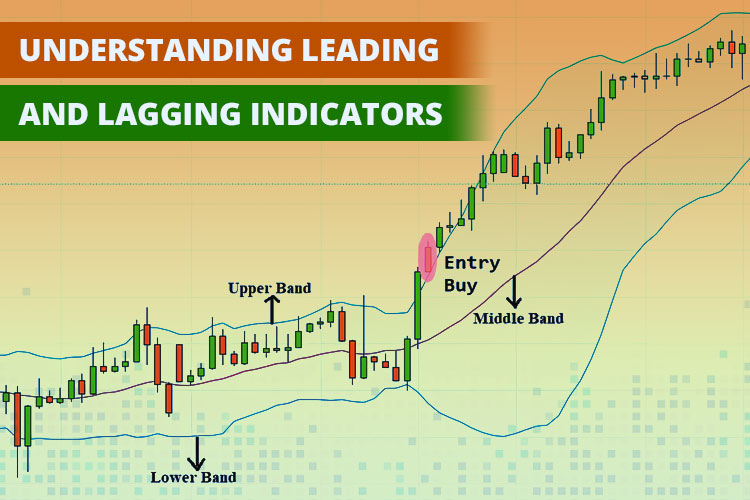
Bollinger Bands (BB)
Since it was first introduced by John A. Bollinger in 1980, the Bollinger Bands has become one of the most popular trading indicators, especially during trending conditions. Bollinger Band is a great trend indicator and can help traders analyze markets.
A strong uptrend can be seen if the price has broken through the Upper Band and is closed outside the band. Conversely, a trend can be considered a downtrend if the price breaks the Lower Band and closes outside the band. For a clearer illustration, here is an example of trading with the Bollinger Bands:
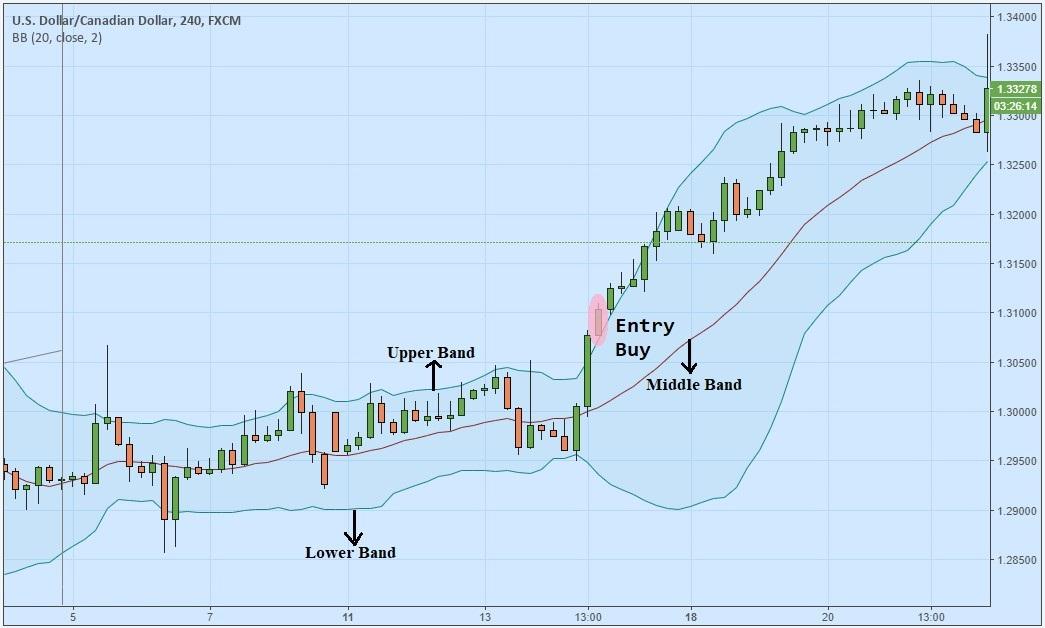
Based on the chart above, it can be said that a BUY position is in order when the price breaks the Upper Band and closes outside the band. The widening of the bands following the position confirms the strength of the Uptrend, making it a profitable choice for traders who use the BUY signal from the beginning.
Moving Average Convergence Divergence (MACD)
MACD (Moving Average Convergence Divergence) indicator is very popular and widely used by traders in the forex market. This technical indicator was created by Gerald Appeal in 1979. It did not take long until MACD received great acceptance from various market players because of its simplicity and flexibility.
The indicator consists of two EMA lines (12 EMA and 26 EMA) and a histogram that transitions between a positive and a negative zone. The MACD indicator can confirm the trend direction and find entry signals.
The trend direction and strength can be defined from the histogram position, while the entry signals can be taken from the crossing between the two EMA lines.
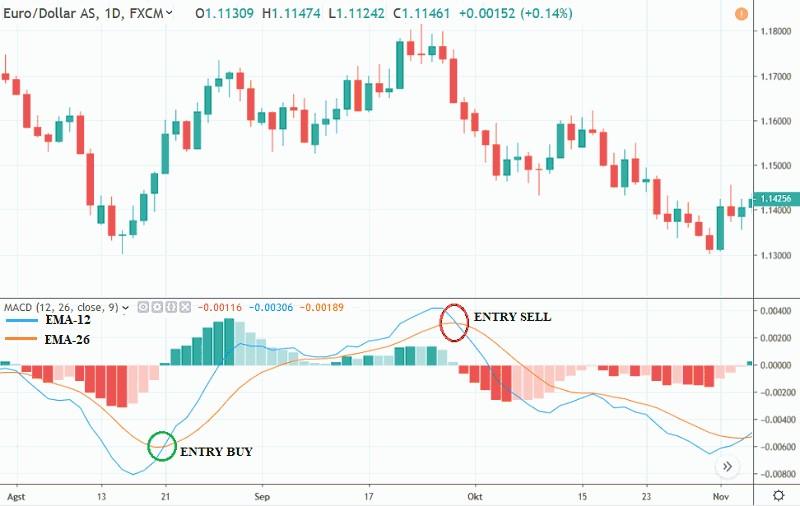
In short, here are the rules of trading with a MACD indicator:
- 12 EMA is above 26 EMA and the histogram is positive = Uptrend.
- 12 EMA is below 26 EMA and the histogram is negative = Downtrend.
- BUY if the histogram is positive, and 12 EMA crosses 26 EMA from below.
- SELL when the histogram is negative, and 12 EMA crosses 26 EMA from above.
See Also:
Leading Vs Lagging Indicators, Which is the Better One?
Lagging indicators are important because they provide information on the ongoing price, how long the period has been run, and what levels have been reached.
Yet, the use of leading indicators is just as crucial, especially to generate trading opportunities that don't fall too far behind the current price movement. It would be better if the use of the two trading indicators could be balanced and adapted to the market conditions.
To summarize the explanation, here is a comparison table between the two types of indicators:
| Characteristics | Leading Indicators | Lagging Indicators |
| 💡Information provided | Provide early signals before new trends or reversals actually begin. | Provide confirmation of a trend or pattern after it has already been established. |
| ❎Vulnerability to false signals | Can result in false signals due to their predictive nature. | Less likely to generate false signals compared to leading indicators. |
| 🔍Utility | Useful in identifying potential buying or selling opportunities in advance. | Useful for affirming that a trend is in place and for indicating the trend's stability. |
| 🕔Timing | Give signals before a new trend or reversal starts. | Provide confirmation after the trend has begun. |
| 📊Purpose | For predicting future market movements, making them ideal for entry points. | For confirming ongoing trends, making them more suitable for affirming the trade's validity. |
| 🚨Risk | Carry a higher risk of false signals. | Reduce the risk of false positives by confirming existing trends. |
| 🧩Examples |
|
|
If the market is trending, then a lagging indicator is more suitable. This is because lagging indicators mainly consist of trend direction indicators, such as Moving Average, Bollinger Bands, or MACD. Meanwhile, a leading indicator should be used if the market is sideways because it can indicate Oversold or Overbought conditions.
Backtesting Each Indicator
To figure out whether lagging or leading indicators work better, we're going to test them using backtesting. Our testing period spans six months, from April to September 2023, using chart data. We're focusing on the EUR/USD currency pair with an H1 timeframe.
We'll assess a total of five indicators that are set to their default settings and the following rules:
| 📈Indicators | 🔧Settings | ▶️Entry Rules | 🛑Exit Rules |
| Stochastic | 14,3,3 | We make entries when the price signals hit extreme levels – either overbought or oversold. A sell position is triggered if the Stochastic lines cross above the 80 level, while a buy position is triggered if they cross below the 20 level. To safeguard the trade, we set the stop-loss at the most recent high for sell positions and at the recent low for buy positions. For the take profit, we maintain a risk-reward ratio of 1:2. | Positions stay open until the price reaches either the stop-loss or take profit level. |
| RSI | 14-period | A sell position is initiated when the price goes into the overbought territory (above 70). A buy position is triggered when the price enters the oversold zone (below 30). To protect our trade, we have two ways to set a stop-loss. If the price shows a long shadow, we put the stop-loss just above or below that shadow once the candle closes. But if there isn't a long shadow and the price goes to extreme levels, we use the ATR (Average True Range) from the last candle's closing price. As for taking profit, we follow a 1:2 risk-reward ratio. | Positions will stay open until the price reaches either the stop-loss or take profit level. |
| Moving Average | Two moving averages of 5 SMA and 20 SMA | Sell when the shorter MA crosses above the longer MA from the bottom. Conversely, buy when the shorter MA crosses the longer MA from the top. We safeguard our trade by setting the stop loss using reference points from prior extremes. For sell positions, the stop loss is positioned above the previous high, while for buy positions, it's placed beneath the previous low. Our profit target adheres to the risk-reward ratio of 1:2. | We leave the trade open until the price hits either the stop loss or take profit level. |
| Bollinger Bands | 20-period and a deviation of 2 | Enter a buy position when a full candle (with both its opening and closing prices) forms outside the upper band. Conversely, for a sell position, we enter when a full candle forms outside the lower band. Our stop loss is positioned in line with the middle band. For sell positions, the stop loss goes above the middle band, and for buy positions, it's set below the middle band. We determine our take profit levels based on a 1:2 risk-reward ratio. | We keep both our sell and buy positions open until the price reaches either the stop loss or take profit level. |
| MACD | 12,26,9 | When getting in on a trade, we look at the histogram and the crossover of MACD lines. We jump into a buy position when the histogram is in the green (positive) and the MACD signal line crosses. On the flip side, we go for a sell position when the histogram is in the red (negative) and there's a crossover of the MACD signal line. For buy positions, the stop loss is placed just below the previous lowest price, while for sell positions, it's set just above the previous high. Our take profit level is decided using a risk-reward ratio of 1:2. | We keep our entry positions open until the price hits either the take profit or stop loss level. |
Here are the backtest results after six months of testing.
Indicator | Leading | Lagging | |||
Stochastic | RSI | MA | BB | MACD | |
📊Total Trade | 191 | 70 | 167 | 67 | 190 |
💰Profit | 85 | 30 | 77 | 14 | 92 |
❌Loss | 106 | 40 | 90 | 53 | 98 |
⭕Winrate | 44.5% | 42,8% | 46,1% | 20.9% | 48,4% |
✅Average Profit | 1R | 1R | 1R | 1R | 1R |
❎Average Loss | 2R | 2R | 2R | 2R | 2R |
📈Maximum consecutive losses | 9 | 5 | 6 | 9 | 6 |
📉Maximum consecutive profits | 4 | 3 | 4 | 2 | 4 |
☑️Average Trade per month | 32 | 12 | 28 | 12 | 32 |
Total Profit in 6 months | 64R | 20R | 64R | -25R | 86R |
💠Expectancy Value | 0.335 | 0.284 | 0.383 | -0.373 | 0.452 |
From the comparison table above, there are a few important points we'll go over to compare the performance of each indicator.
- Win Rate Below 50%: Each of the indicators mentioned above has a win rate below 50%. MACD boasts the highest accuracy at about 48.4%, while the Bollinger Bands indicator has the lowest accuracy, around 20.9%. In essence, when it comes to accuracy or win rates, most indicators, both leading and lagging, hover around the 40% mark, except for Bollinger Bands.
- Maximum Consecutive Losses: During our testing, we found that the number of back-to-back losses varied quite a bit. The Stochastic and Bollinger Bands indicators had the most consecutive losses, happening 9 times each, while the RSI had the least with 5 times in a row. When it comes to consecutive wins, the highest was just 4 times and was seen with the Stochastic Moving Average and MACD. The Bollinger Bands indicator was the toughest because it only showed consecutive wins twice while experiencing nine consecutive losses, which is a big difference of 7 times.
So, if you decide to rely only on this indicator for your strategy, be ready for almost double the number of consecutive losses compared to consecutive wins. The reasons for consecutive losses in this testing were different for each indicator. Leading indicators like the Stochastic and RSI tended to have more losses when the price was trending and the signals went against the current trend. This is opposite to lagging indicators like Moving Average, Bollinger Bands, and MACD, where most losses happened when the market was moving sideways. - Average Trade per month: The number of trades made each month varies quite a bit. RSI and Bollinger Bands have the fewest, while Stochastic and MACD have the most. If you rely solely on RSI and Bollinger Bands, you won't be able to make a trade every day. On average, you'd only have about 12 trades in a month, which is roughly three per week. If you want to make more trades, you can use a Stochastic Moving Average or MACD. With these, you can make trades almost every day, about 7 to 8 times per week.
- Positive Expectancy Value: From the test results, we found that one of the indicators showed a negative expectancy, which means it's not a good choice for the long term. That indicator is the Bollinger Bands, with an expectancy value of -0.373. This contrasts with the other indicators, as they all had positive expectancy values. MACD performed the best with an expectancy of 0.452.
Although most indicators had win rates below 50%, the overall strategy remained profitable. This is because we used a smart risk-reward ratio of 1:2, meaning that one profitable trade can cover the losses of two previous trades. Over 6 months of testing, using these indicators, profits went as high as 86R, with the MACD leading, followed by the Stochastic and MA indicators with 64R. It's best to avoid using Bollinger Bands due to their negative expectancy.
I suggest mixing the indicators mentioned with additional analyses like support/resistance levels or supply/demand to make your trading more accurate. If you plan to use this strategy, it's a good idea to try it out on a demo account before moving to a real account.
See Also:
Other Things to Consider
In the end, choosing the best indicator relatively depends on the strategy, the trading style, and the level of understanding. In addition, it needs to be realized that every indicator has its own advantages and disadvantages, and the performance may depend on the user.
For those of you who want to build your own trading system but are still confused when it comes to picking the most suitable indicator, perhaps some of the criteria below can be taken into consideration:
Easy to Understand
The characteristic of a good indicator is that it is easy to understand. Nevertheless, everyone's perspective on "easy to understand" may be different, depending on their level of understanding. So, the first step is to choose the indicator you think is the easiest and not confusing.
Technical indicators are limitless and it is impossible to master all of them. Therefore, ensure that your chosen technical indicators can help you simply read the signals.
On the other hand, if you feel that the indicators cause more confusion and are hard to understand, there are two possibilities to consider: Your understanding of the indicators is lacking, or the technical indicators are unsuitable for your trading style, resulting in frequent errors in making decisions.
In that case, you should not force yourself to use those indicators.
Practical
Next, the characteristic of a good indicator relates to the signal reading and its application in trading. Sometimes, some indicators are understandable and based on mathematical calculations that are easy to comprehend.
Unfortunately, not all of them are also easy to use. Remember, choosing the best indicator in forex trading is not determined by the level of its complexity but by its ease in helping to find the best signal.
Using complicated indicators is wasting time. You will only focus on understanding the characteristics of the indicators without getting any obvious benefits. Eventually, it will take up a lot of your time. If you think about it again, finding out other easier indicators will be much more efficient and useful.
Indicators are Merely Tools, Not the Ultimate Key to Profits
Using forex trading indicators will not determine your trading results. It should be underlined that indicators are just some tools to help you read signals. The analysis of data processing and decision-making is absolutely in the hands of each trader.
Loss or profit depends on how reliably a trader takes advantage of the right moment to open a position, which is mostly influenced by personal psychological and management skills. Indicators have little to no contribution to what causes profits and losses in forex trading.
To help you single out technical indicators worth trying, we have prepared a good insight into the three most important technical indicators you should know.


2 Comments
Gilang
Jan 29 2024
Wow! Huge thanks to the author of this article! It's a game-changer for us newbie traders, helping us decide between lagging and leading indicators. The author did a six-month experiment, using 5 indicators – 2 leading ones (Stochastic and RSI) and 3 lagging ones (MA, BB, and MACD). Averaging the win rates, the leading indicators scored a 43.65% win rate, while lagging indicators trailed a bit with a 38.47% win rate. Interestingly, MACD, a lagging indicator, had the highest win rate, and the leading indicators nailed consecutive wins.
So, I'm curious, what's the deal with leading indicators based on that data? I mean, the lagging indicator like MACD has a similar win rate, but the other lagging indicators seem to flop. Meanwhile, leading indicators like Stochastic and RSI are pretty average and almost equal. What sets the leading indicators apart?
Insigne
Jan 31 2024
Hey! In the trading world, leading indicators are something special. They give you a heads-up by providing signals or insights into potential future price movements before they actually happen. Unlike lagging indicators, which follow historical data, leading ones aim to give early signals. This helps traders make decisions in anticipation of market moves.
What sets leading indicators apart is their proactive approach to trading. They're often used to spot potential trend reversals, overbought or oversold conditions, and other signals that let traders act before everyone else. This proactive nature is gold for traders aiming to capitalize on emerging market trends and make decisions at just the right time.
But here's the kicker: if you look closely, all indicators, whether leading or lagging, usually have a win rate below 50%. Surprising, right? Pros, however, often up their game by combining leading and lagging indicators. The leading ones give future signals, while the lagging ones work with past data. Combining them makes stronger signals and can boost the win rate. (read : How to Combine Forex Indicators Like A Pro )