 Dedicated FREE FOREX VPS
 Free FOREX Virtual Private Server
 MT4 Demo Contest, Get $500
 Sign Up for an Account, Claim 60% Deposit Bonus
 Free MT4/MT5 VPS 2024
 Send E-mail and Get Free Merchandise
 $1K Refer a Friend Bonus for Pepperstone Pro clients
 Maximize Your Earnings with 100% Deposit bonus
 Trade to Win, $5,000 Monthly Demo Contest
 Claim 30% + 15% Deposit Bonus from LiteFinance
The 3 EMA crossover strategy is a trend trading strategy that utilizes three EMA indicators with different time periods. How reliable are the signals?
An EMA crossover occurs when two or more different EMA lines cross each other. The crossover doesn't predict future trends but rather shows the ongoing direction of a trend. That being said, an EMA crossover might actually give a signal that a trend could be ending and will soon be replaced by a new trend.
In this article, we will reveal the secrets to using the 3 EMA crossover strategy to trade like a pro. This strategy uses three Exponential Moving Averages (EMAs) with different time periods to identify trend reversals and breakouts.
The three EMAs involved in this strategy are:
- The short-term 10 EMA, acts as the momentum indicator.
- The medium-term 25 or 30 EMA, defines the zones of value.
- The long-term 50 EMA, signals the longer-term trend.
If you are looking for a powerful trend trading strategy that can help you consistently make profits, then the 3 EMA crossover strategy is for you. Read on to learn more about this powerful strategy and how you can start using it today.
Contents
Trading with 3 EMA Crossover Strategy
The first thing you should remember is that this strategy is best applied to trending markets. After that, you may activate the three EMAs on the chart. In this case, we will use a 10-day, 30-day, and 50-day EMA. Now, see the position and movement of each EMA and compare it with the other EMAs and/or the price action.
- If the price is above all the EMAs, this indicates an uptrend and rising momentum. Contrarily, if the price is below all the EMAs, this indicates a downtrend and falling momentum.
- If the 50 EMA is above the 10 and 30 EMA, this indicates that the market has lost short-term momentum. Subsequently, if the price moves below the 50 EMA, this is a potential signal of reversal from a longer-term uptrend into a downtrend.
- If the 10 EMA crosses above the 30 EMA which is positioned above the 50 EMA, this is a signal for you to enter a long position. If the 10 EMA crosses below the 30 EMA which is positioned below the 50 EMA, this is a signal for you to enter a short position.
- If the 10 EMA crosses above the 30 EMA which lies below the 50 EMA, this signals a longer-term downtrend is potentially reversing into a longer-term uptrend. If the 10 EMA crosses below the 30 EMA which lies above the 50 EMA, this is a possible signal that a longer-term uptrend is reversing into a longer-term downtrend.
Now that you get the main ideas of using three EMAs, let's take a look at how to use them in the chart. This strategy can be implemented on any currency pair and any time frame, although we suggest the 15-minute chart or longer.
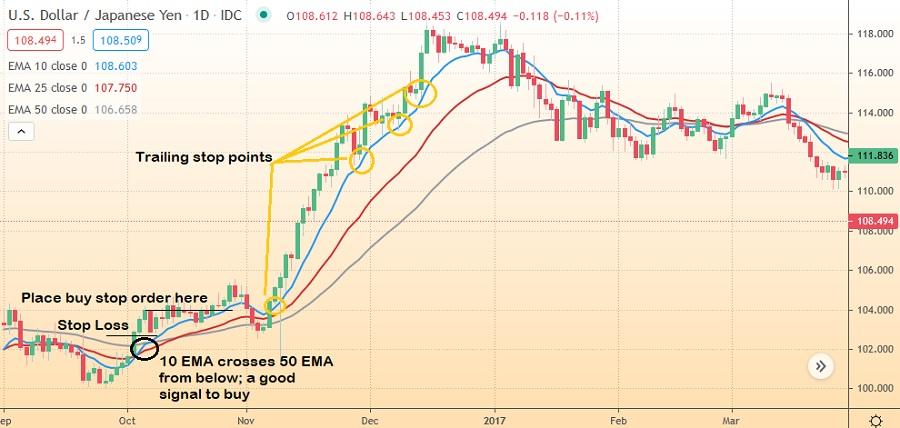
Rules for Long Position
- After the 10 EMA crosses the 50 EMA from below, place a buy stop order 2-5 pips above the high of the candlestick that has a lower high than the previous candlestick.
- The order will be activated once the next candlestick breaks the high of the previous candlestick. If this doesn't happen, keep adjusting the position based on the new lower high until the high is broken.
- Place a stop loss order 2-5 pips below the low of the entry candlestick. If you find a swing low nearby, place a stop loss order a few pips below it.
Let's see the chart below to better understand the strategy.
Rules for Short Position
- After the 10 EMA crosses the 50 EMA from above, place a sell stop order 2-5 pips below the low of the candlestick that has a higher low than the previous candlestick.
- The order will be activated once the next candlestick breaks the low of the previous candlestick. If this doesn't happen, keep adjusting the position based on the new higher low until the low is broken.
- Place a stop loss order 2-5 pips above the high of the entry candlestick. If you find a swing high nearby, place a stop loss order a few pips above it.
Profit Target and Risk Management
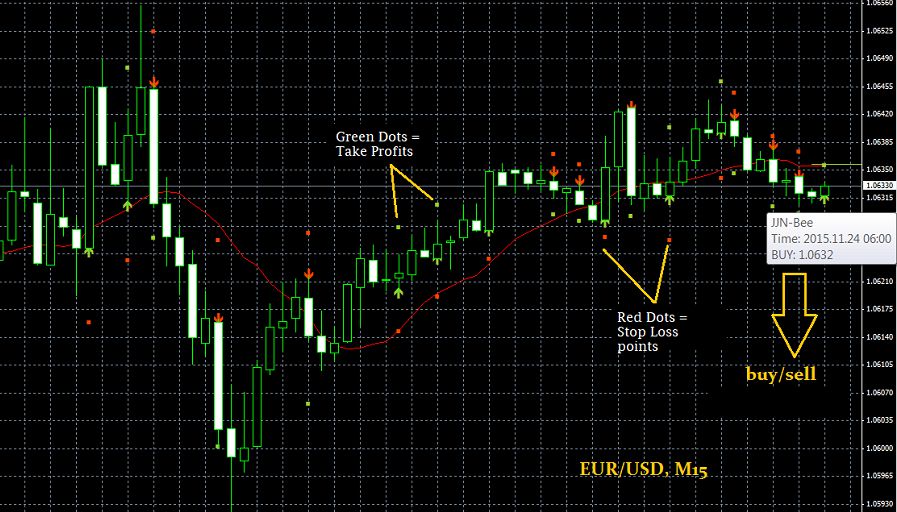
As mentioned above, you can use the swing low and swing high levels like the support and resistance to determine your profit target. Alternatively, you can take profits by using a trailing stop. This way, you can ride out the trend until it loses momentum. For a short position, place your trailing stop above each lower high, and for a long position, place your trailing stop below each higher low. Since trailing stop orders only move in one direction, you will limit your losses in the event of a trend reversal.
Why Use 3 EMAs Together?
The three EMAs can give stronger confirmation than just two EMAs crossover. It can also give a better context to the price action in relation to the three EMA lines displayed on the chart. Three EMAs crossing above the price at the same time is a strong bullish signal, while three EMA crossing below the price at the same time is a strong bearish signal.
These EMAs can also be used to define the best entry and exit levels since the three indicators represent the market trend and price momentum on the chart. A crossover between the short-term EMA and long-term EMA serves as a signal to enter a position. Meanwhile, the medium-term EMA indicates a zone of values for possible mean reversion. This means that when the price strays too far, it will eventually return to the medium-term EMA line.
Since the three EMAs display the direction of trend and momentum, we can create our risk-to-reward ratio by using stop losses, trailing stops, and profit targets. We can also confirm whether the short-term EMA has the same trend direction as the long-term EMA and whether it has the momentum to continue moving in that direction. For example, if the price is below the 10 EMA but above the 50 EMA, this can be a signal of a trend reversal.
Pros and Cons of the 3 EMA Crossover Strategy
The Exponential Moving Average is a popular indicator among trend traders, and this strategy maintains all the benefits you can get from the EMAs. It is uncomplicated and easily applicable even though it uses three such indicators at once. Also, the three EMAs help increase the reliability of this strategy, especially in a trending market.
But this strategy naturally carries with it the typical disadvantages associated with an EMA. The first one is that an EMA is a type of lagging indicator, meaning that the trend has already taken place before the EMA line is formed. Secondly, since it relies heavily on EMAs, this strategy is not for range markets. False signals will appear one after another in that condition, so it is for your own good to avoid entering a trade.
An Important Note
You might still be wondering why we shouldn't open a trade once the 10 EMA crosses the 25 EMA. Instead, we place a pending order (sell stop or buy stop) after a cross between the 10 EMA and 50 EMA. This is because the idea behind this strategy is to trade on a return to the previous trend after a retracement occurs, which happens after the EMA crossover.
In addition, the 50 EMA line acts as support or resistance when the price is above or below it. Thus, the 10 EMA must cross the 50 EMA before we open trade to ensure that the price doesn't move beyond the 50 EMA line. More importantly, don't try out this strategy in a real account if you're a first-timer. Instead, see how it works in a forex demo account before using it for real.


5 Comments
Frendy
Nov 22 2023
Hey ah, I'm just a little curious about the trading tips using cross MA mentioned in the article. It says that instead of immediately opening a trade when the 10 EMA crosses the 25 EMA, it's better to place a pending order (like a sell stop or buy stop) after a cross between the 10 EMA and 50 EMA. The idea is to trade on a return to the previous trend after a retracement, which happens after the EMA crossover.
So, what exactly is a pending order, and how is it different from other types of orders?
John Bill
Nov 25 2023
Hello, let me explain to you a litle bit about pending order. A "pending order" in trading is an instruction to execute a trade once the price reaches a specific pre-defined level. It's like setting up a trade in advance, and the order is only activated when the market reaches the price you've specified.
Now, the key difference between a pending order and other types of orders lies in when they are executed.
Hope it can help!
Udin
Nov 27 2023
Hey, just throwing in a bit more info. I mean, the explanation covers everything about pending orders. If you're looking to roll with the cross EMA strategy like the article suggests, you gotta make sure your broker offers this pending order thing. Good news, though – most brokers provide the option for traders to drop pending orders. It's like a standard feature on their trading platforms. Being able to set up pending orders is a game-changer for traders. It lets them plan and automate trades based on certain conditions, even if they're not glued to the market. So, if a broker doesn't offer this order, it's kinda falling short, you know? To nail this strategy, you gotta be in the loop about cross EMA, pending orders, and pick a broker that's got your back on this strategy.
Fuad
Jan 20 2024
According to the article, it suggests refraining from immediately opening a trade when the 10 EMA crosses the 25 EMA. Instead, the recommendation is to set a pending order (either a sell stop or buy stop) following a cross between the 10 EMA and 50 EMA in the comprehensive 3 EMA crossover strategy. I'm interested in understanding more about this pending order mentioned in the article. How does it differ from the usual orders I typically use? Additionally, is it advisable for beginners to consider implementing this approach? Thank you!
Ramos
Jan 23 2024
Hey there, about your question, the main difference from usual orders lies in the timing. Instead of executing the trade immediately, you wait for a subsequent movement to confirm the crossover trend. This method aims to filter out false signals and ensure a more established trend before entering a trade.
As for its suitability for beginners, it depends on the individual's comfort level and understanding of trading strategies. While the pending order approach can add a layer of confirmation, beginners should thoroughly understand the strategy, practice with it in a demo account, and gradually implement it in live trading. It's advisable to start with small positions and manage risk carefully to gain experience and confidence. Additionally, seeking guidance from experienced traders or financial advisors can be beneficial for those new to trading strategies. You can read this article to find more information about the pending order and the other order: The Simple Guide to Types of Orders in Forex Trading