 Dedicated FREE FOREX VPS
 Free FOREX Virtual Private Server
 MT4 Demo Contest, Get $500
 Sign Up for an Account, Claim 60% Deposit Bonus
 Free MT4/MT5 VPS 2024
 Send E-mail and Get Free Merchandise
 $1K Refer a Friend Bonus for Pepperstone Pro clients
 Maximize Your Earnings with 100% Deposit bonus
 Trade to Win, $5,000 Monthly Demo Contest
 Claim 30% + 15% Deposit Bonus from LiteFinance
Analyzing the patterns of price movement is important to gain insight into which trade you should enter to earn profits. However, trying it without first understanding the basic principles of technical analysis would be worthless.
Technical analysis in forex trading refers to attempts to analyze the patterns of price movement in order to predict the subsequent price movement. Traders who like to use technical analysis are commonly called technicalist or chartist. A technicalist tends to ignore the driving force behind price movement, and focuses on the most recent movements. The opposite of a technicalist is a fundamentalist who tries to predict price movement by analyzing news on several economic indicators.
To understand more about technical analysis, you need to understand its three basic principles first. What are the three basic principles of technical analysis? To better understand the principles, let's take a look at what they are:
- The entire cause of price movement has been expressed in the pattern of price movements themselves.
- Price always move to follow the trend within certain limits.
- The history of price movement patterns will always repeat itself.
For further elaboration on the three principles, you can read the explanation below.
Three Principles of Technical Analysis in Forex Trading
There are approximately three principles that underlies technical analysis in forex trading; they are:
The Entire Cause of Price Movement has Been Expressed in The Pattern of Price Movements Themselves
The influence of economic data releases, changing political stability, market sentiment, as well as changes in supply and demand, are reflected in the pattern of price movement on trading chart. Therefore, in his attempts to predict the direction of price movement, a genuine technicalist only focuses on the most recent patterns and the changes in technical indicators; not on what could possibly happen as the impact of certain news releases.
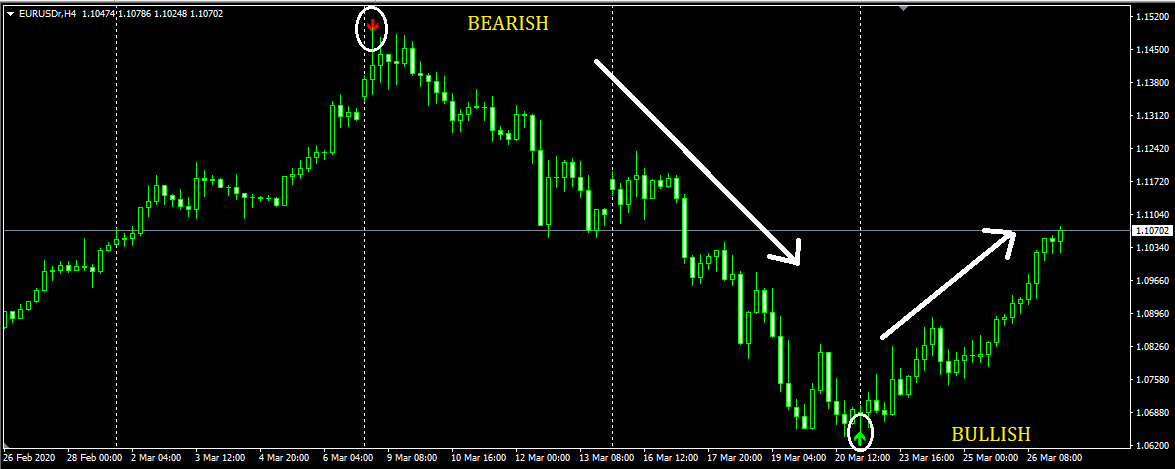
Price Always Moves to Follow the Trend Within Certain Limits
One of the most important purpose of technical analysis is determining the direction of future price movement, be it in short, mid, or long-term. In this sense, there are three probable circumstances: trend continuation, trend reversal, and sideways (ranging). Trend continuation refers to a steady direction of price movement. Trend reversal, on the other hand, is when the price movement tend to reverse its direction. While sideways is when price moves up and down within a certain range (that's why it is also called as 'ranging'.

Before applying a certain technical indicator, technicalist usually draw lines to connect lowest prices or highest prices, which is called 'trend lines'. Apart from that, the trend will continue to go on or reverse, after it touched certain price limits, that is support and resistance level. Likewise, in case of sideways, the penetration of support or resistance level signals the occurence of trend. To know where those limits exist, technicalist draw support and resistance lines which are believed as a consensus among market players.

Apart from support and resistance level, there are also psychological numbers. It refers to a round figure that is used as reference by market players.
The History Of Price Movement Patterns Will Always Repeat Itself
Technicalist believes that pattern of price movements in the past will be repeated, and could happen again now. The more often a chart pattern occur, then the greater its probability of truth. The pattern could also formed by candlestick bar in its many variations.
The Theories Behind Technical Analysis In Forex Trading
Aside of trend, chart pattern, and candlestick bar formation, technical analysis in forex are based on:
1. Mathematical Theory
Mathematical theory is used in indicators such as Moving Average. Moving Average is an extremely popular indicator that helps trader to understand the overall pattern of price movement by smoothing out price fluctuations. It is also called as lagging indicator, because it is created by making an average of past prices. It is commonly featured in trading platforms.

2. Arithmetics
An example of Arithmetics in technical analysis is Fibonacci Retracement. Fibonacci Retracement is an attempt to retrace the origin of price movement. It uses lines to identify areas of support or resistance at key Fibonacci levels. The levels are made by drawing trendline between two extreme points, then divide the vertical distance by key Fibonacci ratios of 23.6%, 38.2%, 50%, 61.8%, and 100%.
3. Wave Theory
Price movement are found in its repeating up and down patterns that resembles waves. Traders recognize these patterns and used it through some means to predict future movements. It features prominently on Elliot Wave.
4. Gap Theory
Technical analysis using high-low-open-close prices is basically using gap theory. The 'gap' refers to the change in price levels between close and open prices in two consecutive days. It is not as easy as it sounds, that's on of some reasons why it is not very common to be used by forex traders.
Apart from several indicators mentioned above, there are still many more technical indicators you could use in forex trading. Just look for them on the net or in discussion forums.
Using Technical Indicators
One thing you should understand is that all indicators are good. But whether they can lead you to successful trading or not, it depends on your understanding of them. Each indicators have their own advantages and disadvantages. If you feel comfortable with one or two, then use it. If you haven't feel satisfied with any of them, then customize it to your preferences.
The large numbers of technical indicators may confuse you. How many indicators should I understand? How many indicators should I put on the chart? A trader said that it is quite sufficient to use one indicator to see the trend, another one to see the momentums, and another one to identify the limit of support-resistance. Another trader feel satisfied with only one indicator -customized to his taste. Another one prefers naked trading. In short, which indicators you use and how you do your technical analysis is up to you.


2 Comments
Yudha
Nov 8 2022
I have some question that I want to share so much because lately I think about these:
Sharma Roy
Nov 16 2022
Thanks for asking the question. I can share my opinion. I think that technical analysis seeks to predict price movements by examining historical data, mainly price and volume. It helps traders and investors navigate the gap between intrinsic value and market value using techniques such as statistical analysis and behavioral economics.Technical analysis is a more reliable method than fundamental analysis for predicting future price movements, at least when applied to trends / momentum. , it is possible and you can also use technical analysis in long-term trading to help you time the market. Technical analysis uses price action, such as trading volume or stock price increases, to help drive trading decisions.