Dedicated FREE FOREX VPS
 Free FOREX Virtual Private Server
 MT4 Demo Contest, Get $500
 Sign Up for an Account, Claim 60% Deposit Bonus
 Free MT4/MT5 VPS 2024
 Send E-mail and Get Free Merchandise
 $1K Refer a Friend Bonus for Pepperstone Pro clients
 Maximize Your Earnings with 100% Deposit bonus
 Trade to Win, $5,000 Monthly Demo Contest
 Claim 30% + 15% Deposit Bonus from LiteFinance
If you're looking for a technical indicator that could help you decide where to enter and exit the market during a trending market, this one's for you.
Parabolic SAR (PSAR) is a technical indicator that was developed by Welles Wilder in 1978. It was first mentioned in one of his books called New Concept in Technical Trading Systems. SAR stands for "stop and reserve", which means the indicator can signal where the price might stop and change direction. In other words, it can be used to identify potential reversals and determine entry and exit points. This is why Parabolic SAR is mainly used in trending markets and is often called a lagging (trend-following) indicator.
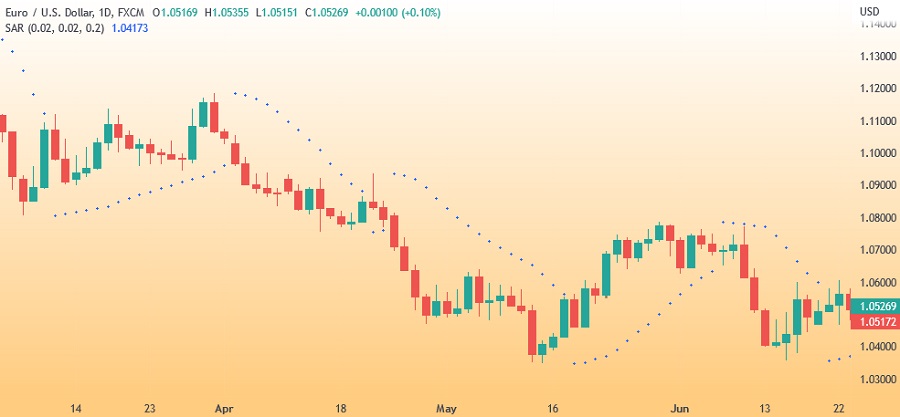
Drawing the Parabolic SAR indicator manually might take a while because the calculations are pretty complex. Luckily, the indicator is now mostly available on modern online trading platforms, like MetaTrader 4 and MetaTrader 5. You simply need to apply the indicator on the chart and use the signals to make trading decisions. The Parabolic SAR indicator is typically displayed as a series of dots that appear near the candlesticks. Here's what the indicator looks like on a platform.
Contents
The Main Functions of Parabolic SAR
In forex trading, Parabolic SAR can be used for several different purposes, namely:
Identifying the Direction of the Trend
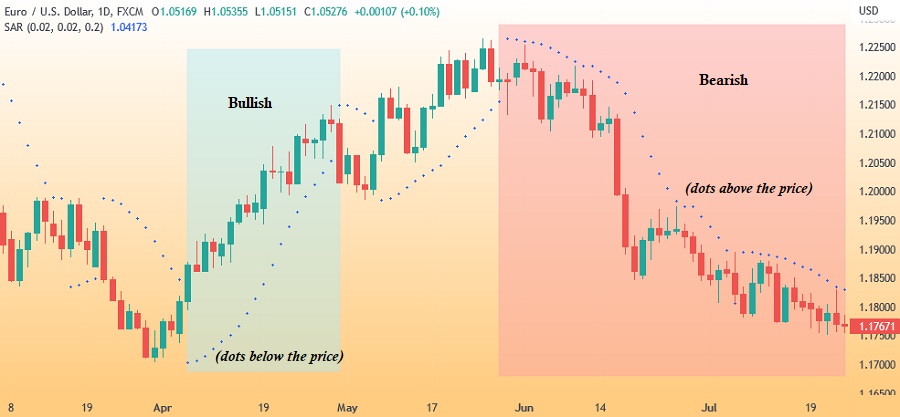
Using Parabolic SAR to determine the market trend is very easy. SAR dots can occur near the candlesticks, so in order to determine the market trend, you simply need to see the dots' location, whether it's above or below the candlesticks. If they appear below the candlestick, it can be interpreted as a bullish signal. On the contrary, if they appear above the candlestick, it can be interpreted as a bearish signal.
Determining the Entry Point
Finding an entry point with Parabolic SAR is a little bit more complicated than determining the market trend because there are several steps that you should follow.
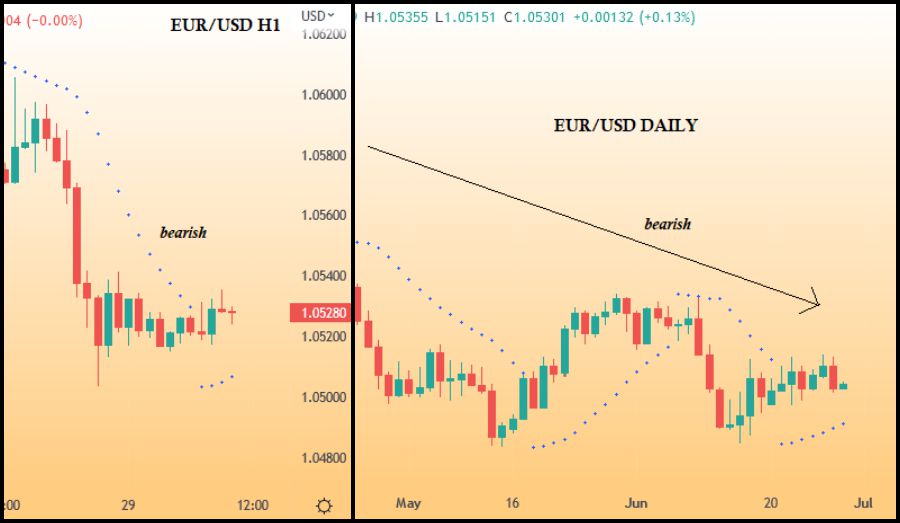
According to J. Welles Wilder himself, the first thing to do before entering the market is to figure out the current trend in a higher time frame. So, if you want to trade EUR/USD in the H1 time frame, you'll need to see the market trend in the D1 chart. If you find that in the D1 chart the dots are below the candlesticks and the price is in an uptrend, then you can see it as a signal to open a Buy position in the H1 chart. The same rule also applies in the opposite condition; open a Sell position in the lower time frame if you find that the trend in the higher timeframe is going downward.
Apart from that, Wilder also mentioned that in order to avoid opening the wrong position during market consolidation, traders need to wait for three consecutive dots before entering the market.
Locating the Exit Point
Last but not least, the Parabolic SAR can also be used to determine exit points and stop losses. If you see a candlestick closing in on the SAR, then you should prepare to close your position because it indicates that the trend is about to change direction after that. If you want to use the SAR as stop loss, then use the first dot that signifies the turning point as a target.
Parabolic SAR can also be used as a guide for manual trailing stops. You simply need to replace the stop loss manually following the SAR points. Several EA developers even use this concept and program it into their robot systems, so traders can use it automatically.
The Pros and Cons
Parabolic SAR is a popular technical indicator with various uses. The best thing about this indicator is its trend-following aspect. It can tell us when the market is currently trending and moving in a certain direction. It can also signal when the price will reverse or change direction.
While Parabolic SAR works well in certain conditions, it might fail during consolidations. When this happens, the SAR will typically move uncertainly, swinging from the top to the bottom and vice versa. This could happen for days depending on the market and might produce a number of false signals.
To prevent such losses, it's highly suggested to only use Parabolic SAR when the trend is strong and avoid using it when the trend is unclear. Also, it would be helpful to use other indicators and combine the signals for a more accurate analysis.