Dedicated FREE FOREX VPS
 Free FOREX Virtual Private Server
 MT4 Demo Contest, Get $500
 Sign Up for an Account, Claim 60% Deposit Bonus
 Free MT4/MT5 VPS 2024
 Send E-mail and Get Free Merchandise
 $1K Refer a Friend Bonus for Pepperstone Pro clients
 Maximize Your Earnings with 100% Deposit bonus
 Trade to Win, $5,000 Monthly Demo Contest
 Claim 30% + 15% Deposit Bonus from LiteFinance
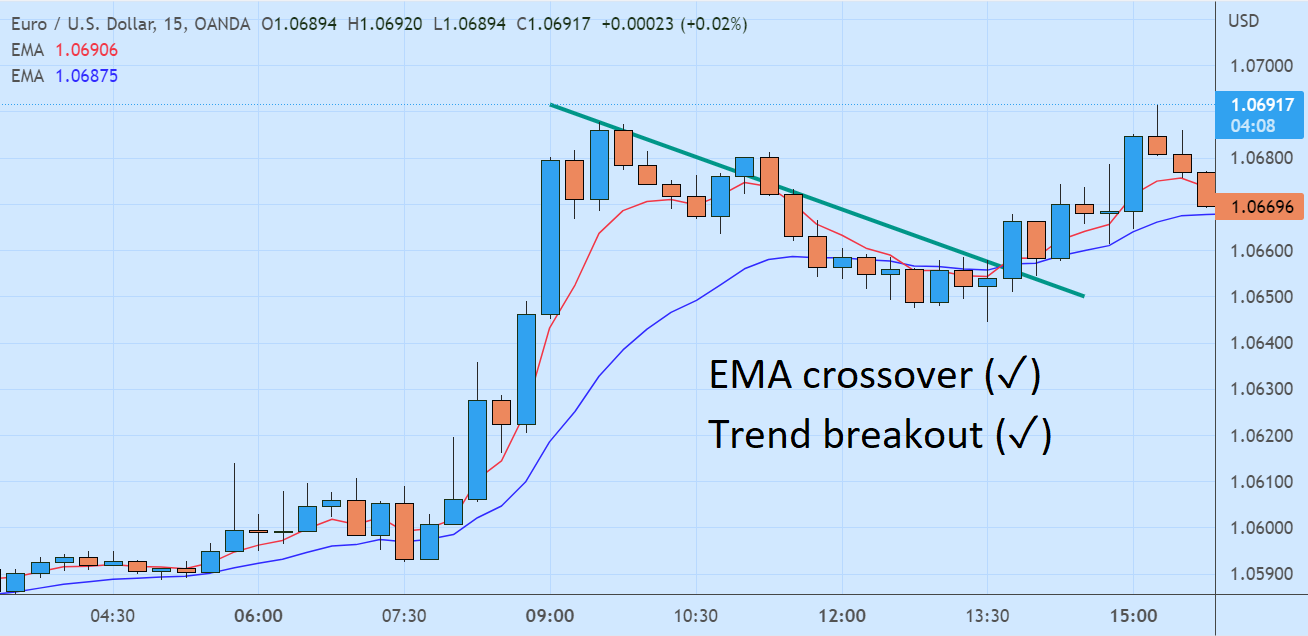
The EMA crossovers are not fully reliable as trading signals. To prevent fake signals, we could draw trendline on the chart.
The Exponential Moving Averages (EMA) lend greater weight to recent price data than the Simple Moving Averages (SMA), allowing it to react and move faster. As such, the EMA is commonly used as the cornerstone of scalping strategies in stock, futures, and FX.
Most traders arrange their scalping strategy based on the relative position of a shorter-term EMA in respect to a longer-term EMA. For example, the 5 and 15 EMA Crossover strategy would trigger a long position when the 5 EMA crosses or continues above the 15 EMA. Conversely, the two EMAs crossover would trigger a short position when the 5 EMA crosses or remains below the 15 EMA.
Such techniques allow traders to identify trading opportunities in lower time frames. However, the EMA rarely constitutes the entirety of a trading strategy because it is more reliable to combine EMA with other technical indicators. Some traders would combine EMA and momentum or volume indicators, but the most prevalent is combining EMA and trendline.
Now, the question is how to combine EMA and trendline to achieve greater results for your scalping strategy? There are lots of ways you can choose.
First, you can make use of a trendline to confirm whether a market is in a bullish/bearish trend or has entered a ranging area. Trade only when you are sure that the market is in a trend because the EMA is not suitable for ranging market.
When you have determined the trend, you could then set up multiple EMAs of your choice to spot trading opportunities. It could be the 5 and 15 EMA, the 10 and 20 EMA, or other popular combinations. In this scenario, you should only execute trading signals that are consistent with the established trend.
Second, you can use trendline as a confirmator for EMA crossovers in order to trade against the trend.
EMA crossovers can trigger long and short positions. However, EMA crossovers are not fully reliable as trading signals, especially when we try to trade against the trend. To prevent "fake signals", we could draw trendlines on the chart and establish rules such as: enter the market only when EMA crossovers are accompanied by breakouts around established trendlines.
See several charts below for screenshots of real market examples.
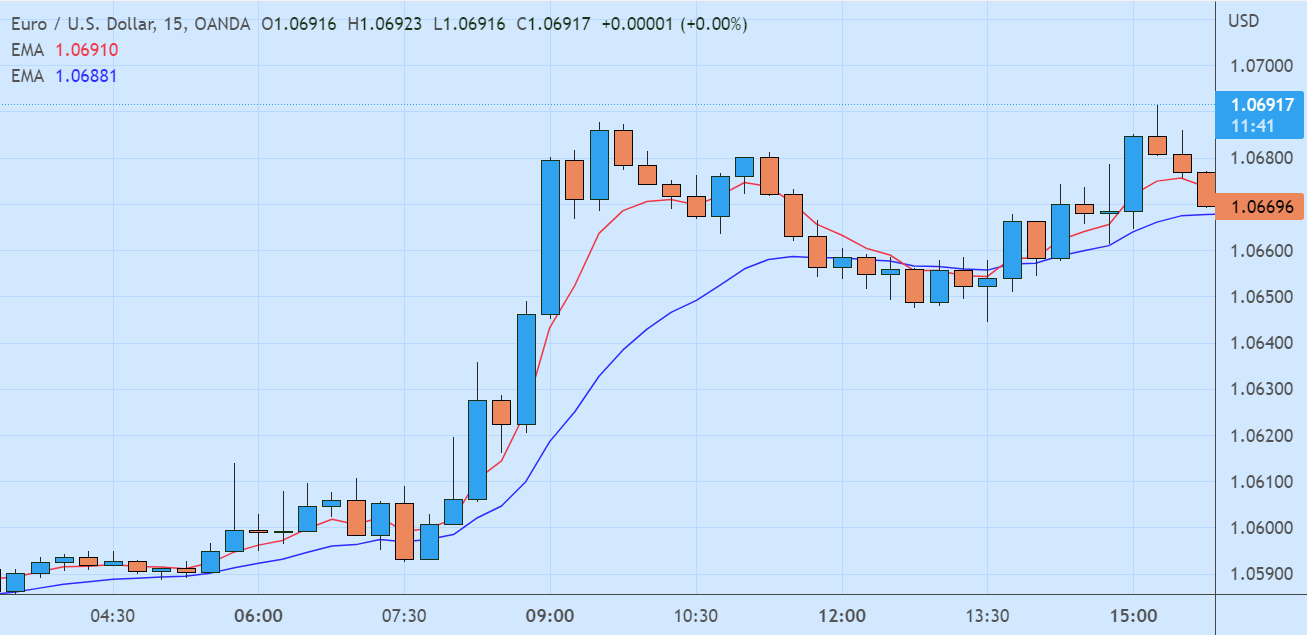
We could see there were two EMA crossovers on the EUR/USD 15 minutes chart, both occurred between 12:00-13:30. The first signaled a short entry, and the second signaled a long position.
The first EMA crossover didn't necessarily need a confirmator, because it went along the established trendline. We could see that it bounced down exactly on the trendline. You could probably scalp around 5 pips from a short position here, or else, cancel it due to the appearance of the second crossover.
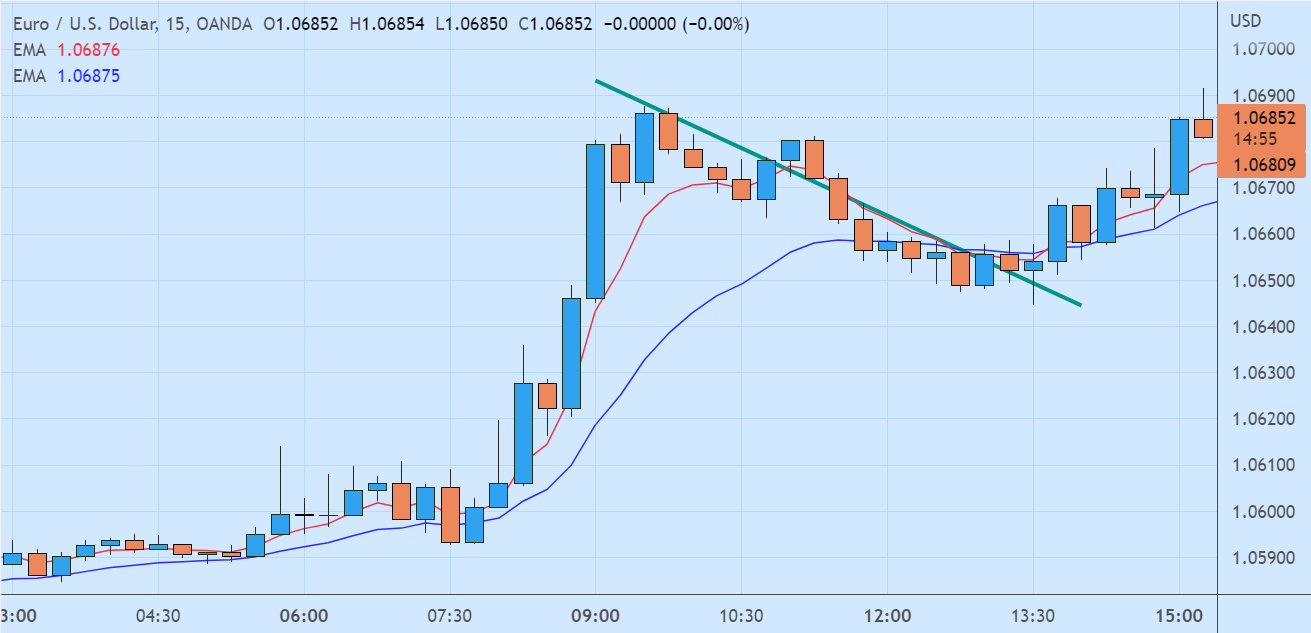
The second EMA crossover needed confirmation because it went against the trend. When it broke out of the trendline, it presented a perfect entry opportunity. You could open a buy position targeting the previous high above 1.0680, or any other profit target in accordance with your risk management setup.
Quite simple, isn't it!? Despite the simplicity, don't underestimate this method because you can use any indicator -both simple and complicated- to improve your trading results as long as you master it well. Be sure to combine EMA and trendline for trading in a demo account first before applying it in your real account.