Dedicated FREE FOREX VPS
 Free FOREX Virtual Private Server
 MT4 Demo Contest, Get $500
 Sign Up for an Account, Claim 60% Deposit Bonus
 Free MT4/MT5 VPS 2024
 Send E-mail and Get Free Merchandise
 $1K Refer a Friend Bonus for Pepperstone Pro clients
 Maximize Your Earnings with 100% Deposit bonus
 Trade to Win, $5,000 Monthly Demo Contest
 Claim 30% + 15% Deposit Bonus from LiteFinance
Finding trading signals can be done in many ways. One of them is using the 4-hour trading strategy with MACD. Here's how it's done.
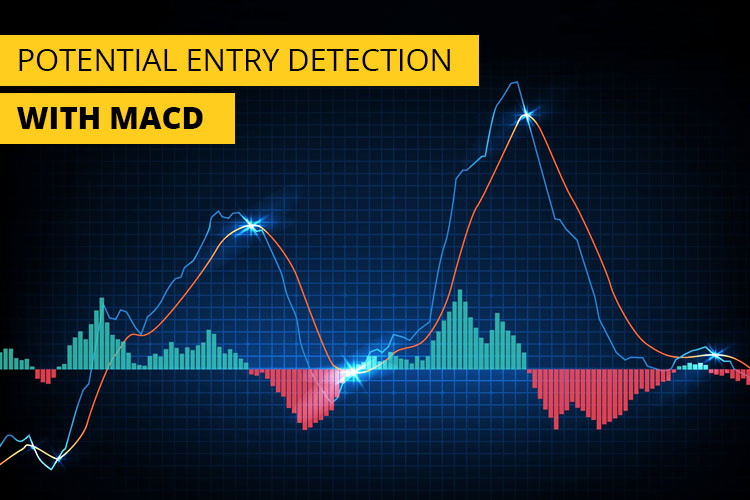
The Moving Average Convergence Divergence (MACD) indicator is a commonly used tool in trading analysis. It assists traders in identifying and predicting the strength and sustainability of trends, while also providing trading signals related to market momentum.
In this article, we will discuss a 4-hour trading strategy that utilizes the MACD indicator. This strategy aims to help traders identify medium-term trends and capitalize on significant price movements.
Here are the specific settings for the MACD indicator in this strategy:
- Fast EMA on MACD: 5
- Slow EMA on MACD: 13
- MACD Signal Line: 1
To simplify the implementation of the MACD indicator on the H4 chart, you can follow these steps along with the accompanying explanatory images. By following these steps in the correct order, you can ensure a successful implementation of the MACD indicator on the H4 chart.
4-Hour MACD Forex Strategy Implementation
The MACD indicator offers versatility for various trading strategies. However, this 4-hour strategy primarily emphasizes trend continuation monitoring. To maximize its potential, traders should follow these steps:
1. Use 4-hour Time Frame (H4)
To begin this strategy, adjust the chart to display a 4-hour time frame. Simply click on the time frame option on the chart and select H4.
By utilizing a suitable time frame, traders can enhance their ability to identify patterns and trends, leading to increased accuracy in trading signals.
2. Set up the Moving Average
In the second step, set up five Moving Averages with varying periods. To do this, traders need to click on the indicator tab and select Moving Average five times.
Then, configure three Moving Averages as Exponential Moving Averages (EMA) with periods of 365, 21, and 8, respectively. The other two Moving Averages should be set as Simple Moving Averages (SMA) with periods of 200 and 89.
3. Set up the MACD Indicator
The third step in this 4-hour strategy involves configuring the MACD indicator. Traders should set up the MACD according to the previously mentioned settings described in the introduction. If using a TradingView chart, the specific settings for the MACD indicator are as follows:
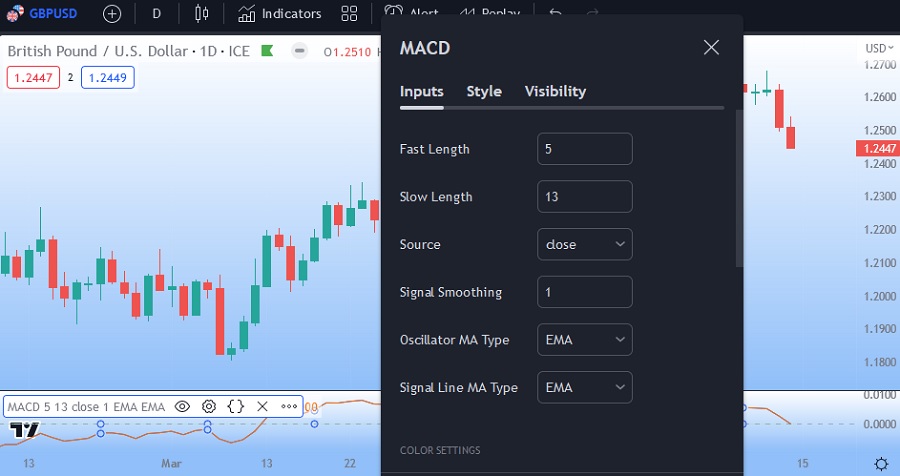
4. Set up the MACD Indicator
To identify potential bullish signals, traders should ensure that the 5 Moving Averages (MAs) are well-distributed and in sequential order from EMA 8, EMA 21, SMA 89, SMA 200, to EMA 365. Additionally, the price should be above EMA 365, SMA 200, and SMA 89 to strengthen the bullish signal.
On the other hand, to identify potential bearish signals, traders need to ensure that the five Moving Averages (MAs) are positioned in the order of EMA 8, EMA 21, SMA 89, SMA 200, and EMA 365 from bottom to top. The price should be below EMA 365, SMA 200, and SMA 89 to reinforce the bearish signal.
5. Observe the MACD Indicator
The information provided by the MACD should be relevant to the bullish or bearish potential identified in the previous step. MACD actually serves as the final confirmation of bullish and bearish signals.
Before traders proceed to the entry stage, the following MACD confirmations should be noted:
- Potential Bullish Signal: The MACD histogram should move from below to above the zero line. The histogram may show a tendency to retrace downward or sideways, but its position must remain above the zero line and tend to rise again.
- Potential Bearish Signal: The MACD histogram should move from above to below the zero line. The histogram may show a tendency to retrace upwards or sideways, but its position should remain below the zero line.
6. Entry Buy and Sell
For a clearer understanding, here are the conditions that must be met before entering a buy position:
- The five Moving Averages are well-distributed in the order of EMA 8, EMA 21, SMA 89, SMA 200, and EMA 365 from top to bottom.
- The price is above EMA 365, SMA 200, and SMA 89.
- The MACD histogram is transitioning from below to above the zero line.
- The MACD histogram, even if sloping downward or sideways, should remain above the zero line.
On the other hand, be aware of the following conditions for short positions:
- The five Moving Averages are well-distributed in the order of EMA 8, EMA 21, SMA 89, SMA 200, and EMA 365 from bottom to top.
- The price is below EMA 365, SMA 200, and SMA 89.
- The MACD histogram is transitioning from above to below the zero line.
- The MACD histogram, even if showing a tendency to retrace upward or move sideways, should remain below the zero line.
For an example illustrating the application of this strategy, please refer to the image below:
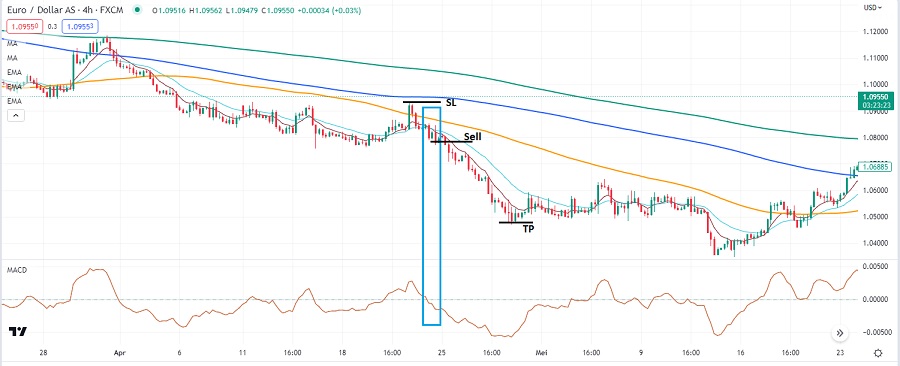
7. Stop Loss and Take Profit
An essential step in any strategy is establishing an exit plan with Stop Loss and Take Profit levels. For Buy positions, place the Stop Loss just below the low of the candlestick that aligns with the entry signal from MACD. Conversely, for Sell positions, target the Stop Loss just above the high of the candlestick corresponding to the entry signal from MACD.
To achieve a risk/reward ratio of 1:2, traders can set the Take Profit level to be at least double the Stop Loss risk. It is crucial to understand that Stop Loss and Take Profit levels can be customized based on individual trader preferences and risk management strategies.
Summary
The 4-hour MACD Forex Strategy is a trend-following strategy that uses the MACD indicator to identify potential bullish and bearish signals. Traders set up five Moving Averages and the MACD indicator in a 4-hour time frame.
If a bullish signal is confirmed, traders enter a buy position with a Stop Loss just below the low of the candlestick that aligns with the entry signal. The Take Profit level should be set to at least double the Stop Loss risk. The same applies to bearish signals.
Using the MACD strategy is not limited to only H4 charts, it can also be applied to 15-minute charts. You can read the best MACD strategy for 15-minute charts below.