 Dedicated FREE FOREX VPS
 Free FOREX Virtual Private Server
 MT4 Demo Contest, Get $500
 Sign Up for an Account, Claim 60% Deposit Bonus
 Free MT4/MT5 VPS 2024
 Send E-mail and Get Free Merchandise
 $1K Refer a Friend Bonus for Pepperstone Pro clients
 Maximize Your Earnings with 100% Deposit bonus
 Trade to Win, $5,000 Monthly Demo Contest
 Claim 30% + 15% Deposit Bonus from LiteFinance
A short term trading strategy with simple indicators, the 5-minute strategy with EMA is a complete trading setup with a way of managing risks and optimizing profits from the price momentum.
Experienced traders will wait until the setup is perfect before opening positions. And then there are those who will make a move upon seeing a hint of change in trend direction. These are the momentum traders; quick to ride on trend reversal but quick to exit positions as well. If you are one of them, you need a solid strategy to enter and exit the market at the best possible time. The 5-minute strategy with EMA below can help you ensure the profit while simultaneously increasing it.
The Setup
This is a momentum strategy that aims to gain profits from changes in trend direction. The strategy involves the following indicators:
- 20 EMA
- MACD
A 5-minute chart is used to look for momentums in a very short term. On the chart, activate the two technical indicators, the first of which is the 20-period EMA (Exponential Moving Average) to help determine trends. The EMA places more weight on recent prices, thus it is more sensitive to price movements compared to the SMA (Simple Moving Average). The second indicator is the MACD to confirm the momentum. We use the default setup for the MACD which is 12-period EMA and 26-period EMA as well as 9-period EMA as the signal line.
We enter a trade in two parts. Stop loss order is used in the first part to lock in profit. In the second part, the stop loss is moved to breakeven to eliminate the risk of losing. The position will remain open to extend our profit as much as possible until the trailing stop is triggered. To implement this strategy, it will be really helpful if your broker offers a platform that supports automated entries, exits, stop loss, as well as trailing stops.
Rules for Long Position
For a long position, wait until the price crosses above the 20-period EMA and the MACD has crossed to positive within the last five bars (25 minutes). Then, follow the steps below.
See Also:
- Enter long 10 pips above the 20-period EMA.
- Set the initial stop loss 20 pips below the 20-period EMA. Alternatively, we can set the initial stop loss at the lowest low on the chart for more aggressive trades.
- Set the first target and make sure that it is bigger than 20 pips.
- Close half the position when the first target is reached and move the stop loss to breakeven.
- Trail the stop by the breakeven point or at 15 pips below the 20 EMA; whichever is higher.
Scenario 1
On March 16, 2006, the EUR/USD occasionally moved above the 20 SMA. However, we didn't open trade since the MACD was still negative. The MACD finally crossed to positive when the price was 1.2044. The strategy was executed as follows:
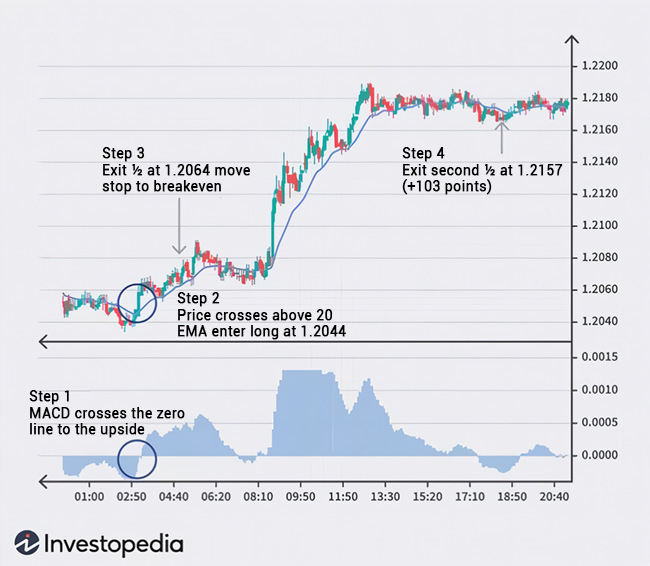
- We entered a trade at 1.2056, which was 10 pips above the EMA at that time (1.2046).
- Set the initial stop loss 20 pips below the EMA, which was 1.2046 - 20 pips = 1.2026.
- Our first target was the entry (1.2056) plus the risk (30 pips) or 1.2086, which was hit around two and a half hours later. After that, we proceed to move the stop loss to breakeven.
- We trailed the remaining half by the 20 EMA minus 15 pips. The remaining half was later closed at 1.2157 when the price moves below the 20 EMA by 15 pips. The trade generated a total profit of (30 pips + ½ (1.2157 – 1.2086)) = 65.5 pips.
See Also:
Scenario 2
The next scenario is for AUD/USD. The price crossed above the 20 EMA when the MACD was already positive, so we entered a long position immediately. We waited until the price moved above the 20 EMA by 10 pips, which occurred when the EMA was at 0.75053. Now, we followed the strategy.
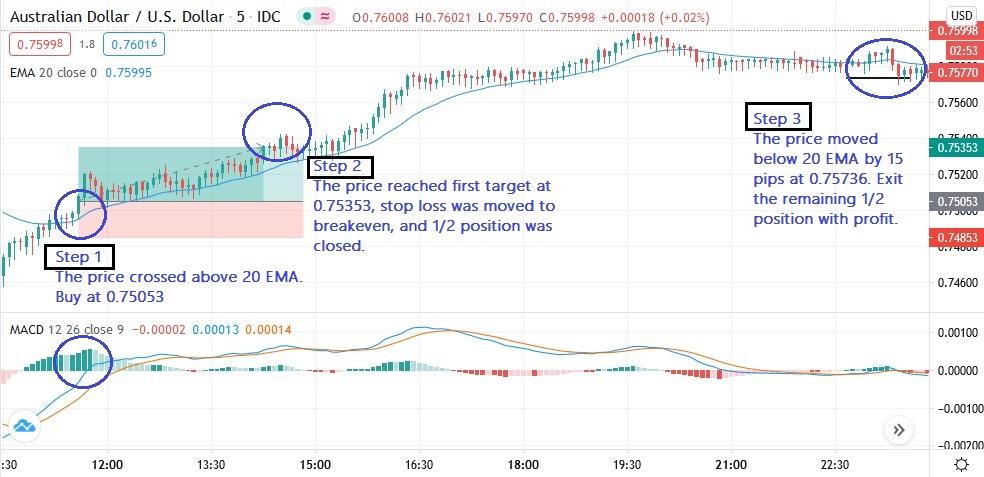
- Open trade at 0.75053, which was 10 pips plus the EMA.
- The initial stop loss was set at 20 pips below the EMA, which was 0.75053 - 20 pips = 0.74853.
- The target for the first half was 0.75053 + 30 pips = 0.75353, which was triggered two and a half hours later. Then we moved the stop loss to breakeven.
- The second half of the position was trailed by 15 pips below the 20 EMA, and was eventually closed at 0.75736 as the price crossed below the 20 EMA by 15 pips. All in all, we gained a total profit of 34 pips (30 pips + ½ (0.75736 – 0.75353)) from the trade.
Rules for Short Position
We enter a short position when the price moves below the 20 EMA and the MACD has been negative within the last 25 minutes or five bars. Afterward, apply the following rules:
- Open a sell position 10 pips below the 20 EMA.
- Set the initial stop loss 20 pips above the 20 EMA, or at the highest high on the chart for riskier trades.
- Set the first target 20 pips or more below the entry position.
- Close half the position when the first target is reached and move the stop loss to breakeven.
- Trail the stop by the breakeven point or at 15 pips above the 20 EMA; whichever is lower.
Scenario 1
The 5-minute chart below is the NZD/USD on March 20, 2006. The price movement and MACD crossing didn't occur simultaneously at first, so we had to follow the chart closely. The currency traded below the 20 EMA beforehand, and we waited for 25 minutes until the MACD crossed to negative when the price moved to 0.6294. Let's implement the strategy step by step.
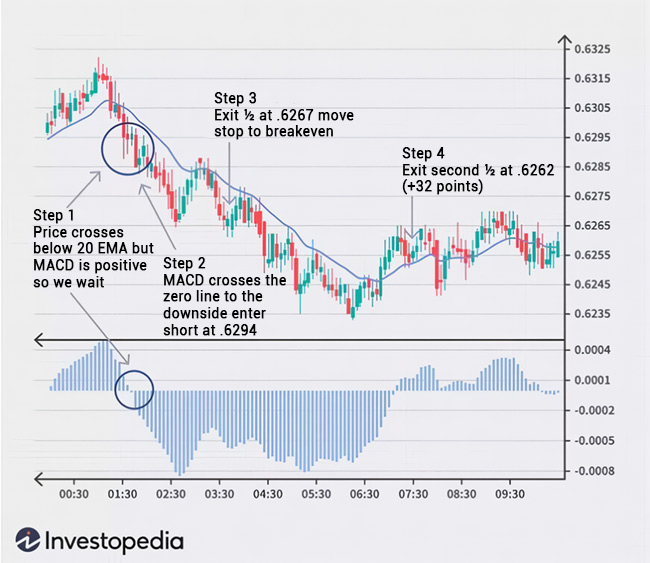
- We opened a short position 10 pips below the EMA at that time, which was 0.6301. Thus, our entry price was 0.6291.
- We placed the initial stop loss at 20 pips above the EMA, or 0.6321 (0.6301 + 20 pips).
- Our initial target was the entry (0.6291) minus the risk of 30 pips (0.6321 – 0.6291), or 0.6261. The target was hit two hours later and we moved the stop loss to breakeven.
- We then trailed the remaining half by the 20 EMA plus 15 pips. We exited the second position at 15 pips above the 20 EMA, which was 0.6262. Our total profit from this trade was (30 pips + ½ (0.6261 – 1.6262)) = 29.5 pips.
Scenario 2
Let's take a look at the 5-minute chart of GBP/USD below. The MACD turned negative along with the crossing of the price below the 20 EMA. Enter a short position by following the strategy:
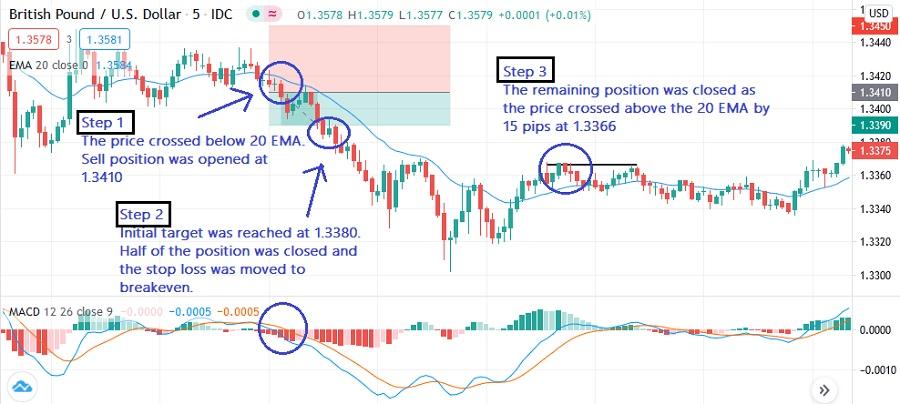
- Our entry price was 10 pips below an EMA of 1.3410.
- The initial stop loss was set at 1.3410 + 20 pips above the EMA, which was 1.3430.
- The first half target was reached shortly thereafter at 1.3380, which was the entry of 1.3410 minus 30 pips.
- After moving the stop loss to breakeven and close half the position, we trailed the second half by 15 pips above the 20 EMA.
- The second half of the position was eventually closed at 1.3366 as the price moved 15 pips above the 20 EMA. Our profit from the trade was 37 pips (30 pips + ½ (1.3380 – 1.3366)).
The Flaw
This strategy allows traders to gain profits from reversal movements. The 20 EMA is used to gauge new trends and the MACD is utilized to confirm whether the momentum is in place. However, while both indicators reinforce each other, the signal given is not always correct. During an uncertain period in the market, the price may simply fluctuate around the 20 EMA while the MACD alternately turns positive and negative, leading to false signals. This is because the trading ranges are either too tight or too wide. Currency pairs with a wide range of movement can expose the flaw of this strategy, causing the stop to be hit earlier than the target.
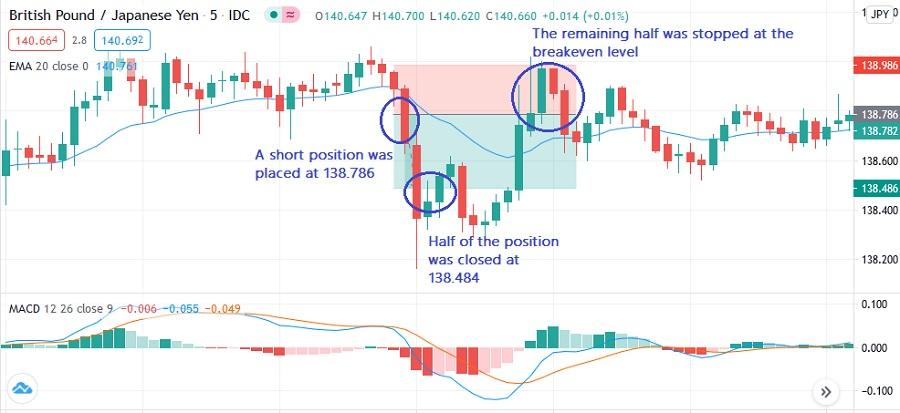
Let's see the 5-minute chart of GBP/JPY above. The pair traded below the 20 EMA and the MACD had turned negative. We entered a short position at 138.786, setting our stop loss at 20 pips plus the EMA (138.986). The initial target was the entry price minus 30 pips, which was 138.486. The pair continued to move downside and hit our initial target. But the movement didn't continue and caused our remaining position to be closed at the breakeven level, which was set right at the entry level around 138.786. The outcome was therefore at an impasse if we didn't count the spread.
Conclusion
The 5-minute trading strategy with EMA provides an opportunity for traders to profit on a short burst of momentum. The strategy guides traders to open and close positions at the best possible time. With the help of risk management tools (stop loss and trailing stop) momentum traders can stay on the trends as long as possible with minimal risks as the profit is already protected. Just keep in mind that this strategy has its flaws too and in the end, the market condition is the one dictating the results.
For more strategies using the Exponential Moving Average, check out "Trading Strategy Using 3 Bar EMA".


2 Comments
Bryan
Jan 22 2024
According to the article, it mentions utilizing a 5-minute chart to identify short-term momentums. To assess trends on the chart, two technical indicators are activated, with the first one being the 20-period EMA (Exponential Moving Average).
I'm curious about the choice of a 20-period EMA. Could we use a shorter period for the EMA, and would it be feasible to opt for a longer period, especially for a 5-minute trading approach? Thanks!
Hans
Jan 25 2024
Actually, the choice of a 20-period EMA (Exponential Moving Average) for a 5-minute chart is often based on striking a balance between responsiveness to short-term price movements and smoothing out noise. The 20-period EMA is commonly used as it provides a good indication of short-term trends while still offering some level of smoothing.
However, you can experiment with different periods based on your trading strategy and preferences. Using a shorter period EMA, such as 10 or 15, might make the indicator more responsive to immediate price changes, but it could also increase the impact of market noise. Conversely, a longer period, like 50 or 100, may offer smoother trends but might be less responsive to recent price movements. (you can read about 10 EMA in here : The Ultimate 3 EMA Crossover Strategy Revealed )