Forex Volatility Chart - Live Data for Market Research
Forex volatility is the amount of distance between fluctuations / ups and downs in the forex market. The amount varies for each forex pair, and it can determine the size of the opportunity to reap profits in a pair.
This Forex Volatility Monitoring Table will help you to find out which pairs have calm volatility and which have high volatility, so you can match your trading style with the right pair.
Scroll for more details
| Currency | 1 Min | 5 Min | 15 Min | 30 Min | 1 Hours | 4 Hours | Daily | Weekly | Monthly |
|---|---|---|---|---|---|---|---|---|---|
| AUDCAD | 2.7 | 4.7 | 5.1 | 13.2 | 15.5 | 30.1 | 76.5 | 113.8 | 317.9 |
| AUDJPY | 2.0 | 4.0 | 5.6 | 8.8 | 8.7 | 32.2 | 68.9 | 135.4 | 393.3 |
| AUDNZD | 5.8 | 17.0 | 17.0 | 17.0 | 17.1 | 18.5 | 159.7 | 252.7 | 329.1 |
| AUDUSD | 18.0 | 4.7 | 4.8 | 7.1 | 8.2 | 16.0 | 54.4 | 131.1 | 281.8 |
| CADJPY | 4.0 | 18.7 | 18.7 | 39.0 | 44.0 | 35.4 | 81.1 | 162.4 | 532.6 |
| EURAUD | 12.0 | 27.7 | 30.0 | 35.9 | 37.6 | 18.2 | 82.1 | 272.3 | 440.6 |
| EURCAD | 2.0 | 6.9 | 8.3 | 10.3 | 16.9 | 17.2 | 53.2 | 122.9 | 206.6 |
| EURCHF | 3.0 | 7.0 | 7.0 | 7.0 | 8.0 | 13.0 | 32.4 | 178.0 | 267.0 |
| EURCZK | 913.0 | 1950.0 | 2340.0 | 2340.0 | 2340.0 | 568.0 | 1567.0 | 2604.0 | 3359.0 |
| EURGBP | 5.0 | 8.3 | 8.3 | 8.3 | 14.3 | 11.0 | 36.2 | 116.1 | 294.3 |
| EURJPY | 7.0 | 9.7 | 29.5 | 54.5 | 56.5 | 56.6 | 115.5 | 215.0 | 552.8 |
| EURUSD | 2.0 | 4.8 | 5.8 | 6.0 | 13.0 | 24.1 | 61.9 | 115.0 | 215.0 |
| GBPAUD | 1.9 | 6.0 | 7.0 | 10.1 | 12.9 | 57.9 | 96.9 | 424.7 | 544.2 |
| GBPCHF | 1.6 | 6.9 | 7.6 | 9.8 | 13.4 | 48.4 | 136.3 | 431.7 | 544.6 |
| GBPJPY | 26.6 | 18.2 | 31.8 | 61.6 | 67.6 | 78.1 | 152.2 | 254.8 | 559.9 |
| GBPUSD | 2.0 | 6.5 | 7.0 | 8.0 | 13.1 | 33.9 | 71.7 | 139.0 | 319.7 |
| NZDUSD | 0.0 | 4.7 | 5.2 | 5.4 | 8.3 | 15.9 | 89.1 | 126.1 | 343.3 |
| USDCAD | 1.0 | 31.1 | 31.1 | 31.1 | 31.1 | 31.3 | 87.0 | 191.4 | 1011.1 |
| USDCHF | 1.1 | 5.7 | 5.7 | 8.5 | 13.5 | 20.1 | 100.5 | 149.8 | 344.1 |
| USDCNH | 51.0 | 77.0 | 140.0 | 289.0 | 467.0 | 866.0 | 1846.0 | 5178.0 | 20119.0 |
| USDJPY | 24.4 | 10.8 | 23.8 | 53.0 | 58.4 | 32.9 | 49.7 | 167.3 | 549.0 |
| XAGUSD | 0.0 | 7.3 | 8.2 | 9.3 | 10.7 | 17.2 | 58.7 | 140.4 | 325.6 |
| XAUEUR | 91.0 | 319.0 | 198.0 | 179.0 | 257.0 | 744.0 | 2622.0 | 7144.0 | 21675.0 |
| XAUUSD | 0.0 | 128.0 | 184.0 | 253.0 | 399.0 | 793.0 | 3675.0 | 9206.0 | 20822.0 |
Volatility shows the amount of risk when trading; the higher volatility means the higher risk, even though there are more trading opportunities available.
How to read this volatility table?
- On the leftmost column, there are symbols of pairs, followed by the amount of volatility. You can find out each pair's volatility in pips from various time frames, ranging from 1-minute to monthly.
- If you want to trade on forex pairs with the most trading opportunities, look for those with the highest volatility rate. Meanwhile, if you want to keep your risks low, look for pairs with small volatility. Happy trading!
Additional FAQ
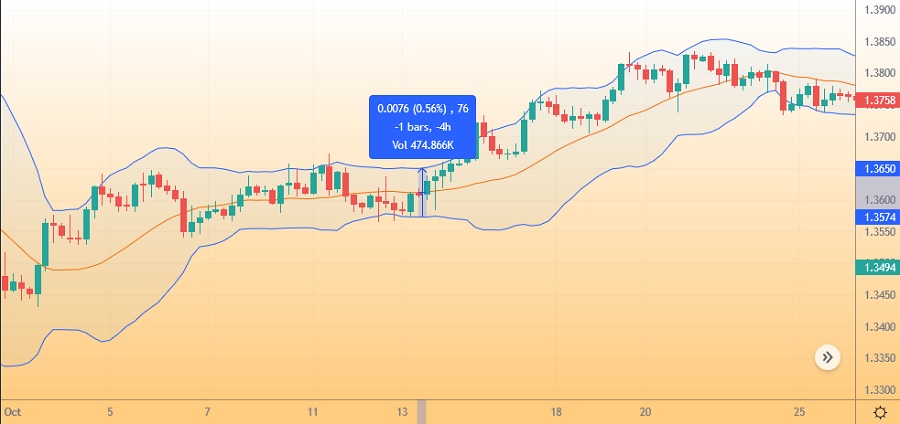
How to set a volatility stop with Bollinger Bands?
- Draw a straight line from the upper band to the lower Band.
- Then, find out the "distance" in pips to show the current volatility level and the ideal location to set your stop loss.
- Say the volatility level is 76 pips, then it's best to put the stop loss in 76 pips as well.
Continue Reading at Stop Loss Strategies to Protect Your Trades
Why does high volatility good for day traders?
High volatility in the forex market appeals to day traders because their primary strategy involves seeking short-term profits, as opposed to investors who typically adopt a buy-and-hold approach. High volatility offers more frequent and rapid price movements, creating trading opportunities for day traders.
Continue Reading at What is High Volatility and How to Profit from It?
How to set a volatility stop with ATR?
With the help of this indicator, you will be able to see the number of average movements (in pips) based on the chart that you use. If you use 30 ATR, it will display the average pip range for the price movement in the last 30 days. Let's say that the ATR result is 50 pips per 30 candles formed, it means that the ideal stop loss level is around 50 pips.
Alternatively, you can use a risk-to-reward ratio of 1:1. So if the ATR shows an average movement of 50 pips, then you can set a stop loss and take profit at around 25 pips from the initial entry price.
Continue Reading at Stop Loss Strategies to Protect Your Trades
What does high volatility mean?
High volatility means that the price rises quickly and then immediately goes down, creating a big difference between the highest and the lowest price over a time period.
Continue Reading at What is High Volatility and How to Profit from It?
Articles About Forex Trading
