 Dedicated FREE FOREX VPS
 Free FOREX Virtual Private Server
 MT4 Demo Contest, Get $500
 Sign Up for an Account, Claim 60% Deposit Bonus
 Free MT4/MT5 VPS 2024
 Send E-mail and Get Free Merchandise
 $1K Refer a Friend Bonus for Pepperstone Pro clients
 Maximize Your Earnings with 100% Deposit bonus
 Trade to Win, $5,000 Monthly Demo Contest
 Claim 30% + 15% Deposit Bonus from LiteFinance
Learn how to identify the bullish and bearish engulfing candlestick patterns, two powerful reversal patterns that can help you make profitable trades without hassle.
Bullish and bearish engulfing candlestick patterns are two of the most popular candlestick patterns among traders. They are reversal patterns that signify a change from the current trend.
They go with these principles:
- The bullish engulfing pattern is a reversal pattern that occurs when a bearish candle is followed by a bullish candle that is larger and has a higher closing price.
- The bearish engulfing pattern is a candlestick pattern that occurs when the second candle completely envelops two consecutive candles.
For traders, mastering the intricacies of Bullish and Bearish Engulfing patterns can be a gateway to identifying profitable opportunities and managing risks effectively. These patterns are integral to candlestick charting, serving as invaluable guides to deciphering market sentiment and predicting price movements.
And so, let's learn to recognize and use them to make strategic trading decisions.
How to Identify Bullish Engulfing
The bullish engulfing pattern occurs after a downtrend. It consists of two different candles in terms of sentiment and body size.
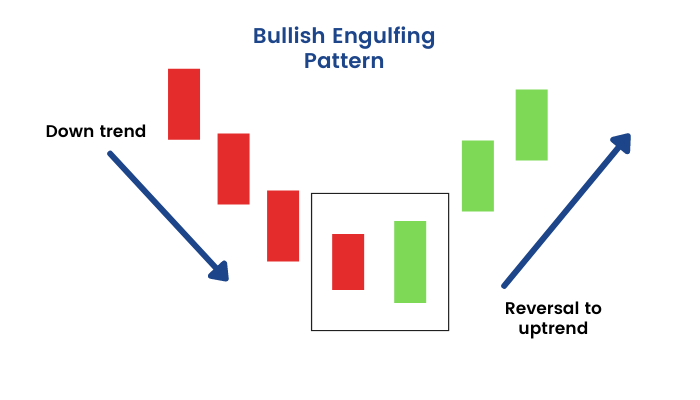
It is a sign that the trend is about to reverse, and the bulls are now in control. As such, a rally often follows the bullish engulfing pattern.
To make it easier, the criteria for a bullish engulfing pattern are as follows:
- Occurs during a downtrend and suggests a potential reversal to the upside.
- Consists of a bearish (downward) candlestick followed by a larger bullish (upward) candlestick.
- The bullish candle completely engulfs the previous bearish candle, which opens below the previous day's close and closes above the previous day's open.
This pattern indicates that buying pressure has significantly increased, overpowering the selling pressure, and may mark the beginning of an uptrend or a bullish move.
How to Identify Bearish Engulfing
The bearish engulfing pattern occurs after an uptrend. This pattern serves as the opposite of the bullish engulfing pattern.
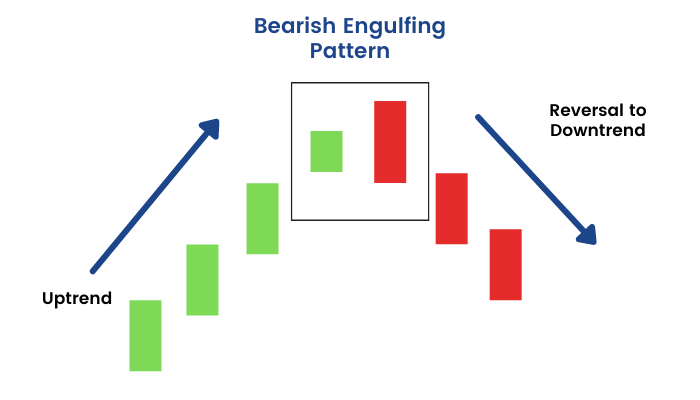
It is a sign that the trend is about to reverse to the downside, and the bears are now in control. Hence, a decline often follows the bearish engulfing pattern.
The criteria for a bearish engulfing pattern are as follows:
- Occurs during an uptrend and suggests a potential reversal to the downside.
- Consists of a bullish candlestick followed by a larger bearish candlestick.
- The bearish candle completely engulfs the previous bullish candle, opening above the previous day's close and closing below the previous day's open.
This pattern indicates that selling pressure has significantly increased, overpowering the buying pressure, and may mark the beginning of a downtrend or a bearish move.
How to Use Bullish and Bearish Engulfing
- Identify the trend. The pattern must occur after a clear trend. If the market is in a downtrend, we should expect a bullish engulfing pattern after a series of bearish candles. If the market uptrends, a bearish engulfing pattern should appear after a series of bullish candles.
- Wait for the pattern to be confirmed. The pattern is not considered valid until the second candle closes. For further confirmation, we can also do the conservative way and wait until after the next candles close above or below the second candle.
- Place your stop loss order. Your stop loss order should be placed beneath the low of the first candle in the bullish engulfing pattern or above the high of the first candle in the bearish engulfing pattern.
- Set your profit target. Your profit target should be placed at a level equal to the height of the engulfing candle. Otherwise, it could be set in accordance with your risk to reward ratio.
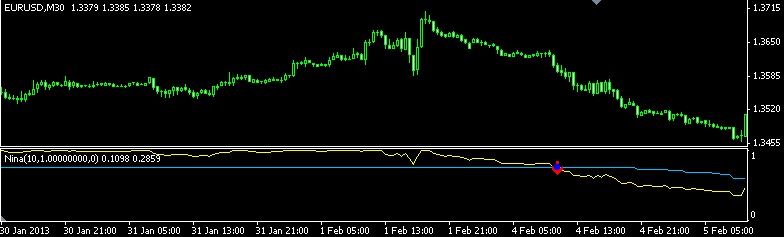
The H4 chart of the EUR/USD below is an example of using the bullish engulfing pattern in a trade:
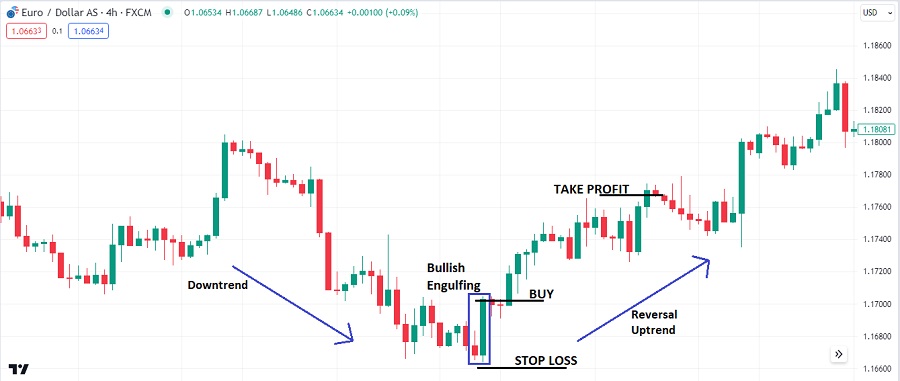
The bullish engulfing pattern is a signal that the downtrend may be ending. Traders could enter a long trade at the opening of the second candle with a stop loss order below the first candle's low. The profit target could be set at a level equal to the height of the engulfing candle.
Bottom Line
Understanding the dynamics of bullish and bearish engulfing candlestick patterns is a valuable tool for traders and investors to detect potential reversals in a simple way. We only need to identify the prevailing trend and wait for two candlestick patterns to signal an upcoming trend change. Moreover, planning a trade based on engulfing candles is easy as we can refer to the OHLC prices to set the entry price and stop loss target. Profit levels are also decipherable using the size of the engulfing candle.
Nevertheless, it is important to remember that no single candlestick pattern can 100% guarantee success in identifying reversals. The engulfing patterns are indeed strong reversal signals, but they are not infallible. It is always best to use the pattern in conjunction with other technical indicators, market context, and volume to make informed trading decisions.