 Dedicated FREE FOREX VPS
 Free FOREX Virtual Private Server
 MT4 Demo Contest, Get $500
 Sign Up for an Account, Claim 60% Deposit Bonus
 Free MT4/MT5 VPS 2024
 Send E-mail and Get Free Merchandise
 $1K Refer a Friend Bonus for Pepperstone Pro clients
 Maximize Your Earnings with 100% Deposit bonus
 Trade to Win, $5,000 Monthly Demo Contest
 Claim 30% + 15% Deposit Bonus from LiteFinance
As a day-traders' favorite, there are quite a lot of specifically designed strategies to trade a 15-minute chart.
The 15-minute chart is a favorite of day-traders. While scalpers may prefer lower time frames to catch more trade opportunities, day-traders could focus on the 15-minute chart to profit from larger price movements throughout the day. There are usually one or two profitable chances every day when we trade on the 15-minute chart, except on holidays and quiet trading days.
How should we trade on the 15-minute chart? There are quite a lot of specifically designed trading strategies out there. Here are some of them:
The 15-Minute Breakout
Requirements:
- Sufficient knowledge about support resistance and simple candlestick reading.
- Naked 15-minute chart with additional trend lines as needed.
The rule:
If it is trending in one direction and breaks a 15-minute high, then it is most probably going to continue (either upward or downward).
The caveat:
- The strategy is more suitable for Asian and European trading hours.
- Be aware not to open any position within 2 hours before market close in the New York session.

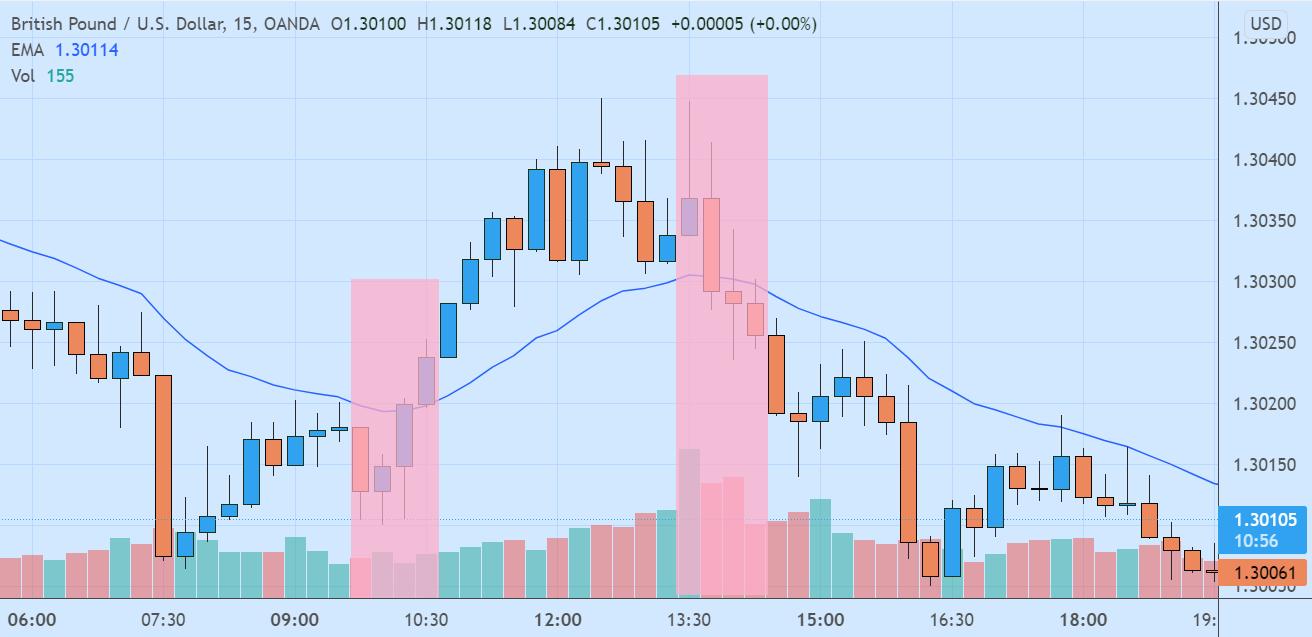
The 20-EMA Trading Strategy
Requirements:
- Understanding on how EMA (Exponential Moving Average) works, support resistance zones, and overall trend.
- A 20-EMA on a 15-minute chart.
- A Daily chart.
The rule:
- Check the major trend in the Daily chart. Is it uptrend or downtrend? Only open a position if the trend on the Daily chart is in the same direction as the current trade opportunity on the 15-minute chart.
- If prices on the 15-minute chart moved over 20-EMA with substantial buying volume, then you can buy it. If prices on the 15-minute chart moved below 20-EMA with substantial selling volume, then you can sell it. See the example above.
- If prices have moved over 20-EMA for several days, then you can look for buying opportunities when prices retrace to the 20-EMA line. if prices have moved below 20-EMA for several days, then you can open a short position when prices retrace to the 20-EMA line.
The caveat:
- This strategy is only suitable for breakouts and trending markets. Be aware not to use it during choppy or ranging markets.
- To improve accuracy, you could also monitor price patterns and volume indicators. There is always more than one way to use a certain trading strategy, read more to learn further.
Multiple Time Frames Trading Strategy
Requirements:
- Knowledge about support resistance zones, trend lines, and simple candlestick reading.
- To trade on every currency pair, you would need to check 15-minute, 1-hour, and 4-hour or Daily charts.
The rule:
- Determine the major trend in the largest time frame. You could make use of the 4-hour or Daily chart.
- Confirm that the major trend is still ongoing in the mid-term time frame (1-hour).
- Look for entry and exit points on the 15-minute chart. You could either apply the 20-EMA strategy above, or choose other indicators such as ADX, Parabolic SAR, and Bollinger Bands. You could also prefer a naked chart as long as you have sufficient experience with patterns and candlesticks.
So, which strategy would you choose to trade a 15-minute chart? Whichever it is, make sure to first try it out on the demo account till you could master it well. Good luck!


3 Comments
Peter
Jan 11 2024
Hey! I've found that the 15-minute trade works best for me. It's not too long, so I don't have to wait forever, and it's not rushed either. This way, I have time to think, develop strategies, and it's a shorter trade, which lowers my risk. But before diving into the 15-minute trading, I want to discuss the article you mentioned earlier. It highlighted that one of the requirements for a 15-minute breakout is having sufficient knowledge about support, resistance, and simple candlestick reading.
I'm curious about how that knowledge plays into it. I mean, when it comes to support and resistance, how can we apply that in a 15-minute trade? Thanks!
Charlie
Jan 14 2024
Hey, let me break it down for you! The idea conveyed in the article is somewhat like this: in the constrained timeframe of a 15-minute trade, identifying essential support and resistance levels is akin to having guideposts on your trading journey. This helps you assess how the price might respond in that brief period, impacting the choices you make.
For instance, picture this: you're engaged in trading a stock that has been on a steady upward trend. As you scrutinize the 15-minute chart, you observe that the stock has recently established a support zone around a specific price, let's say $50. Whenever the stock has approached $50 in the past, it has consistently rebounded, indicating a robust support level.
Now, equipped with this awareness, in the midst of your 15-minute trade, if you notice the stock getting close to the $50 threshold, it presents a potential opportunity to buy. The historical pattern suggests a high likelihood that the stock will bounce back from this support level. This understanding empowers you to swiftly decide to buy, expecting a continuation of the upward trend within that 15-minute timeframe.
Chidi
Jan 19 2024
Please, I will appreciate an answer. In the second tip, it says we should ascertain the major trend on the daily chart. Please, what should we use to mark the major trend on the daily chart? Is it EMA 20 or EMA 200?