 Dedicated FREE FOREX VPS
 Free FOREX Virtual Private Server
 MT4 Demo Contest, Get $500
 Sign Up for an Account, Claim 60% Deposit Bonus
 Free MT4/MT5 VPS 2024
 Send E-mail and Get Free Merchandise
 $1K Refer a Friend Bonus for Pepperstone Pro clients
 Maximize Your Earnings with 100% Deposit bonus
 Trade to Win, $5,000 Monthly Demo Contest
 Claim 30% + 15% Deposit Bonus from LiteFinance
Identifying the end of a trend is crucial not only to close a position but also to possibly open a new position. From using price action to indicator signals, here are several ways to know when a trend is ending.

The trend is your friend. This popular expression sums up the nature of most trading strategies. But the trend continuously changes; one moment it rises and the next moment it could fall sharply.
If you are a trend trader, the end of a trend could end up being your enemy. But if you are a contrarian, the end of a trend is something that you anticipate to enter the market.
There are various ways to spot the end of a trend, but not every single one of them is effective.
Here are a few methods to effectively spot the end of a price trend:
- Large candlesticks
- Trendline breaks
- Trendline and MACD combo
- Overbought/oversold crossings
- Oscillator and Parabolic SAR combo
- Breaks from the outer Bollinger Bands
Check the description below for further explanation.
Large Candlesticks on the Chart
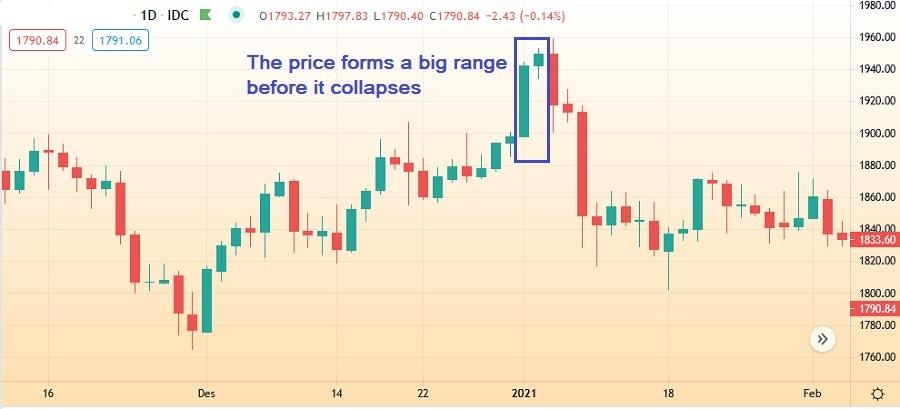
Our first method to detect the end of a trend is by spotting large candlesticks on the chart when the market is trending. If the price has been in an uptrend for some time then a large red candlestick appears, this particular candlestick is strong enough to move against the trend.
It cancels out the steady upward movement that the price does on the last candlesticks. If you see this happening, it is very likely that the trend is ending, replaced by a new trend in the opposite direction.

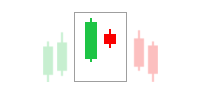
Now, if we spot large green candlesticks in a bullish trend, this does not necessarily indicate that the trend is getting stronger. If the large green candlesticks are followed by large red ones to make a parabolic pattern, it is likely that the trend is ending.
The chart below shows a candlestick that is larger than the previous ones. What most likely happens here is many traders are rushing to follow the trend and buy into the market. At the same time, however, smart money starts selling their positions. Thus, some large red candlesticks appear in the following sequence, instantly erasing the large green candlestick.
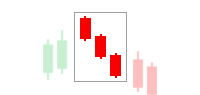
We use the opposite for the end of a bearish trend. If large green candlesticks appear during a downtrend, it may signal for the trend to end. Or, if large red candlesticks are followed by large green candlesticks, there is a chance that the downtrend is ending.
This candlestick method is pretty straightforward, but it can also be very subjective. For traders who haven't quite mastered the art of reading a candlestick chart, we recommend you combine the candlesticks with other indicators. For example, we can mix candlestick reading with the trendline to identify the end of a trend.
Trendline Breaks
This is also another simple way to identify a trend's end, provided that you know how to draw a valid trendline, which is a straight line that connects at least two swing highs during a downtrend or at least two swing lows during an uptrend.
When the price breaks the trendline, there are two possibilities that could happen. First, the ongoing trend ends, and the price moves in the opposite direction. Second, the price bounces back and the ongoing trend continues. If the latter happens, we will need to redraw our trendline as to not make it unbroken. Why so? Because a good trendline is a trendline that is not broken through by the price. If a break happens, it should be only for the end of a trend.
Here are the techniques to identify the end of an uptrend by using a trendline:
- The price breaks below the trendline.
- A new lower high is formed.
As for the end of a downtrend, here are the rules:
- The price breaks above the trendline.
- A new higher low is formed.
The chart below shows how the price breaks above a bearish trendline. New higher lows appear when the price steadily rises after the break happens.

After the breakthrough, however, a market could retest instead of moving in the opposite direction. This is usually due to traders buying or selling into the market after the breakout and selling their positions for short-term actions.
Trendline and MACD Combo
The problem with a trendline is it can be subjective at times, just like candlestick reading. Traders would draw a trendline to fit their trading plans, an act that would only put them at risk. Thus, if you are still not sure whether your trendline is a valid one, you can use another indicator to produce complementary signals.
MACD is an indicator that identifies trend changes and measures market momentum. As soon as the price breaks the trendline, the MACD indicator would usually indicate a strong momentum change. With this complementary signal, we are more confident to say that a trend is finally coming to an end.
Remember our first method to detect a trend's end? If we look closely at the chart, we can spot a large red candlestick appears at the end of the uptrend. In fact, it is this particular candlestick that breaks the trend line. So in this example, we practically use the combination of the trendline, the MACD, and the candlestick to identify the trend.
Overbought/Oversold Crossings
The premise of this method is as follows: the end of an uptrend is indicated by overbought conditions while the end of a downtrend is indicated by oversold conditions. We identify these overbought and oversold conditions with the help of the RSI or the Stochastic, two of the most well-known oscillators among forex traders.
We can use either or both for our trades. But remember that both are oscillators that react to the price action pretty much with a similar mechanism. If they show the same signal, it doesn't necessarily mean that the signal is stronger. That said, using both indicators can help us minimize the risk of false signals.
Both the RSI and the Stochastic display the overbought and oversold levels on the scale of 0 – 100. The difference is that the RSI signals overbought conditions when it crosses above 70 and oversold conditions when it crosses below 30. On the other hand, Stochastic has 80 as the signal for overbought conditions and 20 as the signal for oversold conditions.
Let's say we have an existing long position. The uptrend is going well until the RSI shows its level is above 70. This is a signal that the currency is overbought. So does it mean that the uptrend will end? Well, in this situation we should prepare ourselves for two possible outcomes. One is a reversal, which means the trend will end, and the other is a pullback, which means the trend will continue.
Oscillator and Parabolic SAR Combo
Since oscillators alone cannot tell us about the end or the continuation of a trend, we will combine them with Parabolic SAR. This indicator can show the change of a trend direction.
Here are how to identify if an uptrend is ending:
- The RSI or the Stochastic signals overbought conditions.
- The Parabolic SAR changes from the downside to the upside, signaling the start of a downtrend.
And for the end of a downtrend, here are the rules:
- The RSI or the Stochastic signals oversold conditions.
- The Parabolic SAR changes from the upside to the downside, signaling the start of an uptrend.
Here is an example of the combination of stochastic and Parabolic SAR.

Breaks from the Outer Bollinger Bands
After an extended period of trend, traders often encounter price consolidation. Whether an ongoing trend will continue or the price makes a reversal, the market could go either way after this kind of movement.
Thus, for this last method, we will use Bollinger Bands to predict the trend. We take signals by monitoring the gap between the outer bands as well as the price action. When the gap narrows, it signals price consolidation. And when the price breaks one of the outer bands, we can take this as an indication that the trend will end.
Here are the rules for the end of an uptrend:
- The gap between the upper and lower bands narrows.
- The price crosses the middle band from the upside.
- Next, the gap between the upper and lower bands widens.
- The closing price crosses below the lower band.
As for the end of a downtrend, here are the signals:
- The gap between the upper and lower bands narrows.
- The price crosses the middle band from the downside.
- Next, the gap between the upper and lower bands widens
- The closing price crosses above the upper band.
What to do When a Trend is Ending?
Let's say you are currently riding the trend but there is a strong signal that the trend will soon end. It's probably wise to exit your trades. But if you don't have any open positions, this is a good opportunity for you to enter trades on the new trend.
All in all, there are various indicators that can help us identify when a trend is ending, which include but are not limited to candlesticks, trendlines, oscillators, Parabolic SAR, MACD, Bollinger Bands, etc. Analyzing and predicting the end of a trend will help us minimize our losses if we have open trades.
Or, if we don't have open trades, we can catch the trend early on so we can take profits as much as possible from the new trend. That is one way to determine the appropriate entry and exit points for every position.


2 Comments
Alex Dian
Apr 6 2024
It's mentioned that Trendlines can sometimes be subjective, similar to interpreting candlestick patterns. Traders may draw trendlines to suit their trading strategies, which could potentially increase their risk. However, it's worth noting that trends can often extend, and when prices begin to decline, it may signal the end of an uptrend. This raises the question: Can we solely rely on drawing tools to identify trends, or are there alternative tools aside from MACD, as mentioned in the article?
Roger D
Apr 8 2024
So, the article brings up a crucial question: Can we solely rely on drawing tools to identify trends, or do we need additional tools apart from MACD, as mentioned? Well, it's a bit of a mixed bag. While drawing tools like trendlines can give us some insights into market trends, they can also be subjective and open to interpretation. Plus, trends can change and sometimes catch us off guard. So, having alternative tools like MACD, which offers different insights into market momentum, could definitely be beneficial. It's all about using a combination of tools to get a more complete picture of what's happening in the market and making informed trading decisions.