 Dedicated FREE FOREX VPS
 Free FOREX Virtual Private Server
 MT4 Demo Contest, Get $500
 Sign Up for an Account, Claim 60% Deposit Bonus
 Free MT4/MT5 VPS 2024
 Send E-mail and Get Free Merchandise
 $1K Refer a Friend Bonus for Pepperstone Pro clients
 Maximize Your Earnings with 100% Deposit bonus
 Trade to Win, $5,000 Monthly Demo Contest
 Claim 30% + 15% Deposit Bonus from LiteFinance
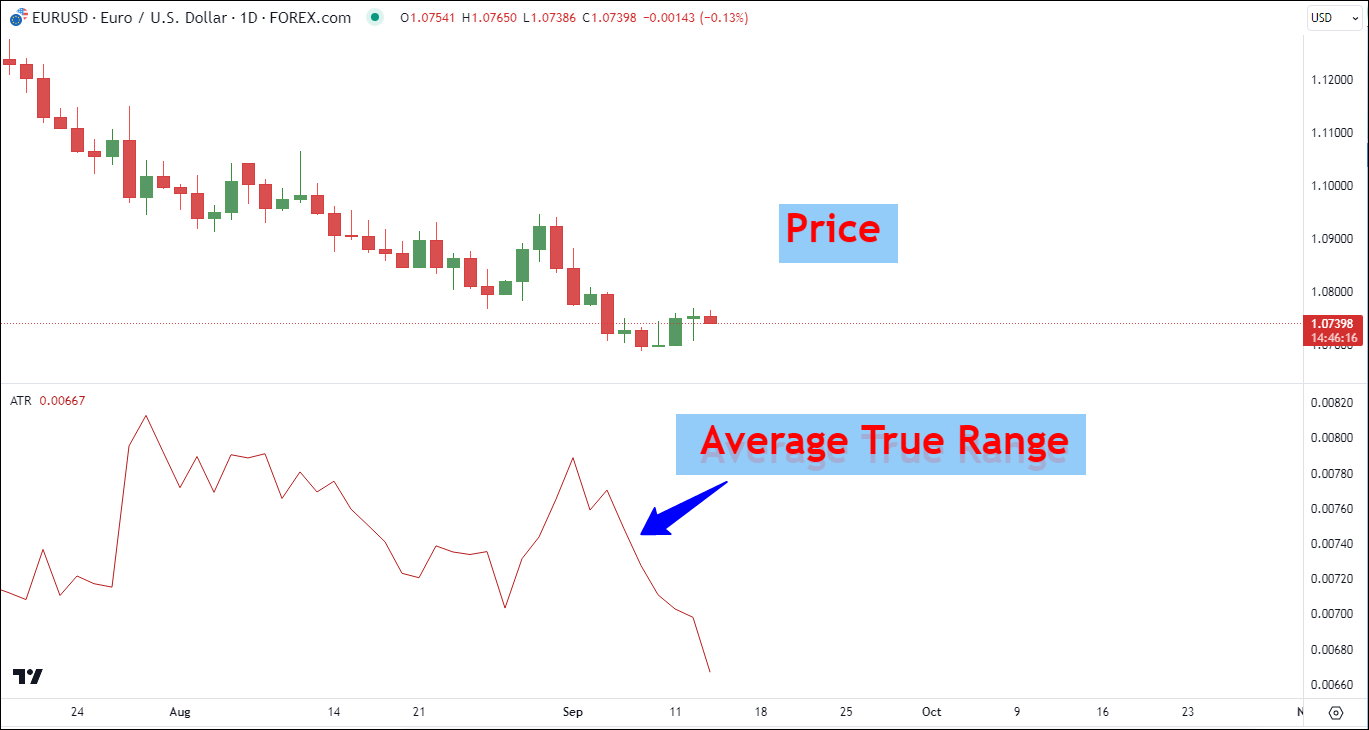
ATR indicator can measure the market volatility in an instant. Learn how this tool can help you in setting your stop-loss and profit target more effectively.
The market is always on the move, never sitting still. That's why keeping tabs on volatility is super important.
Volatility has a significant impact on how traders handle risk. Take, for instance, the way they set their stop-loss and profit targets.
But, you don't have to sweat trying to figure out volatility. There's an indicator called ATR (Average True Range) that does the job in real time.
Contents
What Is Average True Range (ATR)?
The Average True Range (ATR) was created by J. Welles Wilder, Jr. in his book "New Concepts in Technical Trading Systems". The ATR is an indicator that helps us understand market volatility.
Most traders use 14 days for ATR calculations, but you can use shorter ones if that suits your style. Although the ATR was designed for commodities markets, it has now found its way into various types of securities, including forex and stocks.
ATR does two key things: helps traders pinpoint the perfect time to jump into a trade and helps decide where to place a stop-loss and profit target for a savvy strategy.
The ATR Formula
The formula for determining ATR when you already have a prior ATR calculation is as follows:

Where:
- n = Quantity of periods
- TR = True Range
If you haven't previously calculated the ATR, you should use:
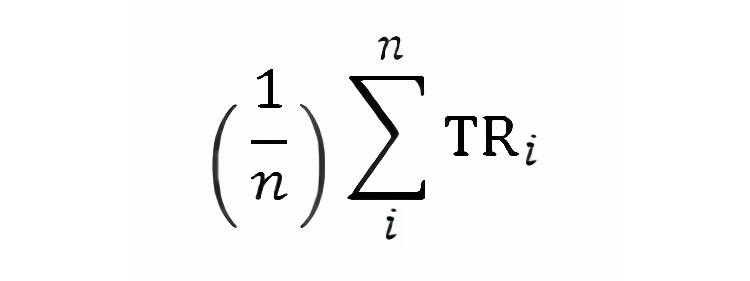
Where:
- TRi = Specific true range, such as the TR on the first day, then the second day, then the third day
- n = Quantity of periods
Formula to determine the True Range:
![]()
Where:
- High represents the highest price of the current period.
- Low represents the lowest price of the current period.
- Previous Close represents the closing price of the last period.
- Abs represents the absolute value function, ensuring positive values.
Calculating the ATR With 2 Simple Steps
We can determine the Average True Range (ATR) through these simple steps:
- Find the True Range (TR)
- Calculate the ATR
Let's say you've already calculated the 14-day Average True Range (ATR) for EUR/USD, and it's 60.0 pips. Now, looking at the price today, you'll have this information:
- Today's high: 1.07718
- Today's low: 1.06904
- Yesterday's close: 1.07477
To find the current true range, pick the largest value among these calculations:
- 1.07718 - 1.06904 = 81.4 pips
- 1.06904 - 1.07477 = -57.3 pips
- 1.07718 - 1.07477 = 24.1 pips
We'll go with 81.4 pips since it's the highest. You can use this to gauge the current 14-day ATR, which tells you how volatile the price might be. Here's how the formula works:
((60.0 x 13) + 81.4) / 14 = 61.5 pips
Even though there's no major news, the price has already gone up by 81.4 pips today. That's 35% more than the average ATR (60.0 pips). You're receiving a buy signal from your strategy, but it's important to note that since the price has already made a significant move beyond the average, betting on further upward movement might not be the wisest decision. The odds are against you.
Given the substantial price increase and the fact that it's moved more than the average, it's more likely that the price will either stay within the established range or even drop. Buying when the price is near the top of the daily range, especially when it's well above the average, may not be a prudent move. Instead, selling or shorting could be a better option if a valid sell signal comes into play.
Inserting The ATR Indicator on MT4 and TradingView
Adding the ATR (Average True Range) indicator to your MT4 and TradingView charts is a straightforward process that can enhance your trading analysis. Here, we'll show you the steps to seamlessly incorporate this valuable indicator into your charting platforms.
ATR on MT4 Chart
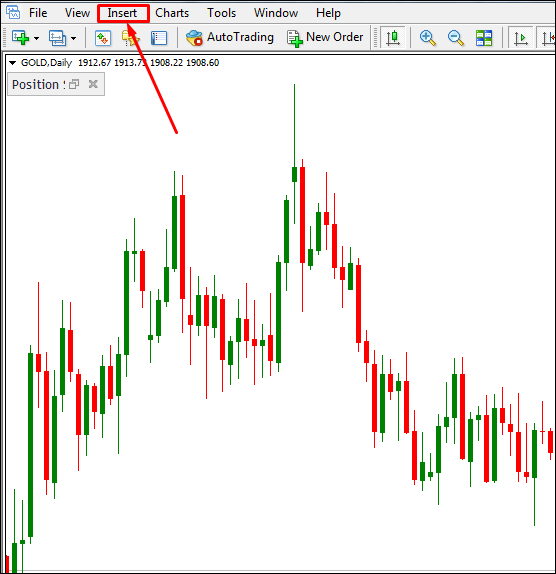
- Open your MetaTrader 4 (MT4) trading platform.
- Select the chart where you want to add the ATR indicator.
- Click on "Insert" in the top menu.
- Choose "Indicators", select "Oscillators", and choose "Average True Range" from the list.
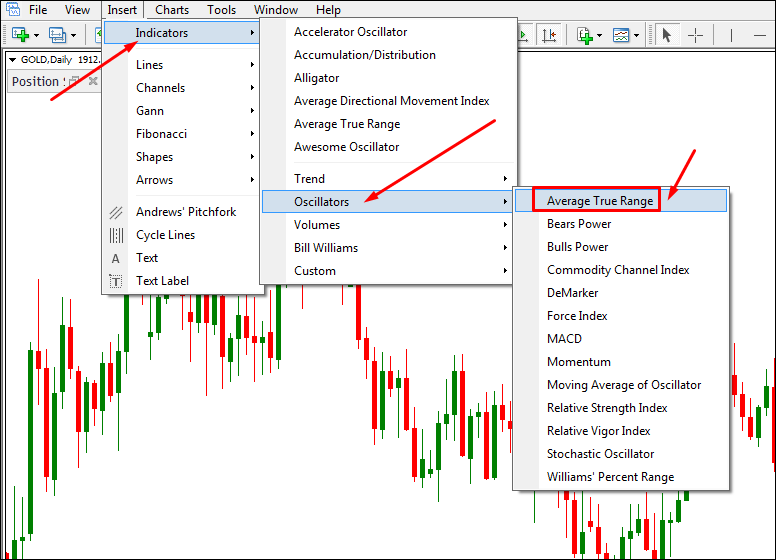
- A window will appear with settings for the ATR indicator. You can adjust the parameters as per your preferences.
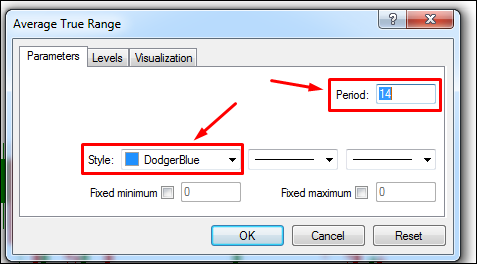
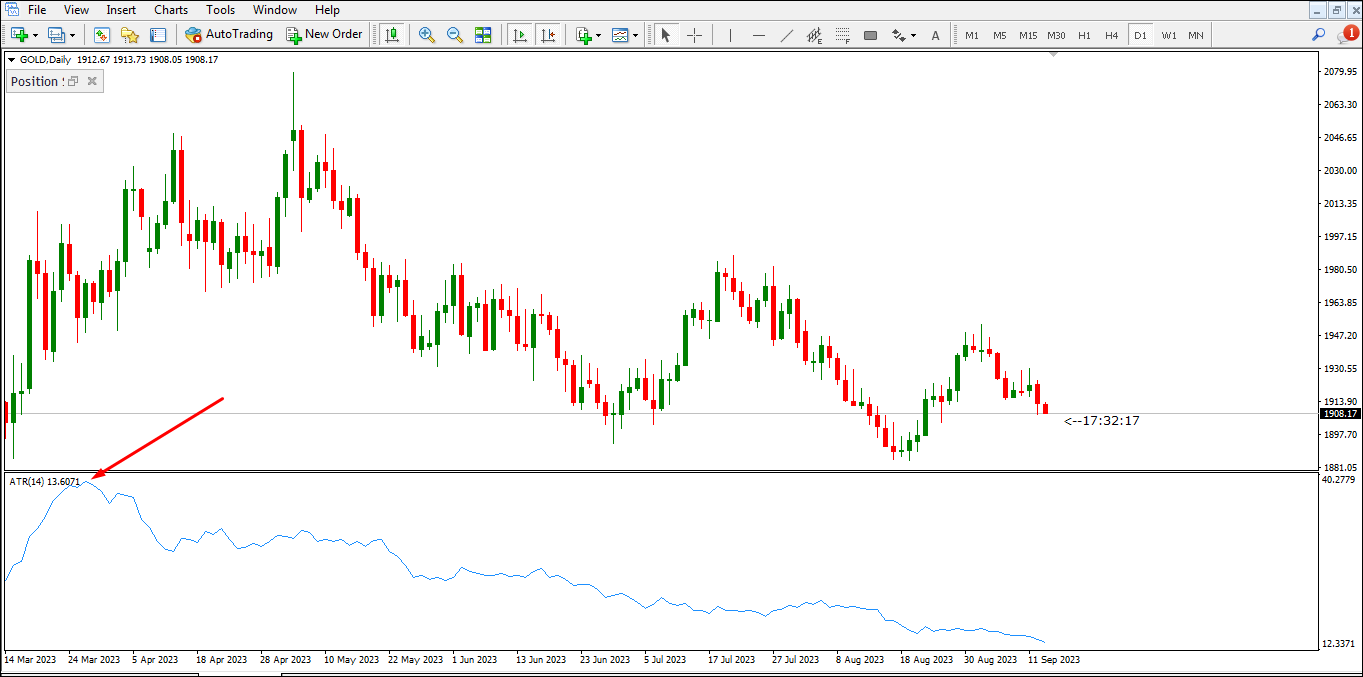
- Click "OK," and the ATR indicator will be added to your chart.
ATR on TradingView
- Open your TradingView account and select the chart you want to work with.
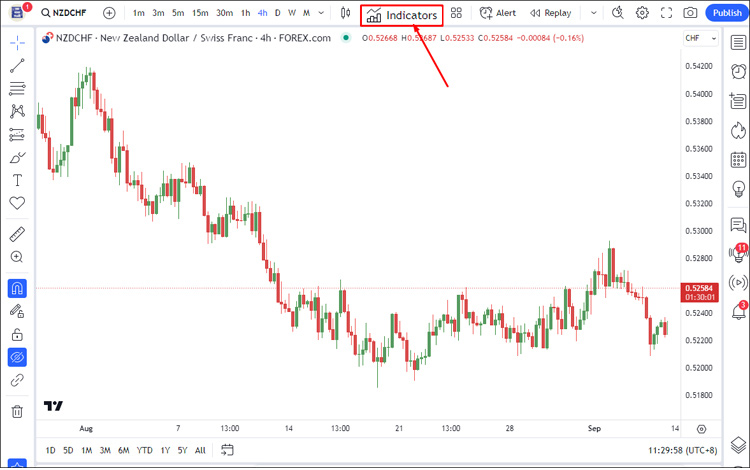
- Locate the "Indicators" button at the top of the chart.
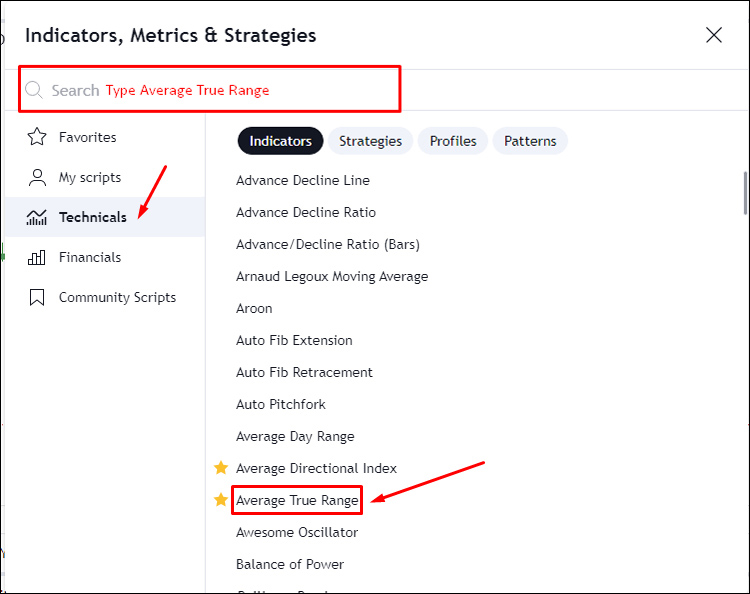
- A window will appear. Choose "technicals" and "indicators", then pick "Average True Range". You can also type in the search box "Average True Range" for a quicker process.
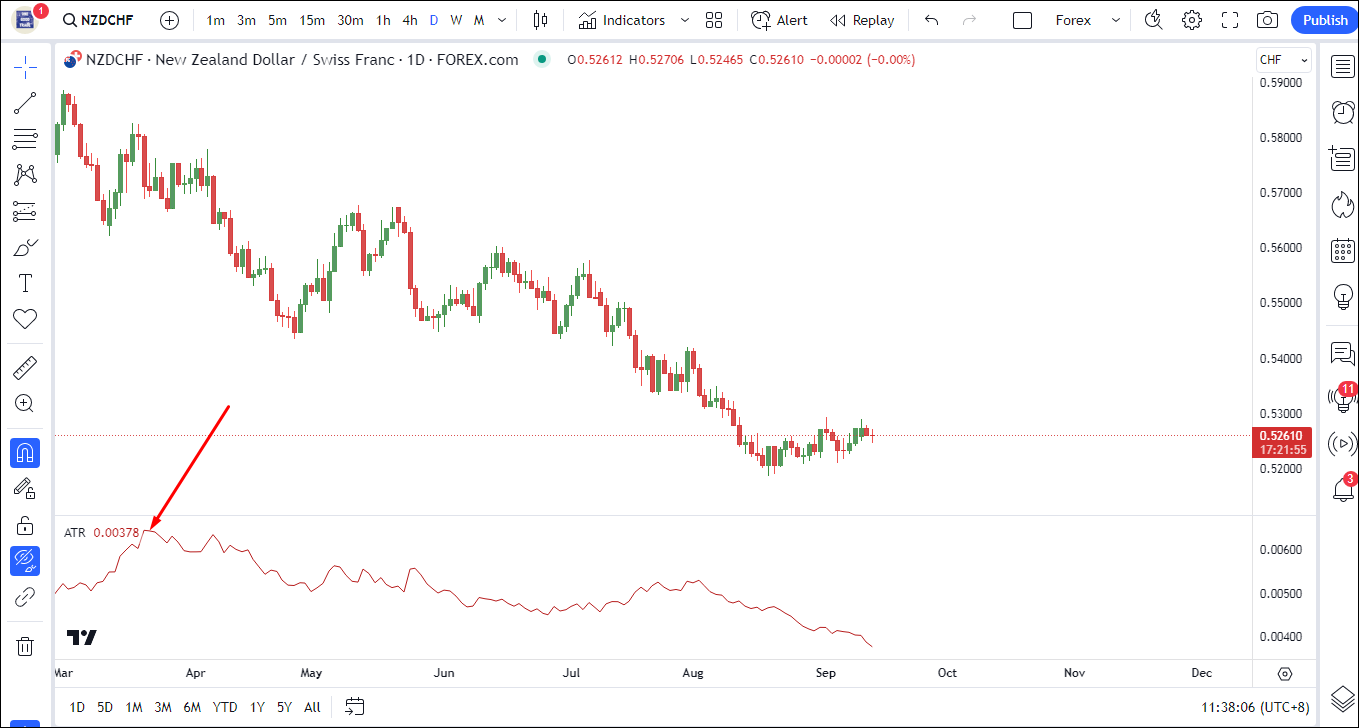
- The ATR with the default setting will be added below to your chart.
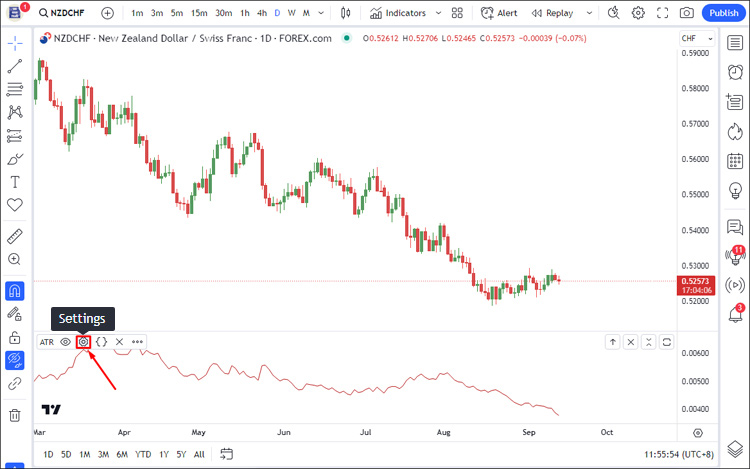
- To adjust the parameters of the ATR indicator, such as the period and color settings, click the settings on the top left of the indicator.
- The ATR settings window will appear. Now you can customize the period and color settings in the tab "inputs" and "style".
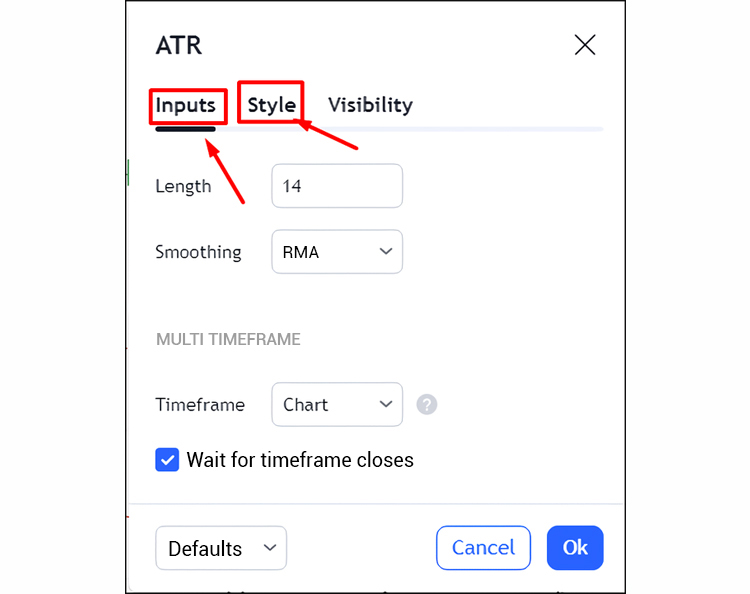
- Once you've set the parameters, click the OK button at the bottom of the settings window. Your preference settings will now be added to your TradingView chart.
How to Use The ATR in Intraday Trading?
You can use the ATR to determine stop loss, profit target, and adjusting risk in a trade. Here's how you do it.
Determine Stop Loss
The ATR can help you establish an appropriate stop-loss level for your intraday trades. By knowing the average price volatility of the asset you're trading, you can set a stop-loss that takes into account the typical price fluctuations.
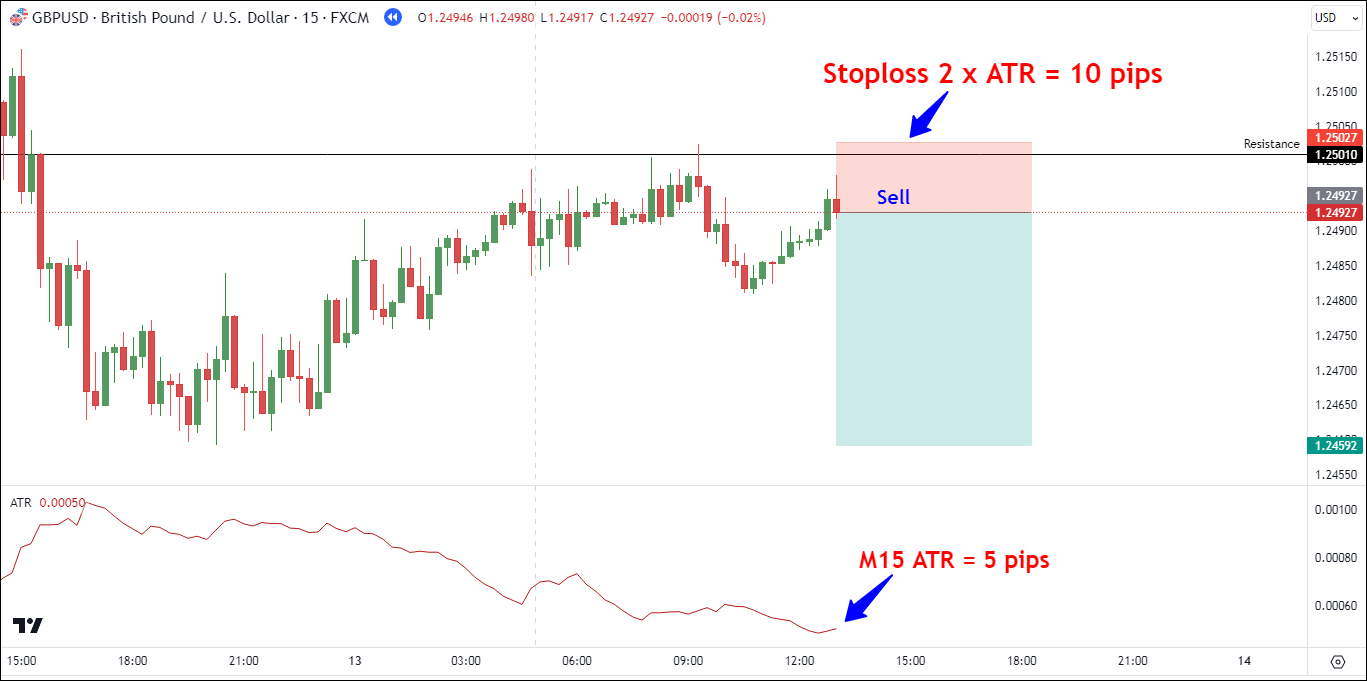
For example, if the ATR value in the 15-minute time frame is 5 pips, you might consider placing your stop-loss 2 times the ATR value (e.g., 10 pips) away from your entry point. This way, you're giving your trade some room to breathe while also protecting it from excessive losses due to unexpected market movements.
Determine Profit Target
The ATR is also helpful in setting profit targets for intraday trading, especially the Daily ATR. It provides insights into the potential price range the asset can cover within a given time frame.
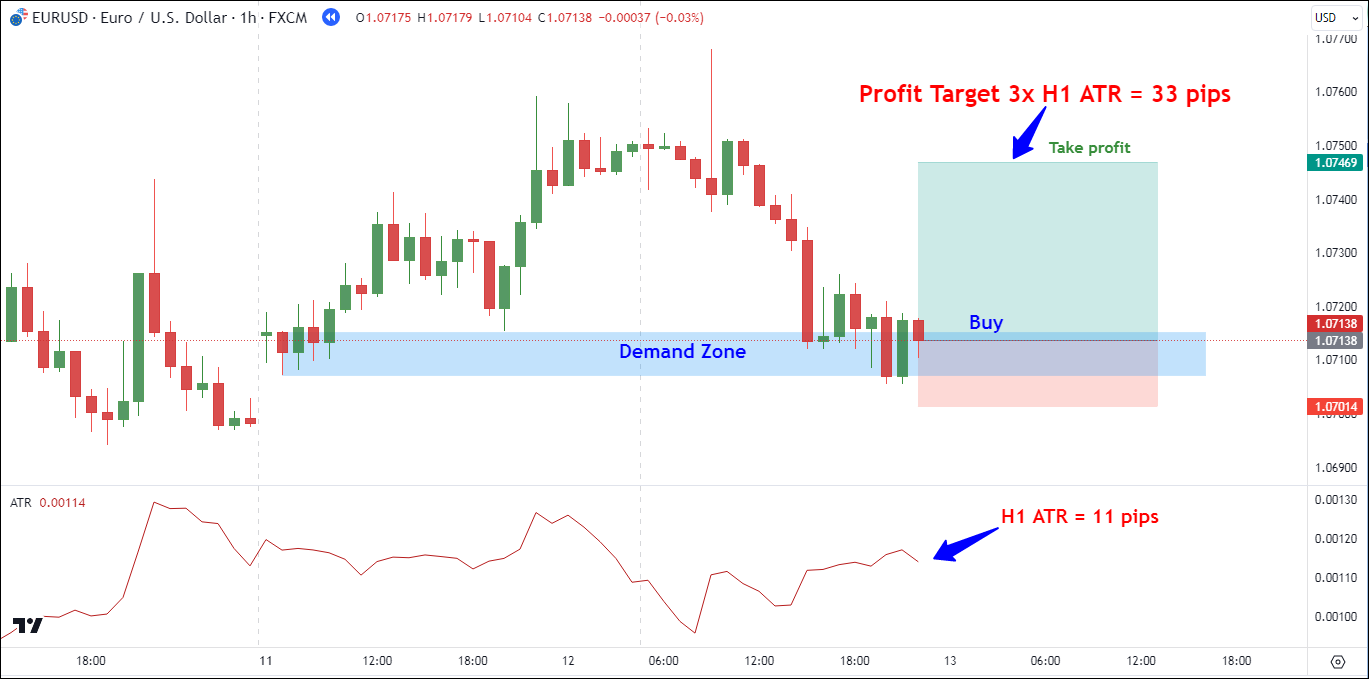
For instance, if the Daily ATR is 69 pips and the 1-hour ATR value is 11 pips, you might aim for a profit target of 2 or 3 times the ATR value (e.g., 22-33 pips) from your entry point. This approach allows you to capture potential price swings while locking in profits.
See Also:
Adjusting Risk in a Trade
In intraday trading, risk management that is responsive to the market movement is crucial. The ATR can help you adjust your position size to align with the current market conditions and your risk tolerance.
If the ATR indicates higher volatility, you might consider reducing your position size to mitigate risk. Conversely, in lower volatility scenarios, you might increase your position size to optimize potential returns. By using the ATR as a guide, you can maintain consistent risk levels across different trades and adapt to changing market dynamics.
ATR FAQs
- What Does the ATR Tell You?
The Average True Range is like a gauge for how much an asset's price might fluctuate. Day traders use it along with other tools and tactics to decide when to enter and exit trades. - Is ATR Good for Day Trading?
Yes, the Average True Range can be a valuable tool for day trading. You could use the Daily ATR to determine stop-loss and profit targets. It allows flexible risk management and confirms signals from other strategies. - What is The Best Setting for The ATR?
The Average True Range typically uses 14 days but there isn't a single ATR period that can be considered the best or most profitable. It depends on your strategy, assets, and market conditions. Shorter periods (e.g., 5 days) react faster to price changes, while longer ones (e.g., 50 days) are smoother. Ultimately, choose the ATR setting that suits your trading style and needs.
In conclusion, the Average True Range (ATR) is a powerful and versatile tool that can benefit traders of all levels. When you take the time to become experts at using the ATR, you gain the confidence to navigate the ever-changing financial markets. For more information on volatility indicators, you may check out Beginner's Guide to Using Bollinger Bands for Swing Trading.


10 Comments
Don
Sep 18 2023
Speaking of volatility indicators, it brings to mind one of the most widely used tools for assessing volatility. It is Bollinger Bands. If I remember correctly, Bollinger Bands consist of two lines placed above and below the price chart.
What's great about Bollinger Bands is their ability to adapt. They respond to market conditions, especially changes in volatility. When the market is turbulent with high volatility, these bands widen, creating a larger area around the price movements. On the other hand, during quieter times when volatility is low, the bands narrow, forming a smaller range.
Now, when we compare how effective Bollinger Bands are to the other indicator you mentioned, it leads to an important question: which one works better? Furthermore, for beginners who are just starting in the world of trading and learning about technical analysis, which indicator would be more beginner-friendly and easy to grasp?
David Tristan
Sep 18 2023
Bollinger Bands and the Average True Range (ATR) are both useful tools for assessing volatility, but they serve slightly different purposes and have distinct characteristics. Let's compare the two and discuss which one might be more beginner-friendly:
Bollinger Bands:
They are primarily used to identify volatility and potential reversals. When the bands widen, it indicates higher volatility, and when they contract, it suggests lower volatility.
Bollinger Bands can also be used to identify overbought and oversold conditions when prices touch or move outside of the bands.
They are visually intuitive, and traders often find them easy to understand, especially for identifying price extremes and potential reversal points.
Average True Range (ATR):
It quantifies the actual volatility in terms of price movement, providing a numerical value that represents volatility rather than visual bands.
ATR can help traders set stop loss levels, and position sizes, and take profit levels based on the current market volatility.
While it's a valuable tool, ATR may require some mathematical understanding as it provides a numerical value without the visual context of bands.
Which one works better depends on your trading style and specific objectives:
In terms of beginner-friendliness, Bollinger Bands are often considered more approachable because they provide visual cues on the chart that are easy to interpret. However, both indicators have their merits, and it's essential to understand how to use them effectively within your trading strategy.
Ultimately, the choice between Bollinger Bands and ATR depends on your specific trading goals and how comfortable you are with numerical data versus visual cues. Some traders even use both indicators together in their analysis to get a more comprehensive view of market conditions. As a beginner, it's a good idea to experiment with both and see which one aligns better with your trading approach and preferences.
Jacob
Sep 18 2023
I'm a swing trader, and my trading approach revolves around candlestick patterns and key support and resistance levels. Interestingly, I rely solely on my instincts and actions without using any indicators.
In practice, my trading strategy involves entering positions when I spot specific candlestick patterns forming at important price levels. One pattern I frequently use as an example is the engulfing pattern.
Now, I'm considering incorporating the ATR (Average True Range) indicator to help me set stop-loss levels. I think it makes sense because it's based on the natural price volatility. Can you guide me on how to implement this in my trading strategy?
David Tristan
Sep 18 2023
Incorporating the Average True Range (ATR) indicator into your swing trading strategy to set stop-loss levels is a sensible approach, especially if you rely on candlestick patterns and key support/resistance levels. ATR can provide you with a data-driven way to determine appropriate stop-loss levels based on the current market volatility. Here's how you can implement it:
Add ATR to Your Chart:
Set the period of the ATR to your preference, usually a common choice is 14 periods. This means it will calculate the average true range over the last 14 candlesticks (or bars).
Determine Your Risk Tolerance:
Decide how much risk you are willing to take on each trade as a percentage of your total trading capital. For example, you might decide to risk 1% of your capital on each trade.
Calculate the ATR Value:
For example, if the ATR value is 0.50, it means that, on average, the price has moved 50 pips (or points) over the last 14 periods.
Set Your Stop Loss:
Calculate your stop-loss level using the ATR value. You can do this by multiplying the ATR value by a certain multiple that aligns with your risk tolerance.
For example, if you decide to risk 1% of your capital on the trade and the ATR is 0.50, you might set your stop loss at 1 ATR below your entry point.
If you entered a long trade at $100, your stop loss would be at $99.50 in this case.
Adjust Position Size:
Depending on the calculated stop loss level, adjust your position size to ensure that the dollar amount at risk aligns with your risk tolerance.
For example, if you are willing to risk $100 on the trade, and your stop loss is $0.50 below your entry, you might buy 200 shares to keep your risk at $100 (200 shares x $0.50 = $100).
Monitor and Adjust:
Continuously monitor the ATR value as it can change over time. If the ATR increases, it may be wise to widen your stop loss to accommodate the higher volatility, and vice versa.
By incorporating the ATR indicator into your trading strategy, you're adding a data-driven element to your stop-loss placement, which can help you adapt to different market conditions and manage risk more effectively. Remember that no strategy is foolproof, so always practice proper risk management and consider using a demo account or paper trading to test your new approach before implementing it with real capital.
William
Sep 18 2023
I'm curious about the suitability of ATR (Average True Range) for scalping strategies. The earlier advice emphasized the use of ATR on time frames starting from H1 and higher, which makes sense for longer-term trading approaches.
Now, the question arises when we delve into the realm of scalping with its much shorter time frames. Do we apply ATR in the same way, or do we need to adjust our approach to suit the faster pace of scalping? I'm keen to explore the intricacies of incorporating ATR into scalping techniques and would highly value your expertise on this matter.
David Tristan
Sep 18 2023
Incorporating the Average True Range (ATR) into scalping strategies can be valuable, but you're correct that the approach needs to be adjusted to suit the faster pace and shorter time frames typically associated with scalping. Here are some considerations for using ATR effectively in scalping:
Falcon
Sep 18 2023
I really enjoyed the article; it's quite comprehensive and even includes practical examples. I have a couple of questions about two different topics.
First, let's say I receive a buy entry signal, but the price has already moved up approximately 70% of the daily ATR value. Is it still a good idea to go ahead with the buy? Could you please explain whether it's advisable or not and provide your rationale?
Secondly, regarding money management, the article mentioned that ATR can help with managing risk in each trade. However, I know there are traders who use the same trade size or lot for every trade. How does that approach work in practice?
David Tristan
Sep 18 2023
I'm glad you found the article helpful, and I'm happy to address your questions:
1. Entering a Trade After 70% of Daily ATR Movement:
- Overall Market Context: Assess the broader market context. Is there a strong trend in place, or is the market range-bound? A strong trend may continue even if a significant portion of the ATR has been used.
- Confirmation Signals: Look for additional confirmation signals, such as support or resistance levels, trendline breaks, or other technical indicators that support your buy signal.
- Risk-Reward Ratio: Evaluate the potential risk-reward ratio for the trade. If the remaining ATR allows for a favorable risk-reward ratio and aligns with your trading plan, the trade may still be worth considering.
2. Using the Same Trade Size for Every Trade:
Quill
Oct 18 2023
After reading this article, I tried using this indicator to determine my stop loss in my strategy. My strategy is quite simple, relying on a 20-period exponential moving average (EMA), and it's fairly effective in trending markets.
However, in sideways markets, this strategy is less effective and results in more losses.
The issue I'm facing is that the results aren't as good because the risk/reward ratio is lower due to the larger stop loss compared to my previous approach.
I would appreciate any tips on how to work around this and maintain a good risk/reward ratio.
David Tristan
Sep 18 2023
It's great that you're actively working on improving your trading strategy. Managing risk and maintaining a favorable risk/reward ratio are crucial aspects of successful trading. Here are some tips to help you address the issue you're facing with your strategy in sideways markets: