 Dedicated FREE FOREX VPS
 Free FOREX Virtual Private Server
 MT4 Demo Contest, Get $500
 Sign Up for an Account, Claim 60% Deposit Bonus
 Free MT4/MT5 VPS 2024
 Send E-mail and Get Free Merchandise
 $1K Refer a Friend Bonus for Pepperstone Pro clients
 Maximize Your Earnings with 100% Deposit bonus
 Trade to Win, $5,000 Monthly Demo Contest
 Claim 30% + 15% Deposit Bonus from LiteFinance
Bollinger Bands and RSI are reliable indicators on their own. Did you know that combining them together might provide a better strategy?

In order to gain insight into the market's dynamics, some traders need to use technical indicators. Most of the time, they must combine these indicators to get better accuracy in reading market opportunities.
These days, there are many combinations of technical indicators to choose from. With the various options available, traders must be able to the ones that work best for them and their trading styles. But even so, it's almost impossible to just stick with one strategy throughout the entire trading journey. Thus, traders should be adaptable and versatile to many different tools and indicators so they can adjust the strategy based on the market condition.
Among the various combinations on the market, one that's totally worth trying is the Bollinger Bands and Relative Strength Index (RSI) combo strategy. Here's how it works.
Contents
Combining Leading and Lagging Indicators
You might be wondering about the correlation between Bollinger Bands and RSI, and why are we combining them. Firstly, it's worth noting that this combination is already pretty famous among traders, so it is proven to be compatible and able to give relatively reliable signals. But the real reason why these indicators are perfect together is that the RSI is a leading indicator and Bollinger Bands is a lagging one.
Leading indicators were designed to precede future price movements. So it gives the signal before something happens. However, the downside is that they are often less reliable since there's a chance that they give false signals.
Meanwhile, lagging indicators rely on historical prices and show the signal only after something has happened. Therefore, lagging indicators are typically more reliable, but the bad news is that you are more likely to enter the game late.
Now, won't it be a great idea to combine them so they can cover each other's weaknesses?
How Bollinger Bands Work
Bollinger Bands were first introduced by a famous American trader and financial analyst John Bollinger in the 1980s. The indicator is commonly used to discover opportunities when an asset is either oversold or overbought.
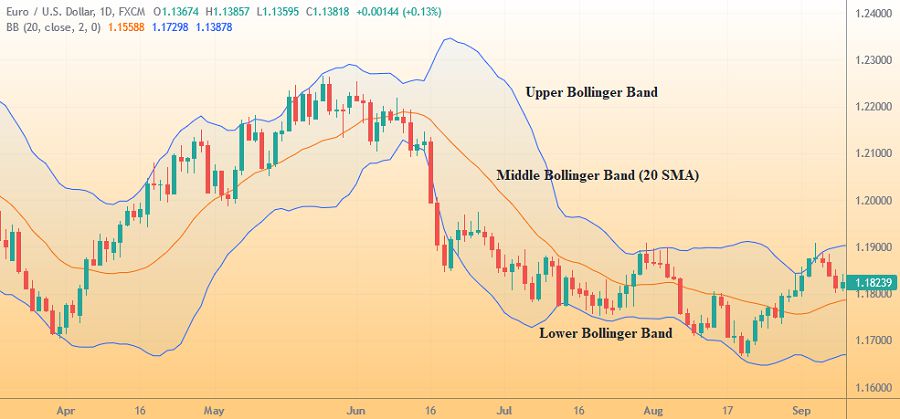
The bands basically consist of three separate lines on the price chart. The outer two lines (the upper and lower bands) represent a two-standard deviation range from the center line or the middle band calculated using a Simple Moving Average (SMA); typically a 20-period SMA. Since the standard deviations may widen or narrow dynamically according to the asset's trading range, Bollinger Bands can be highly flexible and adaptable.
To put more details, the middle band or the moving average line basically averages out the closing prices in the first 20 days as the first data point. The next point would take the earliest price, add the price on day 21, calculate the average, and so on. The standard deviation in the upper and lower bands measures how far or near the data points are relative to the middle band. If the standard deviance is low, the prices are very close to the mean. In contrast, if the standard deviation is high, the prices are far away from the mean.
What do Bollinger Bands Tell Us
Based on the empirical rule in statistics, around 68% of the data would fall within 1 standard deviation away from the mean, 95% within 2 standard deviations, and 99.7% within 3 standard deviations.
In the context of Bollinger Bands, we know that the indicator is made up of the upper band and the lower band, which are 2 standard deviations away from the mean. Based on the diagram, 95% of the data are within the 2 standard deviations from the mean. This is why you would often find that the prices mostly move within the Bollinger Bands. When the price does move beyond that, it usually indicates an extreme overbought or oversold so the price is going to change direction and retrace back sharply within the upper and lower bands.
The closer the prices move to the upper band, the more overbought the market is, so it can be a sell signal for traders. In contrast, the closer the prices move to the lower band, the more oversold the market is, so it can indicate a buy signal for traders. Other than that, Bollinger Bands can also be used to measure market volatility. When the bands widen, the market becomes more volatile, and when the bands contract, the market is less volatile.
See Also:
How the RSI Works
Relative Strength Index (RSI) was discovered by an American technical analyst J. Welles Wilder Jr. in 1978. RSI is a momentum indicator that basically measures the speed and change of price movement in a certain period. The common use of an RSI is to determine whether the market is overbought or oversold, but it can also be used as support and resistance levels.
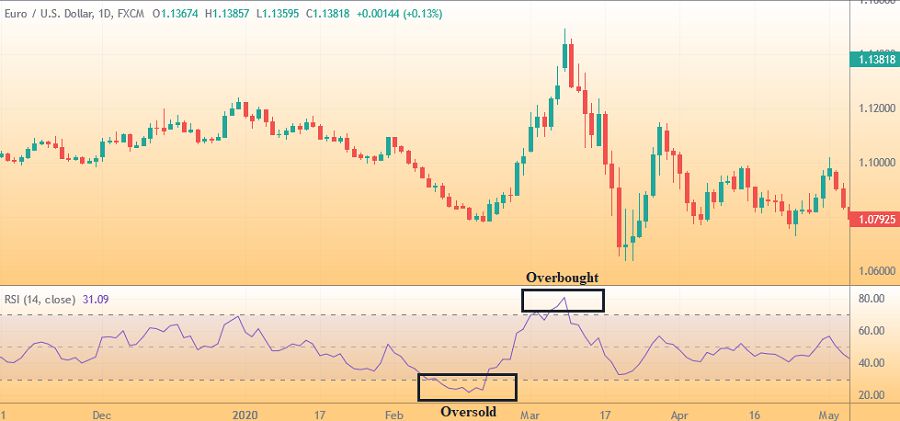
As an oscillator indicator (a line graph that moves between two extremes), RSI values are shown on a range of 0 and 100. If the RSI moves above 70, then the asset is usually considered overbought and indicates a selling signal. On the other hand, if the RSI moves below 30, then the asset is considered oversold and shows a buying signal. However, these predictions are, again, not always accurate. Some traders would wait for the indicator to move above 70 and then decline before selling, or move below 30 and then rise back before buying.
Bollinger Bands and RSI Combo Strategy
After learning the basics of both Bollinger Bands and RSI, we can now put the two indicators together and see why this combo strategy is so famous among traders worldwide.
The strategy is actually quite simple. First of all, we would want to look for prices that hit either the upper or lower band. Such situations usually trigger the price to reverse because it has reached an extreme end. As explained before, if the price hits the upper band, then it indicates overbought and if the price hits the lower band, then it shows oversold.
Meanwhile, pay attention if the RSI value moves above 70 or below 30. RSI value above 70 is considered overbought and an RSI value below 30 is considered oversold. However, it's important to note that the leading indicator shows an early warning signal before the trend reverses. That means, when the RSI hits the oversold or overbought region, the price may not react immediately. It may take a few days before the trend begins to show a reversal.
That being said, if an asset price hits the upper band of the Bollinger Bands and, at the same time, the RSI exceeds above 70, you can interpret it as an overbought condition and then sell the asset. If you're looking for a buy signal, wait until the price reaches the lower band of the Bollinger Bands and the RSI is below 30.

Keep in mind that to get a strong signal, Bollinger Bands and RSI should be moving in the same direction. If the two indicators don't match or show the same signal, don't rush to act. For instance, suppose the price is going down and eventually reaches the lower Bollinger Band but the RSI is not under 30, it means that the asset may not be really oversold as the Bollinger Bands seem to indicate. Therefore, don't buy the asset just yet since the downtrend could continue.
Another tricky thing about this strategy is that the price can stay in an overbought or oversold position for a long time, perhaps even weeks or months. So even if both the Bollinger Bands and the RSI show strong overbought or oversold situations, there's still a possibility that the reversal won't happen right after.

In addition, you can also add more confirmation signals to improve the strategy further. The first one is the RSI divergence. It basically refers to the situation where the asset price moves in the opposite direction from the indicator. An RSI divergence can either be bullish or bearish. If a bearish divergence occurs, it signals a possible downtrend and shows a good sign to sell the asset. In contrast, if a bullish divergence occurs, it signals a possible uptrend and shows a good sign to buy the asset.
The second confirmation that you can use is the candlestick patterns. Candlestick patterns can tell you a lot of things but only if you pay attention carefully to them. Try to observe the behavior of the candlestick patterns at the point of RSI divergence. In a reversal from a downtrend, we would want to look for bullish patterns such as a bullish hammer or dragonfly doji. In a reversal from an uptrend, we should look for bearish patterns like bearish engulfing or gravestone doji. Also, keep in mind that the price must close above the previous candlestick price.
Final Words
Both Bollinger Bands and RSI indicators are already pretty popular on their own, but combining them would actually make a much greater analysis. Using this strategy, we can get a sense of the current position of the price and predict when the price will reverse after it reaches oversold or overbought.
Remember that while the strategy looks smooth and pretty easy to understand, in reality, it may not be that simple. The price might be stuck in an oversold or overbought position for an unpredictable amount of time. That is why we need more confirmation signals, such as the RSI divergence and candlestick pattern. In the end, make sure to test the strategy out in the demo account first and get familiar with the indicators before putting real money into it.


3 Comments
Hamza
Jan 21 2022
If the bollinger bands and RSI combined give a bullish signal (lower band and 30 RSI) but the DEMA crossover produce a death cross... how to take a trading decison?
Atta
Jan 15 2024
Certainly! After reading this article, I've learned that utilizing the Bollinger Bands and RSI combination for trading is surprisingly straightforward. According to the article, a robust signal is generated when both Bollinger Bands and RSI are moving in the same direction. For instance, when RSI and Bollinger Bands exhibit lower values on the graph — with RSI falling below 30 and the lower Bolinger Bands intersecting with candlesticks — it indicates a favorable time for a Buy. Conversely, when RSI hits 70, and the candlestick aligns with the upper Bollinger Bands, it signals a time for Take Profit (TP) and initiating a Sell trade.
Regarding long-term trading using these strategies, a lingering question arises. Is it viable to implement these techniques for extended trading periods such as position trading?
Joshua
Jan 18 2024
Absolutely! Having delved into the article, the simplicity of combining Bollinger Bands and RSI for trading caught my eye. The article emphasizes a clear signal when both indicators move harmoniously. When RSI dips below 30 and coincides with the lower Bollinger Bands intersecting candlesticks, it's an opportune moment for a Buy. Conversely, an RSI hitting 70, aligned with the upper Bollinger Bands and candlesticks, signals a strategic time for Take Profit (TP) and initiating a Sell trade.
Now, when it comes to employing these strategies for long-term trading, a pertinent question arises. Can these techniques withstand the test of time in extended trading periods? The answer lies in their adaptability. While Bollinger Bands and RSI can be effective in longer timeframes, traders must consider the overall market scenario, adjusting indicator parameters as necessary. Augmenting these indicators with fundamental analysis and other technical tools enhances the resilience of long-term trading decisions (read : Long-Term Trading Signals, How Do They Work? ). Flexibility and a continuous evaluation of strategy effectiveness, coupled with adjustments based on evolving market dynamics, remain pivotal for sustained success in extended trading ventures.