 Dedicated FREE FOREX VPS
 Free FOREX Virtual Private Server
 MT4 Demo Contest, Get $500
 Sign Up for an Account, Claim 60% Deposit Bonus
 Free MT4/MT5 VPS 2024
 Send E-mail and Get Free Merchandise
 $1K Refer a Friend Bonus for Pepperstone Pro clients
 Maximize Your Earnings with 100% Deposit bonus
 Trade to Win, $5,000 Monthly Demo Contest
 Claim 30% + 15% Deposit Bonus from LiteFinance
Having a good strategy is more important than ever. The BBMA strategy is a top choice because it combines two popular indicators and a complete set of rules with tested profitable outcomes.
BBMA, which stands for Bollinger Bands and Moving Average, is a trading method that is quite popular and widely used not only in the forex market but also in the stock and commodity markets. This strategy is different from another version of BBMA called BBMA Oma Ally, which uses two Moving Averages.
In the BBMA strategy, traders use the Bollinger Bands to spot possible changes in direction and the Moving Average to decide when it's a good time to get in on a trade.
How Does BBMA Trading Strategy Work?
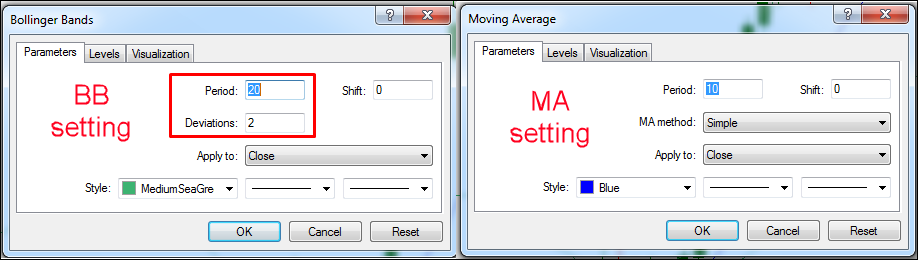
For the Bollinger Bands, the standard settings are a period of 20 and a deviation of 2. For the Moving Average, we use a period of 10.
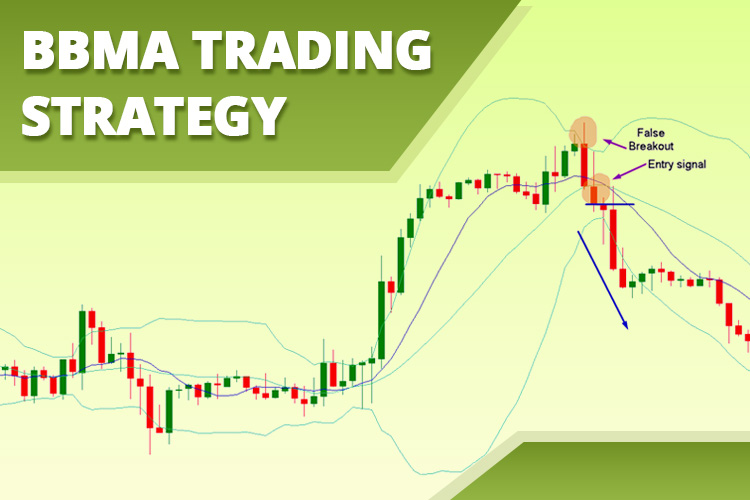
The basic idea is to look for moments when the price breaks out above or below the Bollinger Bands and then reverses its direction to go back inside the Bollinger Bands.
When the price briefly breaks through the Bollinger Bands and then turns back, it's a sign that the trend is likely to change. During this time, you'll often see candlesticks with either long bodies or long shadows.
This strategy can be used on various time frames, but it's best to apply it on higher time frames like H1 (1 hour) or above. This is because, on shorter time frames like M1 and M5, there is a lot of random price movement that can make things confusing.
Buy Setup
To take a buy position, follow the steps below.
- Keep an eye on the price as it tests the lower Bollinger Bands line. Sometimes, the price may briefly go beyond this line but should bounce back inside in the next candle. The best situation is when the price forms a long lower shadow, showing that it got pushed back and returned inside the Bollinger Bands.
- Once the test happens, wait for the price to rise and break through the Moving Average line. When the price successfully closes above this line, it's time to enter a buy position.
- Set a stop loss just below the lowest price before this move.
- To decide where to take your profit, you can aim for the previous resistance level or use a risk-to-reward ratio of 1:2.
Sell Setup
To enter a selling position, adhere to the following steps.
- Watch for the price to test the upper Bollinger Bands line. During this test, the price might briefly close outside the Bollinger Bands, but it should bounce back inside in the next candle. The best situation is when the price creates a long upper shadow, showing it got pushed back and returned within the Bollinger Bands.
- After that, wait for the price to drop and go below the Moving Average line. When the price successfully closes below the Moving Average, it's the signal to enter a sell position.
- For your stop loss, just place it above the highest price before this move.
- As for your take profit, you can aim for the previous support level or use a risk-to-reward ratio of 1:2.
Case Study
To make it easier to grasp, I'll show you two chart examples: one where we make a profit and another where we end up with a loss.
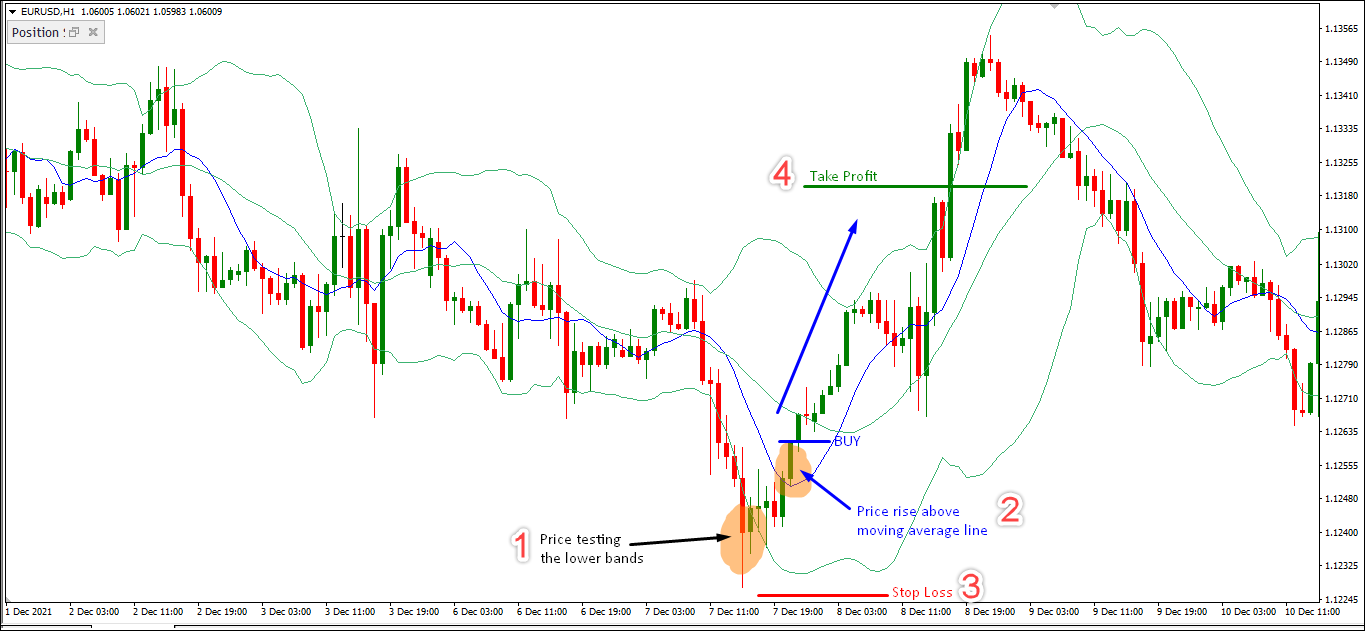
#1 GBP/USD - Buy
In the H1 chart of GBP/USD shown below, we can clearly see that the price is on a downward trend. Today's price is not only below the Moving Average line but also heading down according to the Bollinger Bands indicator.
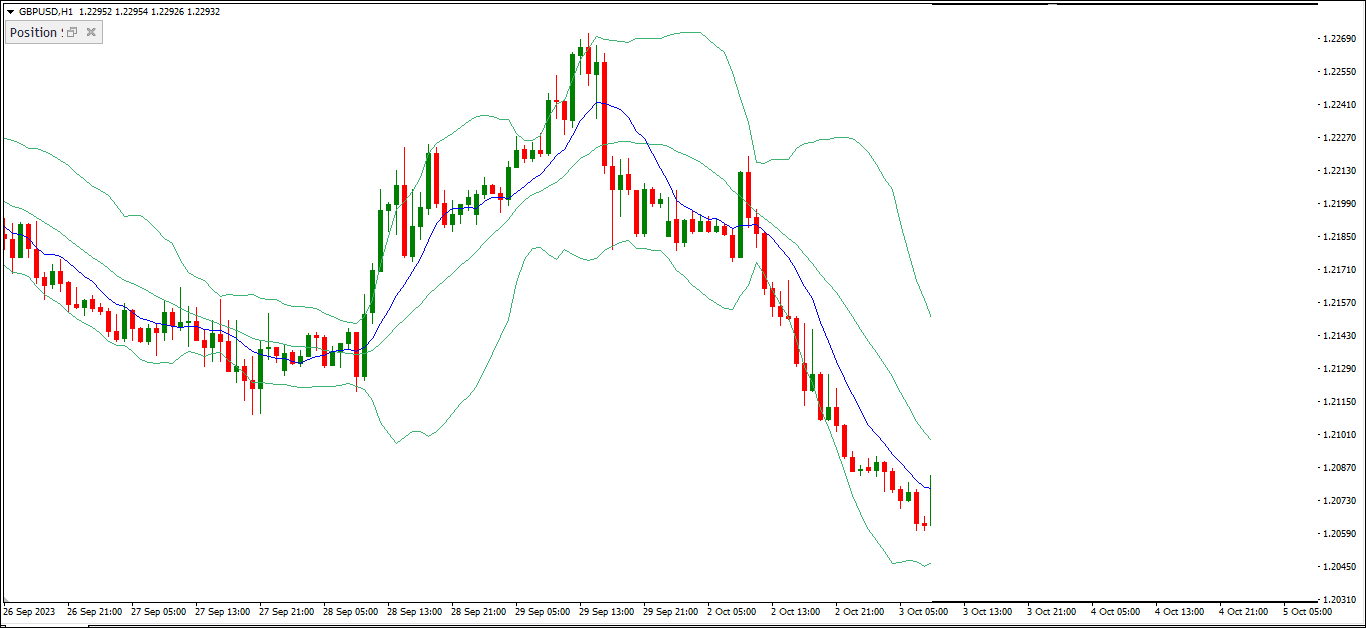
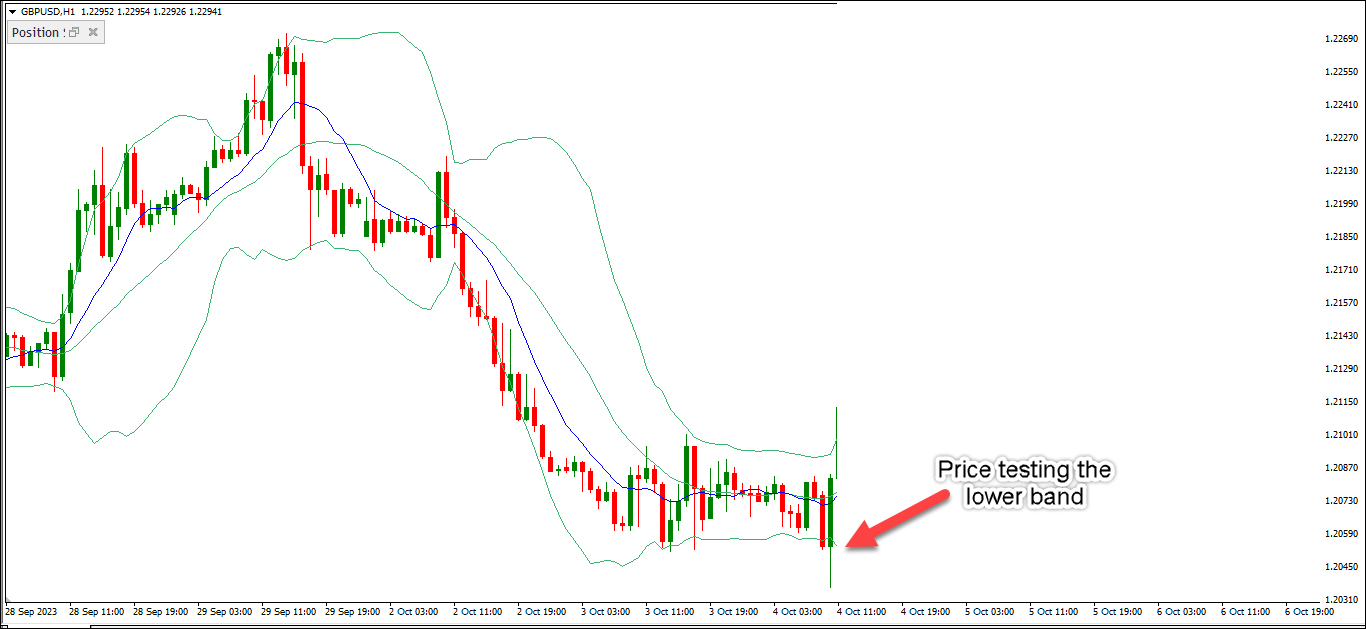
Then, the price decides to give the lower Bollinger Bands a test. We notice a candlestick with a really long lower shadow, but it ends up staying within the Bollinger Bands.
Next, the price closes above the Moving Average line. This is our signal that the setup is good, and we go ahead with a buy position.
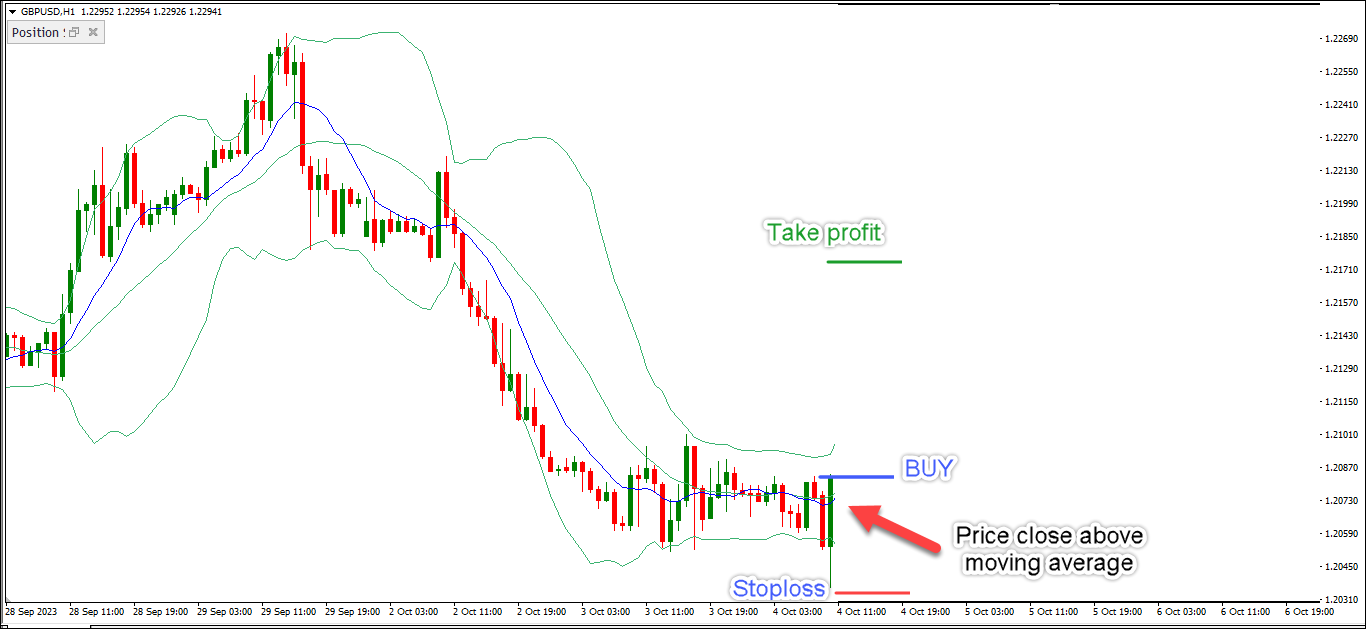
For safety, we put a stop loss just below the lowest price we've seen so far, which in this case is the long-shadowed candlestick from earlier. As for our take profit, we're aiming for a 1:2 risk-to-reward ratio.
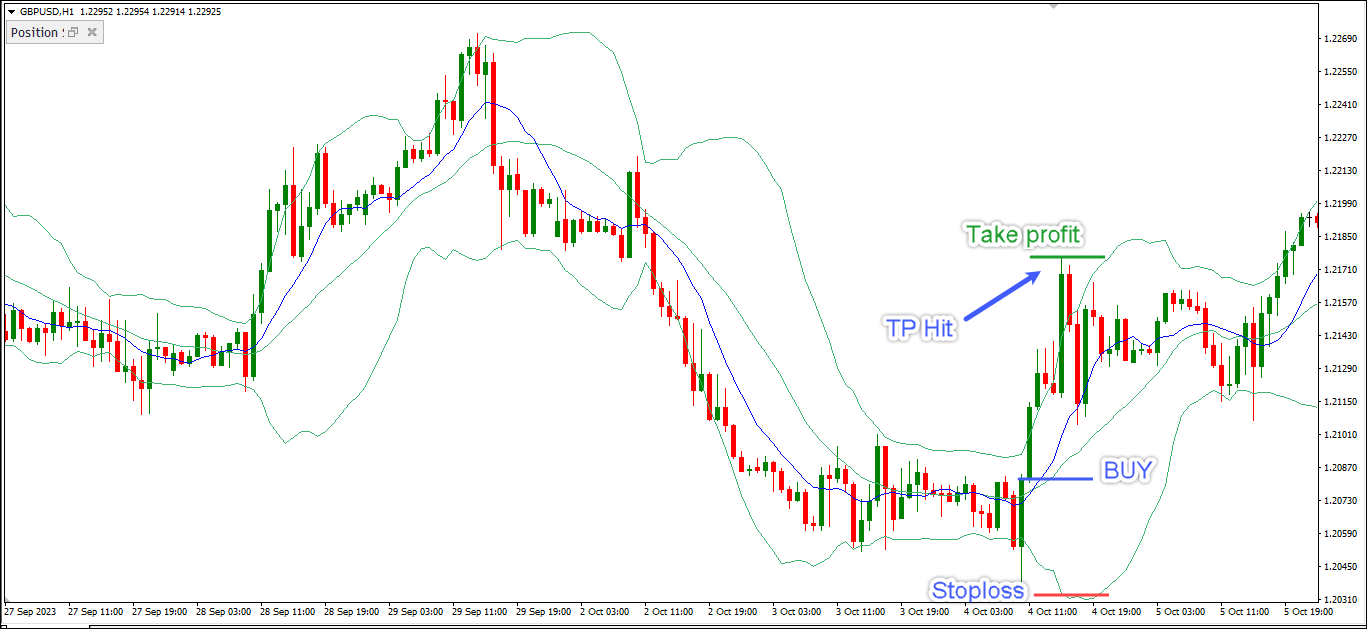
Once we're in the trade, the price takes off pretty swiftly and eventually hits our take-profit level. This trade ends up giving us a profit that's twice the risk of our stop loss, a nice 2R gain.
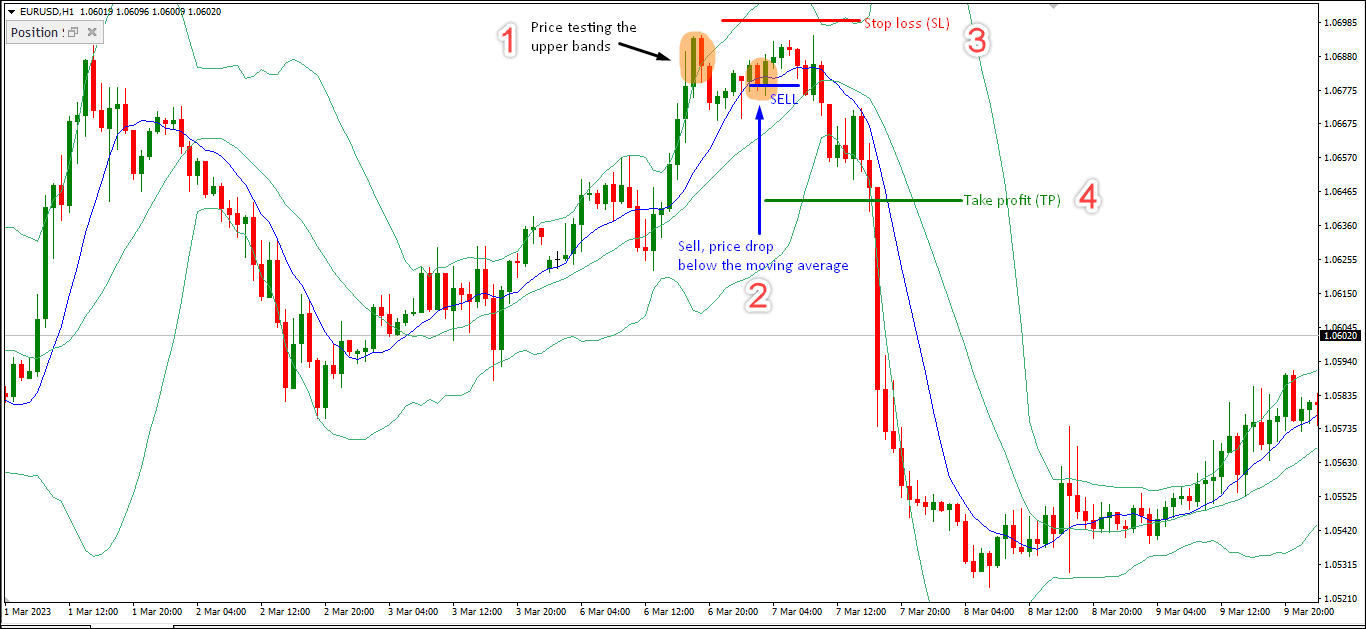
#2 EUR/USD - Sell
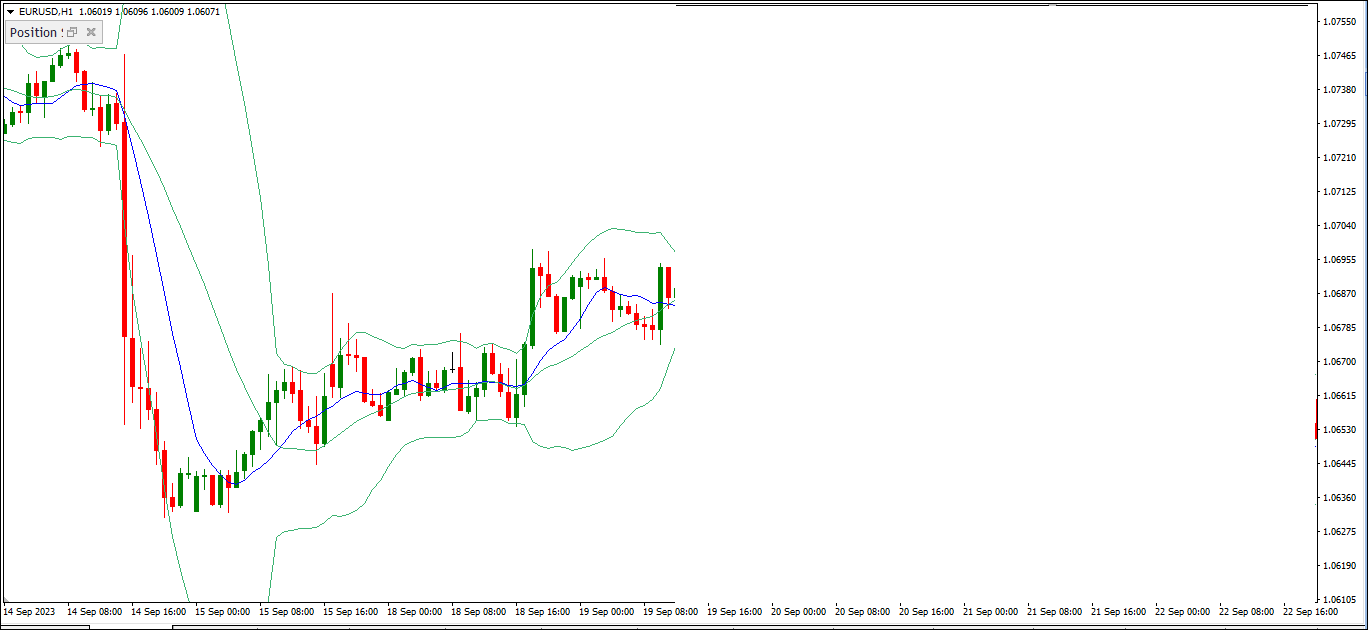
In the H1 chart for EUR/USD shown below, it's clear that the price is on an upward trend. You can tell because the price is above the Moving Average and the Bollinger Bands are sloping upwards.
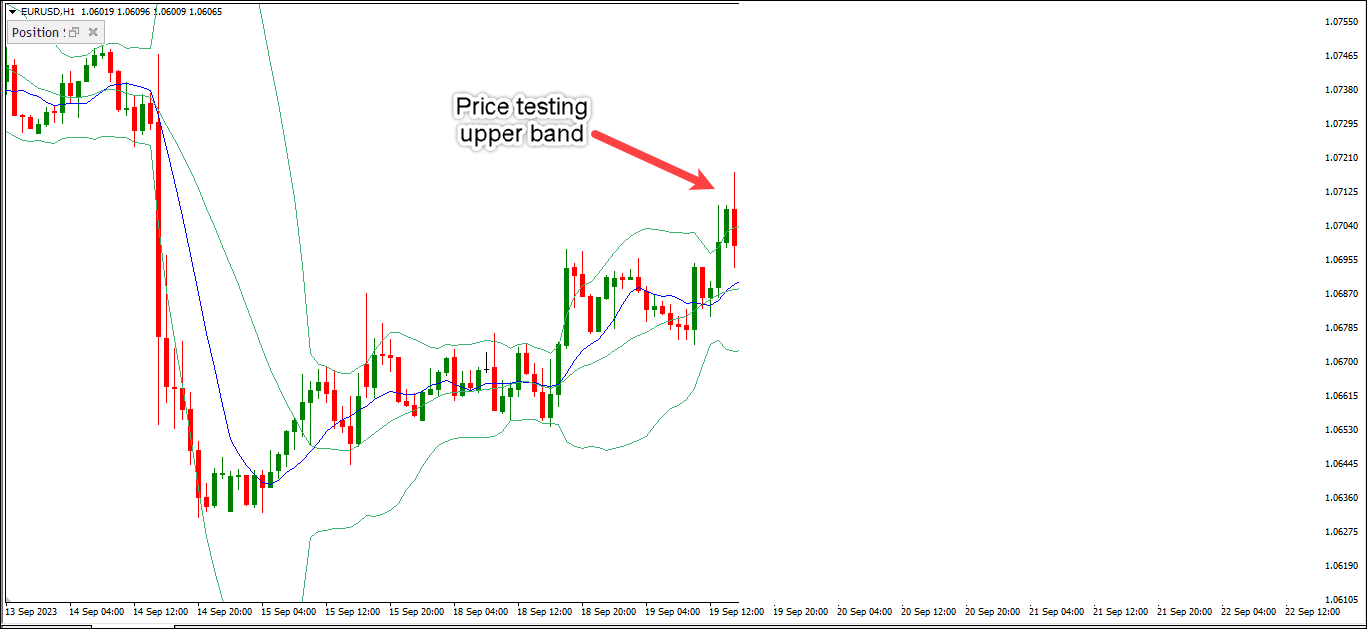
Then, something interesting happens. The price tests the upper Bollinger Bands. We see three bullish candles trying hard to break through that upper line but not quite making it; they end up staying within the Bollinger Bands.
After that, the price takes a dip and closes below the Moving Average line. That's our signal for a valid sell position, so we go ahead with it.
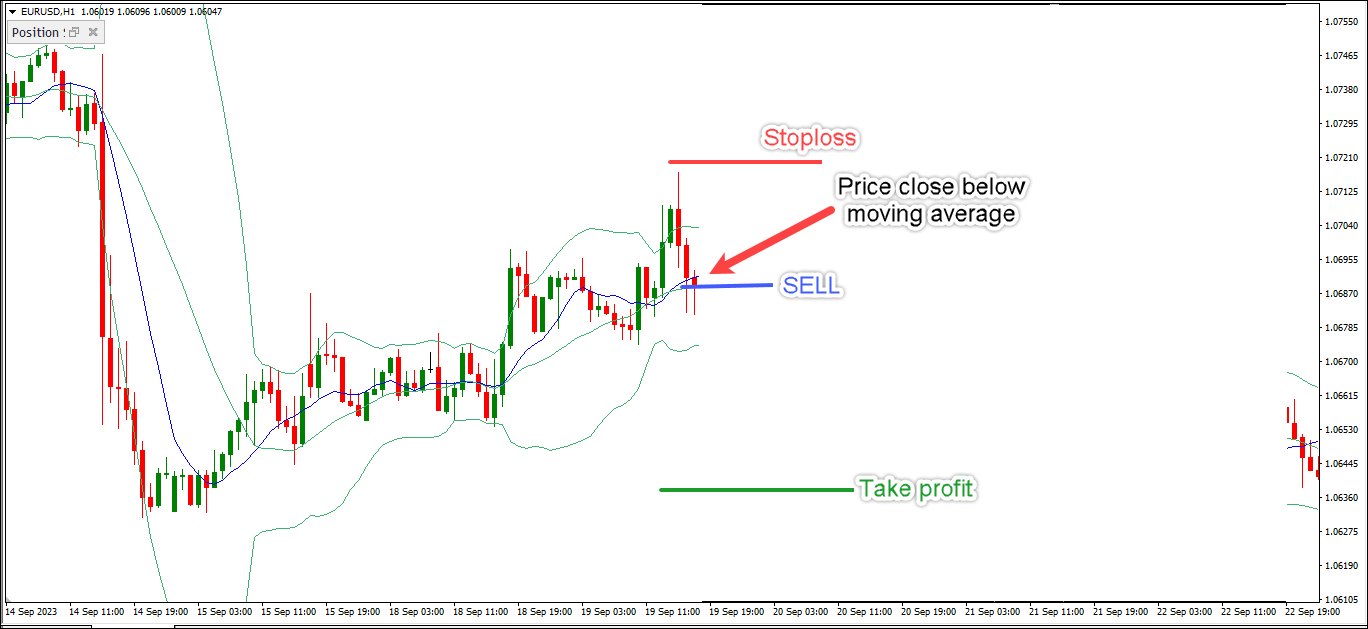
For safety, we place a stop loss just above the highest price we've seen recently. And for our take profit, we're going for a 1:2 risk-to-reward ratio.
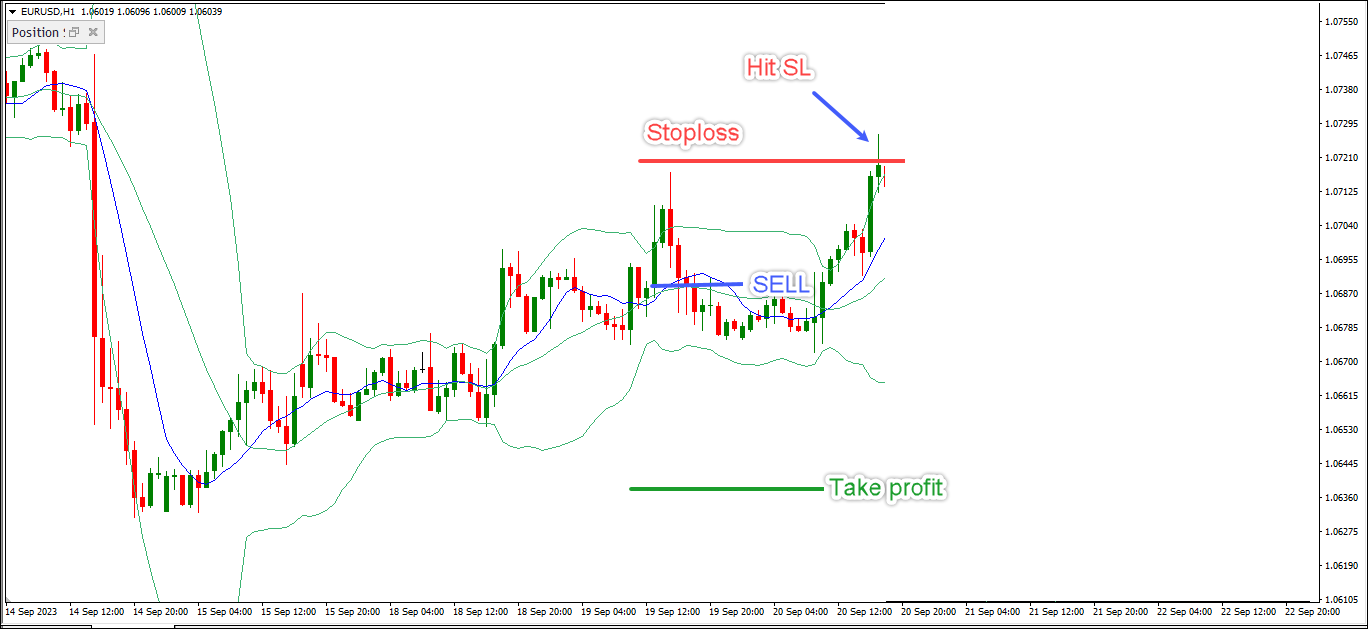
But here's the twist – after entering the sell position, the price doesn't drop much and quickly turns back up, hitting our stop loss. This particular sell position ends up with a loss.
BBMA Trading Tips
Here are some tips to enhance your BBMA trading strategy.
- Trade at Important Price Levels: To make BBMA trading more accurate, only trade when the price is at important levels. This means looking for a confluence between key levels and BBMA entry signals. This approach means you'll trade less often, but your chances of success are higher. It is because you're entering areas where the price is more likely to turn around (reverse).
- Wait for Confirmation Before Entering a Trade: False breakouts can lead to unprofitable trades, causing unnecessary losses. To avoid this, exercise patience and discipline. Wait for the market to confirm the validity of a breakout before you enter a trade.
- Do Not trade Against the trend: BBMA is particularly effective in trending markets. However, when using this strategy, prioritize trading in the direction of the overall trend and not against it, as it improves your chances of success.
- Risk Management: Implement strict risk management rules. Determine your risk tolerance and set stop-loss orders to limit potential losses. A common approach is to use a 1:2 risk-to-reward ratio, as mentioned in the previous explanation.
- Stay Informed on News Events: Regularly monitor an economic calendar to be aware of upcoming fundamental news releases, such as economic data, earnings reports, and geopolitical events. High-impact news releases can trigger temporary price spikes and breaches of Bollinger Bands.
Pros and Cons
Trading using the BBMA strategy has its pros and cons, just like any trading method. Let's check out the pros and cons of using BBMA.
Pros:
- Adaptable: You can use BBMA for different trading styles and in various markets, which is pretty flexible.
- Clear Signals: BBMA gives you really clear signs of when to start and stop a trade, making your decisions smarter.
- Stay Safe: It helps you manage risk with tools like stop-loss and take-profit, so you don't lose too much money.
- Customize It: You can tweak BBMA to fit your own trading goals and what's happening in the market.
Cons:
- False Signals: BBMA, like any strategy, can generate false signals, leading to unprofitable trades. Traders must be prepared for occasional losses.
- Requires Skill: Successful implementation of BBMA requires a good understanding of the indicators and the ability to interpret market conditions accurately.
- Market Conditions: BBMA may perform differently in different market conditions. It's essential to recognize when to use or adapt the strategy.
Backtesting BBMA Trading Strategy
To show how well the BBMA strategy works, we did a backtest for six months. We split it into two tests that run from January to March 2023 and May to July 2023.
We checked how the strategy did with the EUR/USD currency pair using an hourly chart, where we used the BBMA to identify entry and exit positions as explained above.
Here's how our testing turned out.
Details | Value |
Total Trade | 95 |
Profit | 44 trades |
Loss | 51 trades |
Winrate | 46,3% |
Average Profit | 1R |
Average Loss | 2R |
Maximum consecutive losses | 5 |
Maximum consecutive profits | 4 |
Average Trade per month | 15 |
Average profit per month | 6R |
Expectancy Value | 0,515 |
Total Profit in 6 months | 37R |
The test results show four important things to discuss:
- Win Rate Below 50%: Out of 95 trades, we had 51 losses and 44 profits, resulting in a win rate of approximately 46.3%. To simplify, we had more trades that didn't go in our favor than those that did. If the idea of having more losses than wins is uncomfortable for you, this approach might not be suitable.
- Average Monthly Trades - 15: With an average of 13 trades per month, it's important to understand that this means we won't be trading every day, especially when using the 1-hour time frame. On average, we'll be making about 4 trades each week. If the thought of not trading daily worries you, this approach may not be the right fit.
- Maximum Consecutive Losses - 5: In our tests, we experienced up to 5 losses in a row. That's more than our longest winning streak, which was 4 trades. So, not only did we have more losing trades overall, but we also had times when we faced longer strings of losses compared to winning streaks. If we extended our trading to a bigger sample, say 100 trades, we could encounter as many as 7 consecutive losses.
- Positive Expectancy Value: Despite the win rate being less than 50% and facing longer losing streaks, the strategy still made a profit. This is because we maintained a smart risk-reward ratio of 1:2. One successful trade could make up for the losses from two previous trades. Over 6 months, following this approach resulted in a total profit that was 37 times more than what we initially risked, often referred to as 37R. It shows that managing our risks wisely can lead to success even when we don't win more often than we lose.
FAQ on BBMA Trading Strategy
- What is the Win Rate of the BBMA Strategy?
The BBMA trading strategy's success can vary because of how you use it, the type of market you're in, and your own trading skills. There's no fixed win rate for BBMA, and if you only use BBMA, your chances of winning are probably less than 50%, like what historical data shows. To increase your chances, you need to be good at managing risk, choosing the right trade size, and sticking to your plan. - What is the BBMA Golden Setup?
The "BBMA Golden Setup" is a trading term when certain conditions are met, like the price touching the upper or lower Bollinger Band and Moving Averages crossing. Traders also watch for specific candlestick patterns for this particular occasion. But remember, the exact rules can vary between traders, and it's important to test and be careful when using it in real trading. - What is The BBMA Strategy by OMA Ally?
It is a specific BBMA strategy developed by Oma Ally, a reputable forex trader from Malaysia. The strategy stands out because it involves two Moving Averages and not the combination of Bollinger Bands and Moving Average. Oma Ally's version is more detailed with clear step-by-step instructions. If you decide to go with Oma Ally's version, make sure to follow his specific guidelines carefully.


10 Comments
Gery
Oct 16 2023
Wow, this strategy looks impressive. I'm intrigued because, upon examining the rules more closely, they seem straightforward, and the risk-reward ratio appears quite favorable. In the past, I used the Bollinger Bands and RSI indicators, but the issue was that I was overly fixated on achieving a high win rate while maintaining a 1:1 risk-reward ratio.
Over the past two months, my account didn't see any significant gains, and the outcome was merely breaking even or returning to my initial investment. While I did make some profits, they essentially just brought me back to where I started.
Now, with regards to BBMA, there are already established guidelines, and according to the results from the web test, the win rate stands at 46%. A win rate below 50% is likely due to a multitude of false signals, among other factors.
So, my question is, how can I avoid receiving signals that are less reliable for this BBMA strategy? My objective is to ensure that my trading results consistently achieve a win rate exceeding 50%.
David Tristan
Oct 16 2023
It's great that you're exploring different trading strategies and being open to new approaches like the BBMA (Bollinger Bands and Moving Average) strategy. Achieving a higher win rate can be challenging, but there are several steps you can take to improve the reliability of signals and increase your chances of success with this strategy:
Nina
Oct 16 2023
I gave this BBMA strategy a try out of curiosity. I tested it on my trading account for approximately a week.
Initially, when I followed the instructions, I saw profitable results. In about three days, I had more than a 10% profit.
However, the issue began on the fourth day and continued thereafter when my account started accumulating substantial losses. Upon reviewing my actions, I realized that I had started trading recklessly, or, in simpler terms, overtrading.
Typically, when I'm in a losing position, I immediately regret my impulsive trade decisions. But when I'm in profit from previous trades and still have confidence in my strategy, I can't resist the urge to overtrade.
Is there a practical solution to deal with overtrading while using the BBMA strategy?
David Tristan
Oct 16 2023
Dealing with overtrading can be challenging, but it's a common issue that many traders face. It's great that you've identified the problem and are looking for solutions. Here are some practical steps to help you avoid overtrading while using the BBMA strategy:
Determine the maximum percentage of your trading capital that you're willing to risk on a single trade and adhere to it.
Mike A
Oct 16 2023
The content is indeed interesting, and I do use BBMA at times. Although the BBMA I employ is a different variant, BBM Oma Ali.
Essentially, I've got the basics and rules down. I keep a book on it, and I've even pinned the information in my trading space for quick reference.
However, the real challenge lies not in the strategy itself but in the psychological aspect, especially in exercising the discipline to avoid impulsive trades. So, could you please offer some tips on the psychology of trading, specifically in the context of the BBMA strategy, to improve the results?
David Tristan
Oct 16 2023
Managing the psychological aspect of trading is often more challenging than mastering the technical aspects of a strategy. It's crucial to maintain discipline and emotional control, especially when using a strategy like BBM Oma Ali. Here are some psychology-related tips to help you improve your trading results with this strategy:
Quinn
Oct 16 2023
I noticed there's a section at the bottom displaying the results of back-testing the BBMA strategy. It mentions that the testing period spanned six months.
The results clearly show that this strategy is profitable, even though its win rate is below 50%. As a novice, this piques my interest because it remains profitable despite having more closed positions.
The issue is, that I'm not yet familiar with how to conduct this back-test on a chart. Could you explain how to do it effectively so I can also assess the win rate and long-term profitability of my current strategy?
David Tristan
Oct 16 2023
Performing back-testing on a trading strategy is a valuable step in assessing its historical performance. To effectively conduct a back-test on a chart, you can follow these steps:
Apply the rules of your strategy to this historical data. This typically involves marking entry and exit points on the chart based on your strategy's conditions. You may need to manually track these points if your trading platform doesn't offer an automated back-testing feature.
You can also calculate metrics like the risk-reward ratio, drawdowns, and average trade duration to assess profitability further.
Barry
Oct 16 2023
The explanation is excellent, and it's quite thorough. What makes it even more valuable is that the content is backed up with back-testing, which gives us a clear idea of what to expect from this strategy.
The section about BBMA trading tips, emphasizes the need for strict risk management. Could you provide a more detailed explanation of how to put risk management into practice?
Is it sufficient to just use the risk-reward ratio or aim for a 1:2 ratio? What's the recommended level of risk tolerance, and how should we determine the stop loss?
David Tristan
Oct 17 2023
I'm glad you found the explanation valuable, and I'm happy to provide more information on implementing risk management in trading, especially when using the BBMA (Bollinger Bands and Moving Average) strategy. Risk management is crucial to protect your capital and ensure the long-term sustainability of your trading endeavors.
Here's a detailed explanation of how to put risk management into practice: