 Dedicated FREE FOREX VPS
 Free FOREX Virtual Private Server
 MT4 Demo Contest, Get $500
 Sign Up for an Account, Claim 60% Deposit Bonus
 Free MT4/MT5 VPS 2024
 Send E-mail and Get Free Merchandise
 $1K Refer a Friend Bonus for Pepperstone Pro clients
 Maximize Your Earnings with 100% Deposit bonus
 Trade to Win, $5,000 Monthly Demo Contest
 Claim 30% + 15% Deposit Bonus from LiteFinance
Understanding trend continuation patterns can help you improve your skills in forex trading. So how do we identify them and use them to look for trading opportunities?

Forex trading involves various approaches, including technical analysis, which involves analyzing statistical trends on a chart to identify trading opportunities. Traders look for specific price patterns that indicate support and resistance levels, signaling either a trend reversal or continuation.
One important pattern is the trend continuation pattern, suggesting that the price will keep moving in the same direction after completing the pattern. This can be compared to a road trip where you take breaks but eventually continue driving in the same direction.
Several continuation patterns are typically used in technical analysis. The patterns can be bullish or bearish and can help you find the right trading opportunity if you know the right way.
Understanding Trend Continuation Patterns
A continuation pattern is called such because the price tends to continue the previous trend after it breaks out of the formation. Continuation patterns tend to be the strongest when the trend leading to the continuation pattern is strong, and the continuation pattern itself is relatively small compared to the trending waves.
Suppose the continuation pattern takes a while and is almost as big as the preceding trend. In that case, it may signal increased volatility, a larger move against the trend, or a lack of conviction in the trending direction.
Therefore, it is riskier to consider it as a continuation pattern. Also, the wave that followed the continuation pattern can start going up only slightly and then forms another continuation pattern, breaking out again several times. If this happens, the market players hesitate to push the price dramatically, making the trend less reliable.
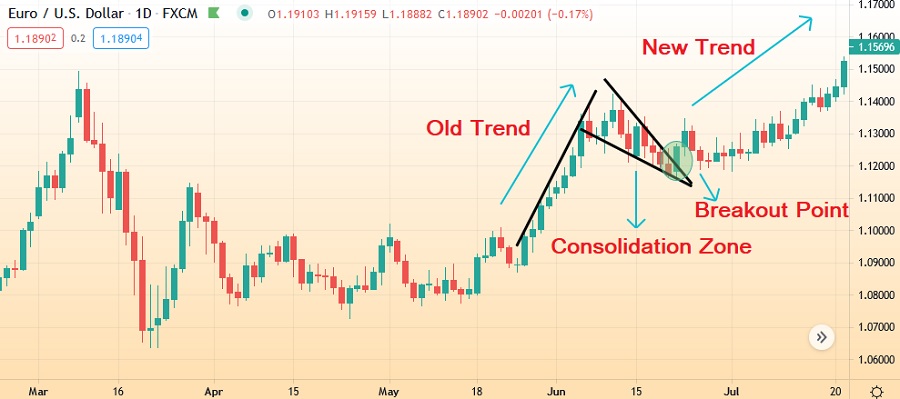
The Basic Structure of Continuation Patterns
Every continuation pattern consists of four important pieces:
- Old Trend – the trend at the beginning of the price movement.
- Consolidation Zone – a constrained area indicated by set support and resistance levels.
- Breakout Point is when the price changes direction and breaks out from the consolidation zone.
- New Trend – the trend that formed after the continuation pattern completes. The new trend will continue moving in the same direction as the old trend.
Different Types of Trend Continuation Patterns
Essentially, there are several different shapes of continuation patterns. Each consists of the same four aspects mentioned above so that they may look somewhat similar at first glance.
The only real difference that you can see is in the consolidation zone. You may later recognize that the consolidation zones of some continuation patterns have support and resistance levels that converge as the pattern forms. In contrast, others have support and resistance levels that remain parallel.
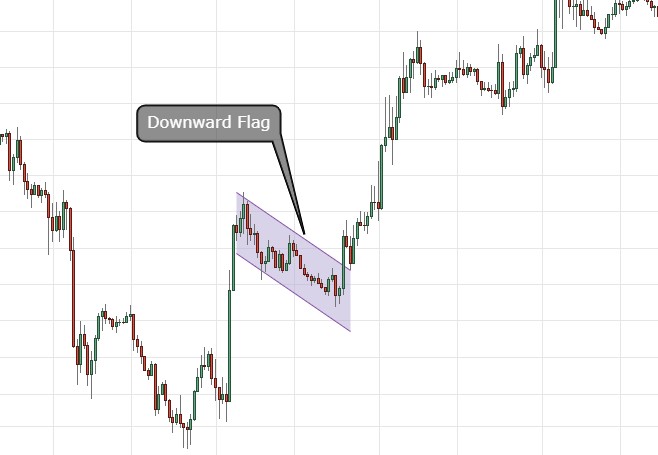
1. The Flag Patterns
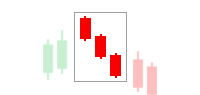
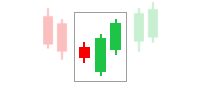
The flag pattern is one of the easiest trend continuation patterns to spot. It consists of several large candlesticks that would form a long "flagpole" and a small "flag" called the consolidation zone.
The pattern can either be bullish or bearish. You can check the color of the candlesticks that formed the flag to determine the direction of the trend. If it's going upward, the new trend will continue that way, and vice versa.
Typically, flag patterns are related to price movements that result from the news. The price will drop or rise dramatically after a strong trend and then be followed by continuation.

The following insights are useful to trade with flag patterns:
- Before you open a position, wait until the formation of the consolidation zone is complete.
- A bullish flag pattern indicates a signal to enter a long position, whereas a bearish flag pattern indicates a signal to open a short position.
- In a bullish flag pattern, it makes sense to open a long position after the upper boundary of the consolidation zone is broken. If you enter at the market price, you should open after the breakout candlestick closes above the resistance level. But if you're opening a pending order, the buy stop should be slightly above that level. The same principle applies to the bearish flag pattern, but in the opposite direction.
- The profit potential for the flag continuation pattern is around 80-100% of the flagpole size.
- Place the stop loss beyond the opposite level of the consolidation zone.
2. The Pennant Patterns
Pennants are very similar to flag patterns. It also has a "flagpole" formed by bearish or bullish candlesticks. Profit targets are also quite the same, approximately 80-100% of the flagpole.
However, the differences between flags and pennants lie in the forms of the consolidation zones. While flags move between parallel lines ascending, descending, or sideways, pennants move and form a triangle shape.
In pennant patterns, the price may look like it's squeezed inside the triangle, and the moment it closes in, it will spike again in the direction of the previous pattern. The sharp increases or decreases in the price show that the market is taking a breather before breaking out again.
So, instead of a horizontal rectangle like flags, we will have to wait for a breakout in the triangle-shaped consolidation zone. Once you spot this pattern, place a stop loss right beyond the opposite level of the pattern.

3. The Triangle Patterns
Triangle patterns are also commonly included in the continuation patterns but do not always indicate continuation. That is why they are often called the "servants of two masters" where the price can exit in any direction.
The patterns happen when the price action becomes more and more compressed. The triangles are considered a continuation pattern when the ascending or descending pattern coincides with the previous trend direction. Triangle continuation patterns have three types: symmetrical, ascending, and descending.
- A symmetrical triangle pattern has descending swing highs and ascending swing lows. The two lines then close into each other at the end.

- An ascending triangle is formed from rising swing lows, creating an ascending line when connected. The upper boundary will be horizontal, and the bottom one will be formed by upward-directed support.

- While in descending triangle pattern, the swing highs are declining, forming a downward-sloping trendline when connected. So the bottom boundary will be horizontal, and the upper one will be a downward-directed resistance.

We can identify if the triangle is categorized as a trend continuation pattern by ensuring these two aspects:
- The ascending triangle is formed in a similar trend. In other words, if the upper boundary is broken, it is an excellent opportunity to open a long position. The profit will be around 80-100% of the triangle's width. Remember to place the stop loss beyond the opposite level of the pattern.
- In contrast, the descending triangle should appear in a similar trend, in which the support level breakout will indicate a great selling opportunity. Stop loss and take profit should also be placed beyond the opposite level of the pattern.
4. The Rectangle Patterns
Another trend continuation pattern comes in the shape of a rectangle. To put it simply, the rectangle pattern shows a pause in the price trend, with price action moving sideways.
So, the consolidation zones are formed within horizontal support and resistance levels. The rectangle can be spotted either in a bullish or a bearish trend. As for the stop loss, it's recommended to put it beyond the opposite extreme of the pattern.

How to Trade Continuation Patterns in 5 Easy Steps
- First, learn the pattern formation rules and look for variations and examples of each type.
- The next thing to do is to find out the initial trend direction, whether upward or downward before it forms a pattern.
- Then, identify the continuation pattern and look for the breakout point.
- In a continuation pattern, you would want to open a position if the breakout occurs in the same direction as the previous trend. So after finding the breakout point, it is time to enter your positions based on the previous sections' rules.
- Afterward, manage the risks by placing a stop loss outside the pattern on the opposite side of the breakout.
Here is an example of a Continuation Pattern:

Regarding continuation patterns, the most significant drawback is false breakouts. It can occur when the price suddenly moves outside the pattern but right back inside or out on the other side.
Such conditions can be fatal to your prediction and possibly make you lose money. That is why it is crucial to always pay attention to risk management by placing stop losses to your trade.
See Also:
Conclusion
Understanding continuation patterns is necessary to determine your trade's entry and exit points. It is quite a logical way of telling what's happening in the market and predicting the next price direction. It is worth mentioning that, just like in any other trading strategy, it's not always 100% accurate.
So, try spotting trend continuation patterns and practice trading with them in the demo account first. Don't violate the risk management system you build, and don't get tempted when the price shows significant changes, as it could be a false signal. It would also be helpful to combine other trading instruments to make a stronger and more effective strategy.


2 Comments
Boris
Apr 25 2024
Regarding Trend Continuation Patterns and How to Trade Them, can I utilize a Line Graph instead of Candlestick to aid in drawing the patterns? The article also demonstrated the pattern using drawn lines, which appears quite convenient, while other images depict the pattern using candlesticks, leaving me feeling confused as I struggle to recognize the pattern.
Additionally, can these patterns truly be effective at any time? Thanks!
Hengky
Apr 30 2024
Sure thing! You can definitely use a Line Graph instead of Candlestick to help draw the patterns. The article might have shown both methods to cater to different preferences and trading styles. If you find it easier to recognize patterns with drawn lines, go for it!
As for whether these patterns work at any time, well, it depends. Trend continuation patterns can be reliable in certain market conditions, but they're not foolproof. It's essential to consider other factors like market context, volume, and overall trend direction before placing trades based solely on patterns.
So, while these patterns can be helpful tools in your trading arsenal, it's essential to use them in conjunction with other analysis techniques for more accurate and informed decision-making.