 Dedicated FREE FOREX VPS
 Free FOREX Virtual Private Server
 MT4 Demo Contest, Get $500
 Sign Up for an Account, Claim 60% Deposit Bonus
 Free MT4/MT5 VPS 2024
 Send E-mail and Get Free Merchandise
 $1K Refer a Friend Bonus for Pepperstone Pro clients
 Maximize Your Earnings with 100% Deposit bonus
 Trade to Win, $5,000 Monthly Demo Contest
 Claim 30% + 15% Deposit Bonus from LiteFinance
Price action techniques rely on historical price movements for analysis. Mastering these 5 skills is essential for success as a trader.

Did you know? A price action trader's daily life can't be separated from observing candlestick patterns, determining support resistance zones, trend lines, and similar chart analysis. Price action traders can find the ideal buy or sell points for entry and exit from these activities.
Seems complicated, huh? In reality, price action is the simplest yet most powerful trading method. Many technical traders rely on this method because it's sufficient to make any trading decision. However, to make a steady profit from trading, you need to master at least five price action skills listed below:
- Find the Price Swing
- Draw the Trend Line
- Determine support and resistance
- Identify buying pressure and selling pressure
- Set realistic targets
Implementing these five skill points will help you get closer to mastering the price action strategy. You can read our guide below for more detailed explanations of these skills.
1. Find the Price Swing
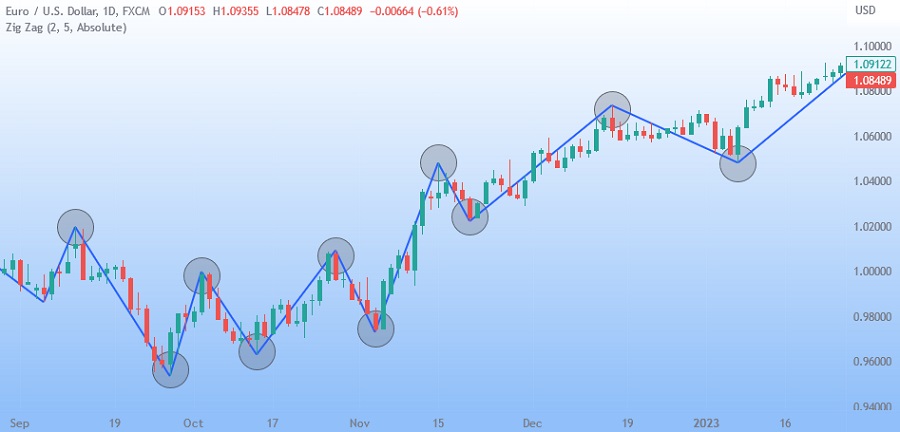
The very first skill that must be possessed by a price action trader is to find the swing. This is because prices always fluctuate or rise and fall. The price will form a swing as a reversal swing point that can show a picture of the market structure or even a support resistance zone.
There are several methods you can use to determine the pivot swing by utilizing:
- Moving Average
- Zigzag indicator
- Gann Swings
For a better insight, let's take a look at the chart below which shows the swing points, marked by the zigzag indicator on the GBP/USD Daily chart:
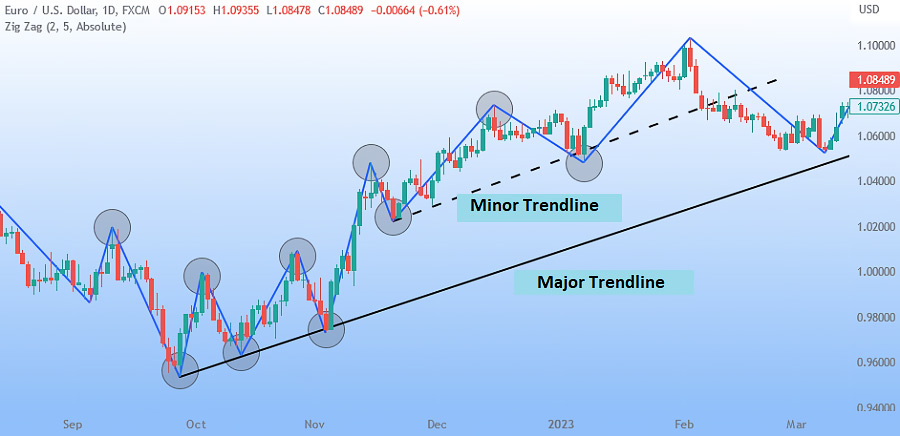
2. Draw The Trend Line
The second skill that price action traders must master is drawing trend lines. The trend line is a simple yet powerful tool that can be used to identify and trade trends.
To draw a trend Lines, follow these steps:
- Identify one or more swing points. A swing point is a point on a chart where the price has significantly changed direction.
- Draw a straight line from left to right, connecting the swing points.
- The trend lines will either slope upwards (indicating an uptrend) or downwards (indicating a downtrend).
Once you have drawn a trend line, you can use it to identify potential entry and exit points for trades. For example, if you are trading in an uptrend, you could look to enter a trade when the price breaks above the trend lines. You could exit the trade when the price breaks below the trend lines.
Trend lines are versatile trading tools that can be used to determine execution points, identify support and resistance levels, and assess the momentum of a trend.
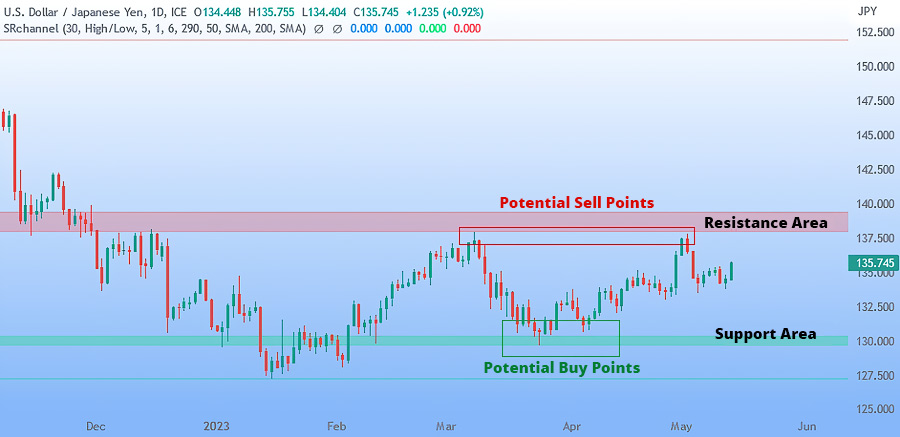
3. Determine Support and Resistance
Support and resistance are two important technical analysis concepts that can be used to identify potential entry and exit points for trades.
- Support is a price level below the current market price where buyers are likely to step in and prevent the price from falling further.
- Resistance is a price level above the current market price where sellers are likely to step in and prevent the price from rising further.
Support and resistance levels can be identified by looking for areas where the price has previously bounced off. These levels then can be used to identify potential entry and exit points for trades.
For example, if a trader believes that the price of a stock is likely to continue to rise, they may look to buy the stock when it reaches a support level. Conversely, if a trader believes that the price of a stock is likely to fall, they may look to sell the stock when it reaches a resistance level.
It is important to note that support and resistance levels are not fixed. They can change over time as market conditions change. As a result, traders should always use support and resistance levels in conjunction with other technical analysis indicators to make trading decisions.
There are a few ways to determine support and resistance levels, including:
- Historical price data: Historical prices are the most reliable source for identifying support and resistance levels. Look for price levels where the price has previously bounced multiple times.
- Previous support and resistance levels: You can also use previous notable support or resistance levels as markers for possible entry and exit points.
- Technical indicators: Technical indicators or trendlines can also provide dynamic support or resistance levels that move as the chart progresses.
4. Identify Buying and Selling Pressure
Identifying buying and selling pressure at critical moments can give you better entry points. This allows you to trade with less risk.
How to identify buying and selling pressure?
Most price action traders use price pattern reading techniques to identify buying and selling pressure. However, it's important to understand the meaning of the price pattern you are reading.
To do this, you can follow these steps:
- Learn each candlestick element (high, low, open, close, upper shadow, lower shadow) and how it relates to the previous candle.
- Identify where the pattern appears. It indicates strong pressure on the candlestick signal if it occurs near important areas such as support, resistance, or price swing.
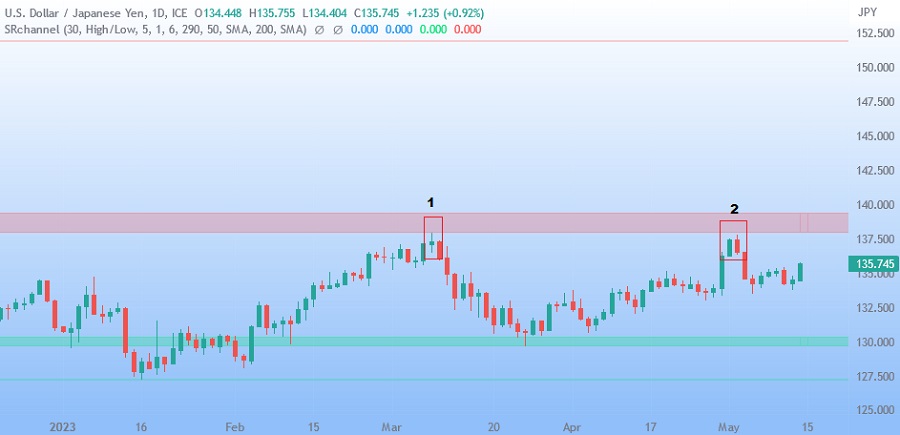
The below chart shows two sell potentials at the resistance area. However, the number 1 potential is considered more significant due to the formation of a doji candlestick with a long shadow and a small body. Both characteristics indicate strong buying and selling pressure.
5. Set Realistic Targets
A profitable trade requires the right profit target. Therefore, it is a crucial skill for price action traders to master.
Setting realistic profit targets based on price action is relatively easy. There are three main categories to consider:
- Support or resistance: Exit long positions at resistance levels or close short trades at support levels.
- Price formation: Use the size of the price spike as a basis for measuring the ideal target.
- Volatility measure: Place targets with the Average True Range (ATR) indicator or standard deviation.
Summary
To be a successful price action trader, it's crucial to have five essential skills: proficiency in finding the price swings, drawing the trend lines, determining support resistance, identifying buying and selling pressure, and set profit targets. These skills are essential for making consistent profits in trading.
The abovementioned skills are interconnected, forming a cohesive framework for effective trading. It's important to note that certain concepts overlap; therefore, it's suggested not to overwhelm yourself by trying to learn them all simultaneously.
Becoming a price action trader requires a lot of skill. However, there are many learning options that you can utilize to explore price action. Here are recommendations for the best price action books to use as additional references.