Dedicated FREE FOREX VPS
 Free FOREX Virtual Private Server
 MT4 Demo Contest, Get $500
 Sign Up for an Account, Claim 60% Deposit Bonus
 Free MT4/MT5 VPS 2024
 Send E-mail and Get Free Merchandise
 $1K Refer a Friend Bonus for Pepperstone Pro clients
 Maximize Your Earnings with 100% Deposit bonus
 Trade to Win, $5,000 Monthly Demo Contest
 Claim 30% + 15% Deposit Bonus from LiteFinance
We can create a simple H4 trading strategy with Doji candlestick. Here are some quick examples.
Which time frame do you use to trade? Most day traders make use of the H1 time frame and below, while swing traders prefer D1 or above. Between them, the H4 trading strategy is less popular. However, the H4 time frame actually has a lot of benefits.
Trading in the H4 time frame allows you to take advantage of short-term price actions while having a 9-to-5 job. It provides all the benefits of day trading without ignoring larger trends.
Are you interested? Let's see this simple setup of the H4 trading strategy with the Doji candlestick to learn more.
The Correct Setup for Trading in H4 Time Frame
There are plausible reasons behind the "unpopularity" of the H4 time frame. Each related candle in the 4-hour time frame corresponds to exactly 4 hours of trading activity. It is an intraday time frame, but this 4-hour time span is quite awkward to depict the recent price action.
The H4 time frame is ineffective in the stock market because there are only two H4 candles in a day of trading. While in the forex market, a whole day of trading is made up of six full H4 candles, one H4 candle may correspond to one-half of a trading session.
To create the best H4 trading strategy, we have to first solve this dilemma. So, how should we do it?
First, we have to decide which trading session we will focus on. There are four trading sessions, each with its own distinctive price action: The Sydney, Tokyo, London, and New York sessions.
One of the busiest sessions is in New York. So, here we will set our chart in accordance with the New York close.
You should see each candle in the H4 time frame shut at 5:00 PM, 9:00 PM, 1:00 AM, 5:00 AM, 9:00 AM, and 1:00 PM if you are using the proper New York close. Not all broker servers are set to this standard, so you have to inspect your own trading platform or check it with your broker.
H4 Trading Strategy with Doji Candlestick
The Doji candlestick is easily recognized for its extremely slim body. On its own, the Doji candlestick generally means uncertainty. Nevertheless, we can observe its accompanying candles.
There are at least three H4 trading strategies with the Doji candlestick. They are based on the Morning Doji Star, Evening Doji Star, and Doji Sandwich patterns. Each pattern consists of three candles, with the second (middle) candle being a Doji.
Morning Doji Star
The Morning Doji Star is a bullish reversal pattern. It consists of one bearish candle (1st), followed by a Doji candle (2nd), and one bullish candle (3rd). The body of the Doji should be below both the first and second candles.
The Morning Doji Star appears during a market downtrend and signals a trend reversal from bearish to bullish. We can place a buy stop above the 3rd candle after the pattern emerges, as the price breakout confirms the buy signal.
Evening Doji Star
The diametrical opposite of the Morning Doji Star, the Evening Doji Star is a bearish reversal pattern. It consists of one bullish candle (1st), followed by a doji candle (2nd), and one bearish candle (3rd). The body of the Doji should be above both the first and second candles.
The Evening Doji Star appears during a market uptrend and signals a trend reversal from bullish to bearish. We can place a sell stop below the 3rd candle after the pattern emerges, as the price breakdown confirms the sell signal.
Doji Sandwich
The Doji Sandwich is a trend continuation pattern. It can appear during both a downtrend and an uptrend as it confirms that the previous trend will prevail.
During a market downtrend, Doji Sandwich will show up as three candles in which the first bearish candle (1st) is followed by a Doji candle (2nd) and a second bearish candle (3rd). To take advantage of this pattern, we can wait until the 3rd candle's low is broken to open a short position.
During a market uptrend, Doji Sandwich will show up as three candles in which the first bullish candle (1st) is followed by a Doji candle (2nd) and a second bullish candle (3rd). Wait until the 3rd candle's high is broken before opening a long position.
Is H4 Trading Strategy with Doji Candlestick Reliable?
There's no 100% perfect setup, including this H4 trading strategy. It has long been tried in the market, so its accuracy is fairly high. However, we also have to maintain strict money management and other risk-control measures.
The best practice is to apply additional technical indicators to confirm the buy or sell signal, such as Stochastics. It has simple rules, and we can confirm any signal within seconds.
Stochastic will fluctuate between 0-100. A Stoch value less than 20.00 indicates oversold, while a value greater than 80.00 indicates overbought. Oversold prices tend to move higher, while overbought prices tend to drop lower.
Morning Doji Star, Evening Doji Star, and Doji Sandwich can all be applied along with Stochastic. Here are two examples of the H4 trading strategy as seen on AUD/USD.
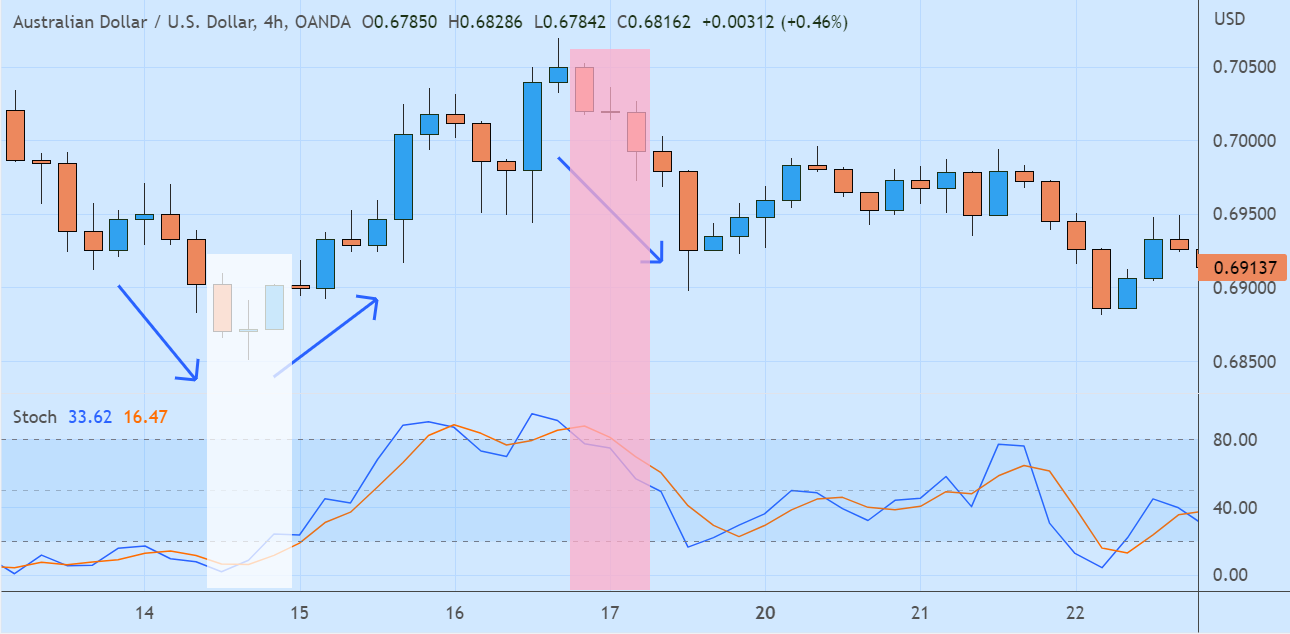
The first area (white) marked a buy opportunity because the Morning Doji Star pattern appeared while Stochastic signaled an oversold situation. The second area (pink) marked a sell opportunity because Doji Sandwich showed up while Stochastic signaled an overbought situation.
Quite simple, isn't it? You can try it out on your own trading platform. Seek previous charts to understand how the setup usually appears and implement it in your favorite pairs.