 Easy 3000% Deposit Bonus, Get your $750
 Dedicated FREE FOREX VPS
 Free FOREX Virtual Private Server
 MT4 Demo Contest, Get $500
 Sign Up for an Account, Claim 60% Deposit Bonus
 Free MT4/MT5 VPS 2024
 Send E-mail and Get Free Merchandise
 $1K Refer a Friend Bonus for Pepperstone Pro clients
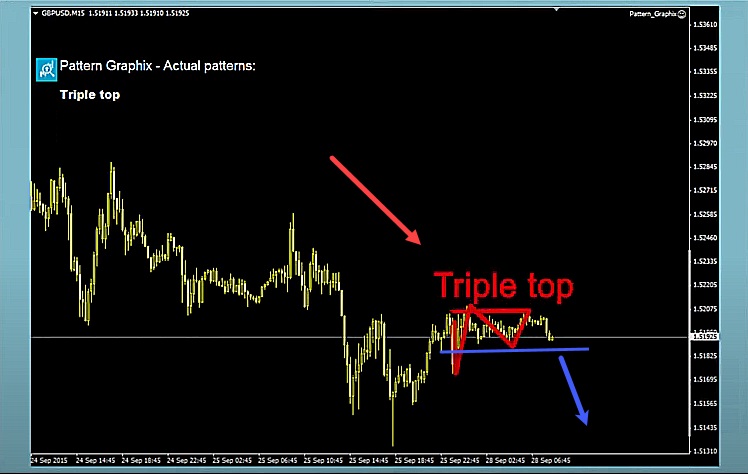
SuperForex Pattern Graphix is really fast and accurate at finding trading opportunities based on chart patterns. If you want to know more, keep reading to get the full scoop.
SuperForex Pattern Graphix is a tool from SuperForex that they give to their customers for free. It's an Expert Advisor or EA that works with a trading platform called MetaTrader 4 (MT4). Once downloaded, the software syncs with the SuperForex MT4 account.
This Expert Advisor's job is to find patterns on price charts. Here's how it works:
- It shows you patterns on your trading chart right when they show up.
- You can choose which patterns to look for.
- You can set how it talks to you. It can use pop-up messages or send messages to your phone or email.
A Brief Intro to SuperForex Pattern Graphix
Pattern Graphix is designed to quickly spot and identify patterns in the market within 1-2 seconds. This speed allows traders to make timely decisions and take advantage of potential trading opportunities.
Pattern Graphix is also designed to be user-friendly, making it accessible even for beginners. It highlights and names various patterns, which helps traders understand and interpret them easily.
SuperForex Pattern Graphix is known for its precise identification of technical analysis patterns. This accuracy assists traders in making more informed trading decisions based on reliable pattern recognition.
Where should you use it? As a matter of fact, the tool works well on short time frames, such as M1 (1-minute) and M5 (5-minute). This versatility makes it particularly useful for scalpers who aim to capitalize on quick price movements.
All the tools and patterns needed for technical analysis are conveniently located in one menu. This centralized access saves time and effort for traders, allowing them to efficiently analyze patterns and make trading decisions.
More than just a technical tool, the SuperForex Pattern Graphix tool enables traders to test out new trading strategies using historical data. By backtesting strategies, traders can assess the effectiveness of their approach before implementing it in live trading.
The tool also provides notifications in the form of pop-ups on charts or messages to your phone or email. These alerts keep you informed about potential pattern formations and help you stay updated on market movements.
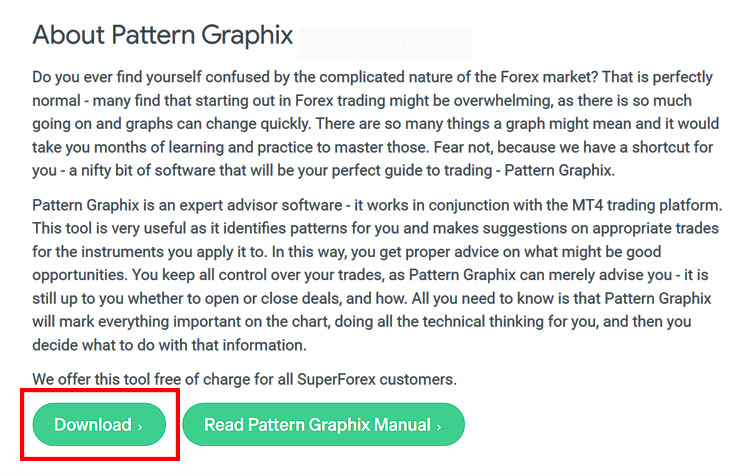
How to Download SuperForex Pattern Graphix?
To download SuperForex Pattern Graphix, you can follow these steps:
- Go to the official SuperForex website.
- Select the "Education" menu at the top, then click on "Pattern Graphix" in the bottom right corner.
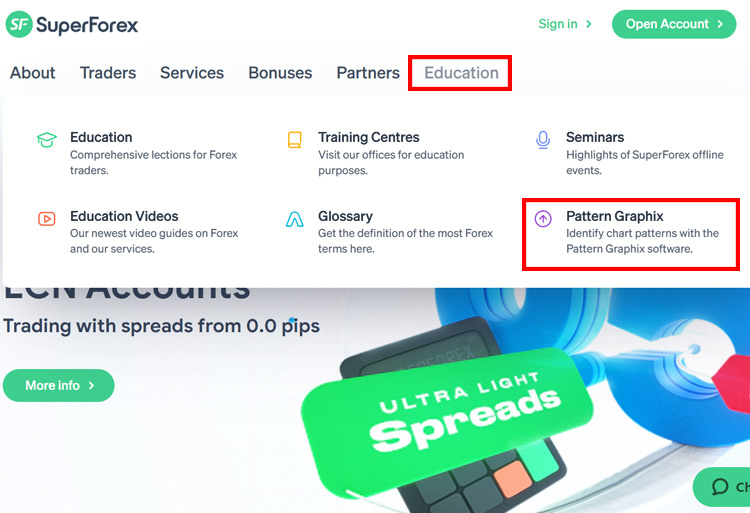
- This will take you to a page to download the Pattern Graphix. Scroll down a bit and click the download button. You can also read the guide by clicking on the "Read Pattern Graphix Guide" button.
How to Install SuperForex Pattern Graphix on MT4 Charts
To set up SuperForex Pattern Graphix on your MT4 chart, follow these steps:
- Run the Pattern Graphix.exe file and click "Yes." Choose your preferred installation language and click "OK."
- Click "Next."
- Choose the installation folder for MetaTrader 4 and click "Next." If you're not sure where the platform is located, open MetaTrader 4, go to the File menu, and select "Open Data Folder." Copy the folder location and paste it into the Pattern Graphix installer.
- Pick a folder in the Start menu (the default setting is recommended) and click "Next."
- Click "Install."
- Click "Finish."
- The installation of Pattern Graphix is now complete.
See Also:
MetaTrader 4 Settings
Once Pattern Graphix is installed, open MetaTrader 4 (or restart it if it was open during installation) and adjust the settings by ollowing this order: Go to Tools → Options → Expert Advisors. Also, don't forget to enable 'Allow DLL imports.'
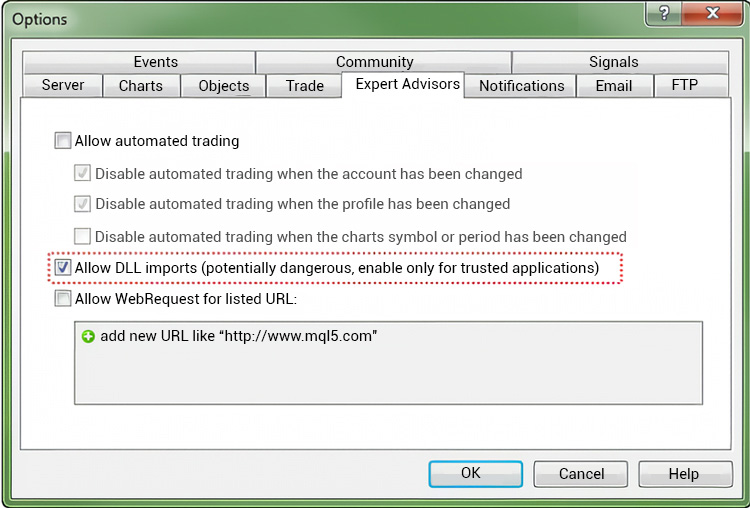
Pattern Graphix doesn't conduct trades automatically, and it doesn't need WebRequest.
Running Pattern Graphix
- Open the chart for the trading instrument you're interested in.
- Go to the Navigator → Expert Advisors, locate the Pattern Graphix advisor and drag it onto the chart window. In the window that appears, click "OK."
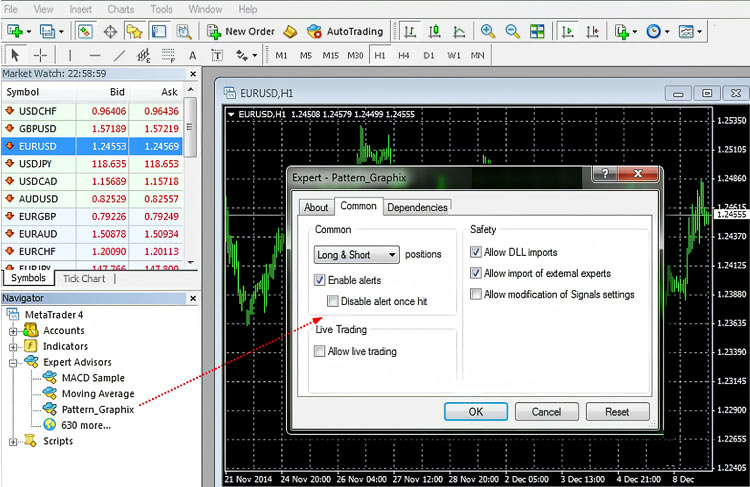
- Pattern Graphix will be activated, and the settings window will pop up. Click "OK" to proceed.
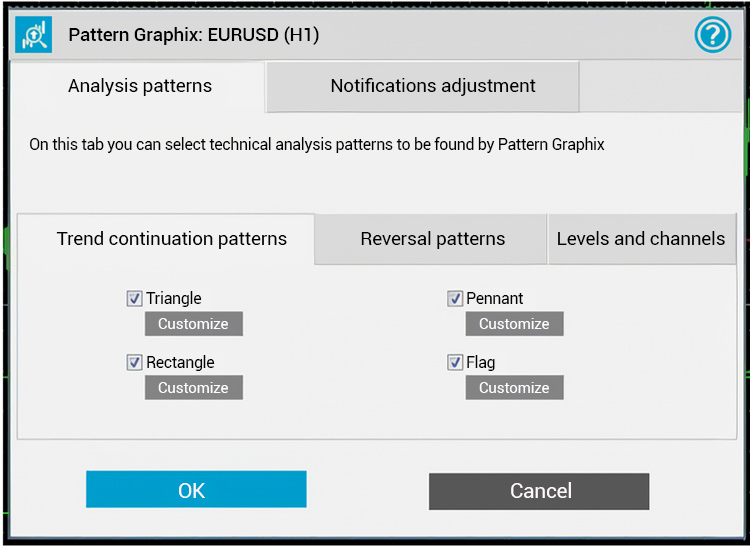
Notifications Adjustment
The Notifications Adjustment of SuperForex Pattern Graphix consists of the following components:
- Show pop-up alerts – controls whether pop-up messages (alerts) will appear in MetaTrader 4.
- Send PUSH notifications – controls the sending of PUSH notifications. To enable this feature, you must:
- Register at www.mql5.com.
- Specify your MetaQuotes ID in MetaTrader 4 (Tools → Options → Notifications).
- Specify your MetaQuotes ID in the mobile version of MetaTrader 4 (Options → MetaQuotes ID).
- Send notifications via email – determines whether email notifications will be sent. To ensure proper email notifications, you should configure your email settings in MetaTrader 4 (Tools → Options → Email).
Who Is SuperForex Pattern Graphix for?
This tool is great for two types of traders: those who trade chart patterns and trend followers.
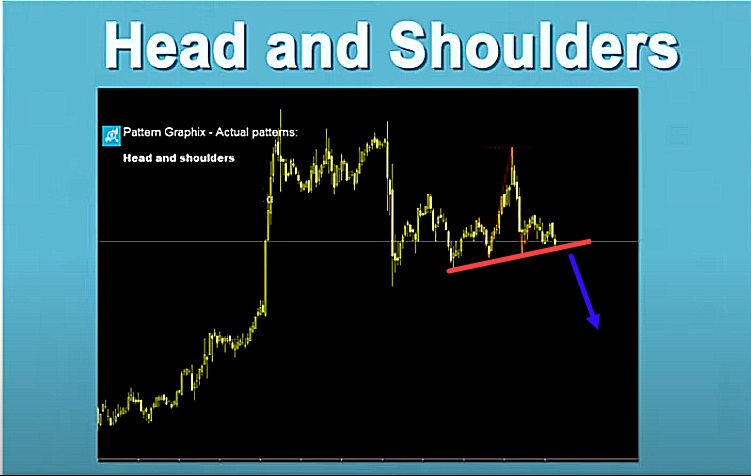
Chart pattern traders pay attention to specific shapes that appear on the chart. They don't worry too much about the overall price trend. Instead, they watch for these patterns and use them as signals for their trades.
For example, if a Head and Shoulders pattern shows up, these traders would sell even though it goes against the trend. They rely on recognizing patterns and making decisions based on them.
On the other hand, trend followers use SuperForex Pattern Graphix to decide when to enter trades. They first check the trend's direction and strength then use Pattern Graphix to confirm their entry points.
The levels and reference points they get from their trend analysis help them decide when to enter a trade if Pattern Graphix gives a signal that matches the trend. In short, they use Pattern Graphix to double-check their trades within their big-picture trend analysis.
Both of these approaches have their benefits and work well in different situations. Pattern Graphix is flexible, making it helpful for traders who like patterns and those who follow trends.
To Get the Most Out of Pattern Graphix, Consider These
- Use Multi-Time Frame Analysis
Different time frames can provide valuable insights. While a pattern might appear on a shorter time frame like M1 or M5, you can gain more confidence in the pattern's reliability by checking it against longer time frames like H1 or D1. If you see alignment across multiple time frames, it strengthens your trading signal. - Combine with Other Indicators
Relying on a single indicator can lead to a lot of false signals. Combining Pattern Graphix with other indicators can help reduce the risk of making poor trading decisions. If Pattern Graphix identifies a pattern that suggests a buy or sell signal, confirm it by checking whether other technical indicators also support that direction. If multiple indicators align, it strengthens your confidence in the trade. - Focus on Important Levels (Support/Resistance or Supply/Demand)
It is important to trade only when the price is at key levels on the chart, such as support, resistance, or supply and demand zones. These levels are areas where price often reacts significantly. When Pattern Graphix identifies a pattern, check if it coincides with a support or resistance level on the chart. Trading at these levels often provides clear risk points (stop losses) and profit targets (take profits), enhancing your trading plan's effectiveness.
Conclusion
In conclusion, SuperForex Pattern Graphix is a powerful tool that can enhance your trading experience by providing timely and accurate pattern recognition.
To get the benefit from Pattern Graphix, it is important to understand how it works and how to interpret the identified patterns. Combine it with other technical indicators and conduct a thorough analysis to increase the reliability of your trading decisions.
By following these guidelines and continuously learning and improving, you can harness the power of SuperForex Pattern Graphix to make informed trading decisions and potentially enhance your trading performance. It's a good idea to use this tool in a demo account before using it in a real trading account so you can get used to how it works.
SuperForex is a broker that operates on a global scale and is regulated by the International Financial Services Commission (IFSC). Since 2013, they have been providing high-quality services encompassing trading and investment through mobile platforms, a wide range of deposit methods, educational features, Forex Copy, bonuses and contests, economic news and analysis, as well as a variety of account options.


10 Comments
William G
Oct 27 2023
It's pretty intriguing that there are indicators out there that can draw patterns directly on the trading chart. However, I'm a bit hesitant to try this approach since I'm more used to using traditional indicators in my trading.
Additionally, this pattern graphix seems quite straightforward, as it quickly identifies patterns without any extra steps. Typically, I stick with the moving average indicator for my trading.
So, I'm curious to know if you think it's a good idea to use the moving average on this pattern graphix. If not, do you have any other indicators in mind that might work well with this unique charting method? Your insights would be much appreciated.
David Tristan
Oct 27 2023
It's natural to be cautious about adopting new trading methods, especially if you're more accustomed to using traditional indicators like moving averages. I think it's a good idea to combine the Pattern Graphix tool with the moving average.
Here are some insights and suggestions on combining it with moving averages or other indicators:
When the moving average shows a downtrend and the pattern graphix also shows price will go down, you can sell/short the market. Conversely, when the moving average and the pattern graphix show the price will go up, you prepare to buy the market.
Alongside moving averages, you might consider using other technical indicators like the Relative Strength Index (RSI), Moving Average Convergence Divergence (MACD), or Stochastic Oscillator. These indicators can provide added insights into trend strength, potential overbought or oversold conditions, and divergence that may further support your trading decisions when using Pattern Graphix.
Another thing to remember is back-testing and Paper Trading. Before fully implementing this approach in your live trading, consider back-testing it using historical data to assess its performance under various market conditions. You can also practice with a demo account or use paper trading to get a feel for how this combination of tools works in real time without risking your capital.
Remember that the effectiveness of any trading strategy can vary with market conditions. It's important to stay adaptable and continuously learn, tweak, and refine your approach based on changing market dynamics.
Dan
Oct 27 2023
I've gone ahead and downloaded this indicator, and I've given it a shot on my trading chart. I must say that I'm quite satisfied with the outcomes it has produced, and I've been diligent in aligning my trading decisions with the signals it generates.
However, there's a bit of a challenge I've encountered, particularly because I've chosen to use it on the M5 time frame. What happens, in this case, is that I end up receiving a rather high number of entry signals within a relatively short time span.
As a consequence, I've observed a tendency to overtrade, wherein I engage in more trades than may be prudent. So, the question that's arisen is how to effectively address and curb this overtrading behavior, especially in a scenario where there's an abundance of entry signals. I'm open to any advice or strategies you might have for overcoming this challenge.
David Tristan
Oct 27 2023
Managing to overtrade when using a lower time frame like M5 can be a common challenge. Overcoming overtrading takes time and discipline.
Here are some strategies to address and curb overtrading when you're dealing with a high number of entry signals on the M5 time frame:
Define Clear Trading Rules
- Establish a set of well-defined rules that dictate when and how you'll enter and exit trades. These rules should be comprehensive and include factors beyond just the indicator signals, such as your risk management strategy and the size of your trades.
- Determine under what conditions you will initiate a trade. For example, specify that you'll only enter a trade when the indicator signals align with the overall trend direction, and the risk-reward ratio meets your predefined criteria.
- Clearly outline your exit strategy, including setting stop-loss and take-profit levels. This ensures that you have a plan in place for managing each trade.
Set a Daily or Weekly Trade Limit
- Decide on the maximum number of trades you will allow yourself to take within a specific time frame, such as a day or a week. This limit serves as a safeguard against overtrading, as it prevents you from impulsively taking excessive trades.
- Once you've reached your predefined trade limit, step away from the trading platform. This can help prevent emotional decision-making that often leads to overtrading.
Screen the Strongest Signals
Focus on identifying the highest-probability setups that are in line with your overall trading strategy and the prevailing trend. Prioritize signals that have multiple confirming factors, such as alignment with higher time frame analysis or the presence of additional filter indicators.
Use Pending Orders
Instead of executing trades instantly, consider using pending orders (limit orders or stop orders) with predefined entry and exit levels. This forces you to think through your trades more thoroughly and helps avoid impulsive decisions.
Implement Higher Time Frame Analysis
While you may trade on the M5 chart, it's essential to incorporate higher time frame analysis, like the H1 or H4, to get a broader perspective of the market's trend and key support and resistance levels. The insights from higher time frame analysis can serve as a filter for your M5 trades. Focus on taking M5 trades that align with the direction and levels identified on the higher time frames. This helps you filter out lower-probability trades.
Use a Trading Journal
Maintain a trading journal to record every trade you take, including the reasons for the entry and exit, as well as the outcome. This practice forces you to reflect on your trading decisions and can help you identify patterns of overtrading.
Frank
Oct 27 2023
I'm genuinely interested in this indicator primarily because of its striking simplicity. The fact that it's also freely available is an added bonus.
However, a lingering question in my mind pertains to its win rate. Is this indicator's win rate higher than 50%, or might it be even more impressive than that? To be honest, I don't have a clear answer to that.
So, I'm reaching out to you to get your perspective. From your experience and understanding, what's the ballpark estimate of the win rate for Pattern Graphix? Additionally, I'm quite eager to learn if you have any practical tips or strategies that can help boost the win rate while using this indicator. Your insights would be greatly appreciated.
David Tristan
Oct 27 2023
Like many technical analysis tools, Pattern Graphix doesn't have a fixed win rate. It's because the performance can vary based on market conditions, time frames, and the specific trading strategy you use with it. The win rate of any trading tool, including Pattern Graphix, is also influenced by factors such as risk management, trade size, and your trading skills and discipline.
Here are some practical tips that can help you potentially boost your win rate when using Pattern Graphix:
Keanu
Oct 27 2023
My plan is to incorporate this indicator into my trading strategy, but I want to take the prudent step of conducting a thorough backtest before I fully commit. Given that I identify as a day trader, my intention is to run this test on the H1 timeframe, focusing on popular currency pairs like EUR/USD and assets like gold.
I've come across advice on the internet stressing the importance of a robust backtest. Given that I'm a beginner, could you offer some guidance on how to conduct an effective backtest for the Pattern Graphix indicator? This would give me a clearer picture of how to go about it.
David Tristan
Oct 27 2023
Here's a step-by-step guide to help you conduct an effective backtest:
Another important thing. After completing the manual backtest, do demo trading with Pattern Graphix to validate your strategy in real time without risking actual capital. This will help you familiar with pattern Graphix without risking your money.
Steve F
Oct 27 2023
I got quite curious, and that led me to download and try using this indicator on my existing trading account. Regrettably, the results haven't been in my favor, and I've experienced several losses.
I've been using it on the M5 time frame since I'm into scalping, but these losses are making me concerned about the dwindling of my capital.
So, I'm left pondering how to reduce these losses. I've reached out for advice in forex communities, and some have suggested switching to a higher time frame. I'm interested to hear your take on this. What would be your recommendation in a situation like this?
David Tristan
Oct 27 2023
Here are some recommendations and considerations for addressing losses while using the Pattern Graphix indicator on the M5 time frame:
Remember that losses are a common part of trading, and even experienced traders face periods of drawdown. Avoid making impulsive decisions based on recent losses. The key is to learn from your losses and continuously improve your trading strategy.