 Dedicated FREE FOREX VPS
 Free FOREX Virtual Private Server
 MT4 Demo Contest, Get $500
 Sign Up for an Account, Claim 60% Deposit Bonus
 Free MT4/MT5 VPS 2024
 Send E-mail and Get Free Merchandise
 $1K Refer a Friend Bonus for Pepperstone Pro clients
 Maximize Your Earnings with 100% Deposit bonus
 Trade to Win, $5,000 Monthly Demo Contest
 Claim 30% + 15% Deposit Bonus from LiteFinance
Bounces and breakouts are essentially the backbones of looking for opportunities in forex trading. They are strongly related to how much you understand support and resistance.
At a glance, technical analysis in forex trading looks very complicated. But in reality, anyone can master it once they understand the key concepts. One of those keys is being able to identify bounces and breakouts. The two concepts are commonly found in forex trading to signal the next potential movements when the price is going near certain levels. Regardless of what technical indicator or trading method you use, bounces and breakouts are always going to be relevant because they simply lead to the emergence of trading opportunities.
Contents
Bounces, Breakouts, and Support Resistance
Before we dig deeper into bounces and breakouts, we need to first understand that the price won't move in one direction (upward or downward) forever. Every once in a while, the price will face a "wall" that can block the trend and prevent it from going further. Some traders would wait for the price to go near these "walls" before executing their market orders.
In forex trading, these "walls" are commonly known as support or resistance. Support refers to the lowest level on the price swings that has a tendency to attract buyers, whereas Resistance is highlighted from the highest price swings that tend to attract sellers. As a forex trader, it's highly crucial to be familiar with those two concepts before learning about bounces and breakouts.
What is Bounce in Forex Trading?
A bounce occurs when the price does not push through the support or resistance level. Instead, it bounces off and moves in the opposite direction. As opposed to breakout, this condition indicates that the current trend is weak.
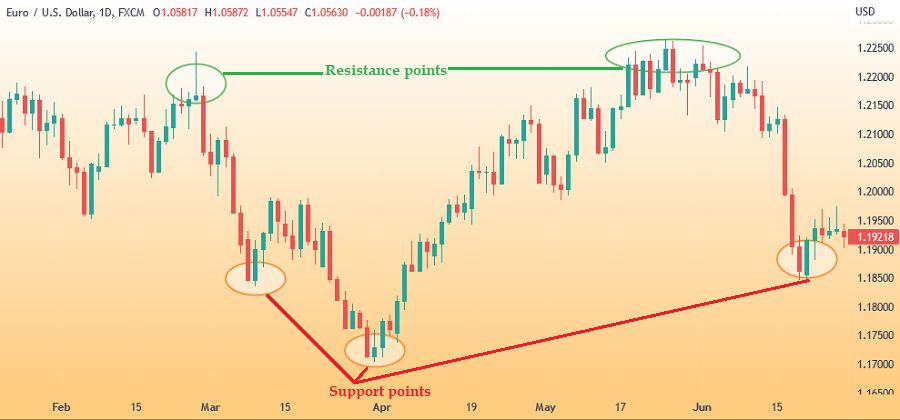
From the chart above, we can see that there was a "locked" price movement that couldn't pass the resistance and support levels. If we look closer, the upper wicks of the candlestick show that there was resistance from the sellers when the price was moving near the resistance level. Meanwhile, the buyers were still dominating the market when the lower wicks of the candle move near the support level.
Bounce often happens when the price is in the ranging market, but it won't last forever. If the price manages to break through the support level, then the trend will more likely shift into a downtrend. In contrast, if the break happens and the price moves past the resistance level, the trend will more likely change into an uptrend.
What is Breakout in Forex Trading?
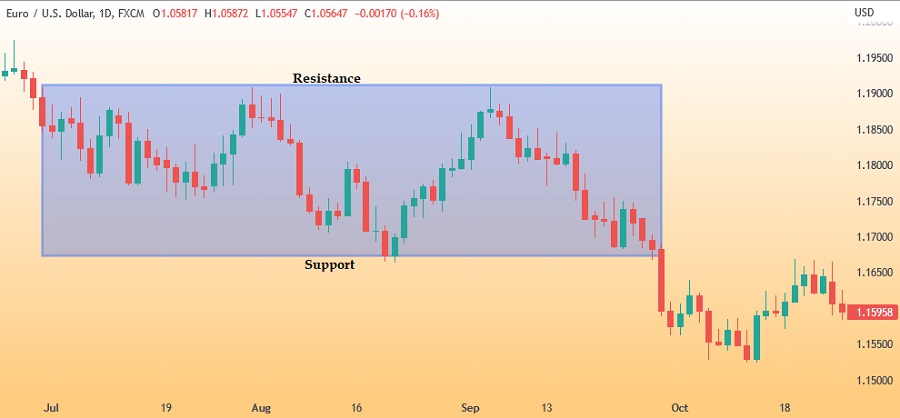
Breakout is the term used to describe a condition where the price moves beyond the resistance or support levels that have been created before. Oftentimes, the occurrence of a breakout indicates that there's a really powerful trend that could either maintain its current pace or create a completely new trend.
The chart above shows us how a breakout happened during a downtrend. If we take a closer look, the price had briefly corrected itself for a moment before turning down again as the market was still strongly controlled by sellers.
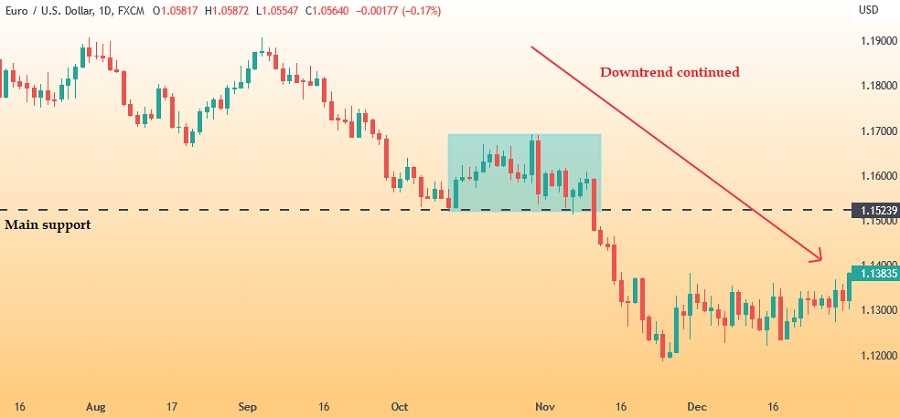
It's worth noting that the main characteristic of a breakout is the closing price that pushes through the support or resistance levels. More specifically, the price must close above the resistance or below the support. If the price couldn't manage to reach those points, then it's not a real breakout.
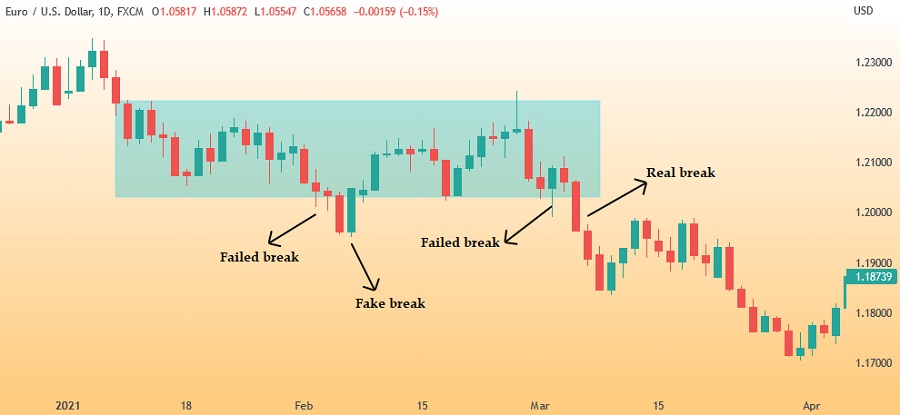
The EUR/USD chart above is an example of three types of breakout that might happen in the forex market. First, the price action indicates that there was a failed attempt to break the wall. Next, the price managed to push through the key levels, but it turned around not long after. This is called a fake break. Lastly, a real breakout happened and the trend continued.
How to Identify Bounces and Breakouts
Forex traders have a higher chance of generating huge profits if they are able to predict when bounces and breakouts will occur. However, you should know that such skill cannot be obtained by merely speculating. You need to learn about the following steps in order to map out the price movements on the chart:
- Spot the support and resistance areas.
- Determine the points where the price should bounce or break, relative to the support and resistance areas.
Based on the previous examples, the support and resistance areas are indicated by a horizontal line parallel to the lowest value and the highest value on the chart. But in practice, support and resistance levels can be identified through several other methods, such as:
Using Technical Indicators
Technical indicators can be a rather reliable choice for beginners because they are relatively easy to use, objective, and can be used with the default setting. One of the most popular technical indicators to use is Bollinger Bands (BB) which can be found on almost any trading platform.
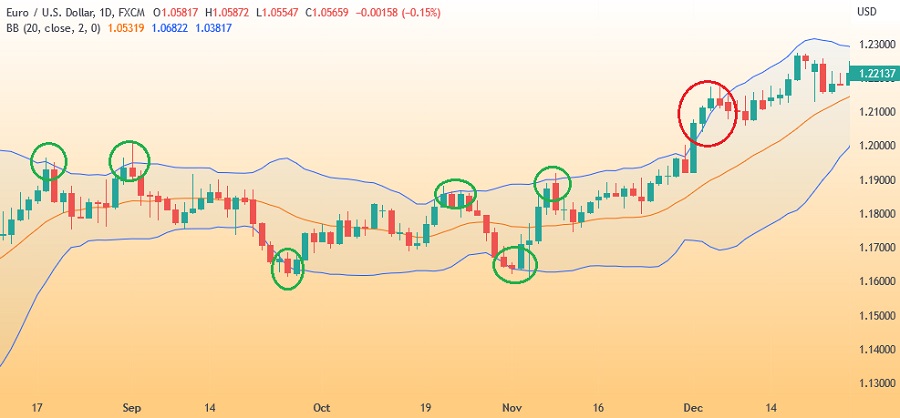
The chart above shows the process of identifying support and resistance levels by using Bollinger Bands. Compared to the horizontal lines, BB looks more curvy and uneven. This is why they are often called dynamic support and resistance. The green circles highlight the bounces that occurred during a ranging trend and the red circle highlights the breakout that happened during the end of the ranging trend and marked the beginning of a new trend.
See Also:
Using Price Patterns
The next method involves identifying support and resistance levels based on the information obtained from the price actions. This can give you more options but it is not as objective as the previous method. The results can vary for each trader, even though they are all using the same currency pair and time frame.
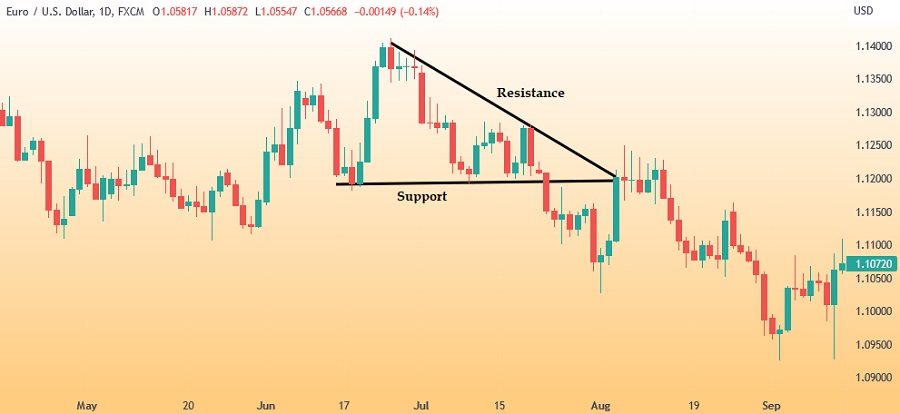
The graph above shows an example of a descending triangle on a EUR/USD daily chart. As you can see, the bounce happened consistently from support, but the resistance level showed that the high swings kept declining. This formation shows that the buyers were weak, so once a breakout occurred, the sellers immediately took action and leading the price to fall significantly.
Apart from the descending triangle, there are loads of other price patterns that you can use as a trading reference. But in order to master them all, you would have to learn about candlestick patterns first.
How to Trade Bounces and Breakouts
Understanding the basics of bounce and breakout is actually not enough to make profits in forex trading because we also need to be able to determine our entry and exit positions. Every trader typically has their own preference when it comes to this, but if you're still new to this field, then you can refer to the following guide:
Looking for an Entry
You need to arrange a set of rules before opening a trade. In other words, you need to wait until all of the conditions are fulfilled before entering the market. The rules can be different for each trader depending on their preference, experience, and trading system.
Generally, you'll need to pay attention to the closing of the last candlestick. If the candle closes above the resistance level or below the support level, a breakout might occur. Here's an easy example.
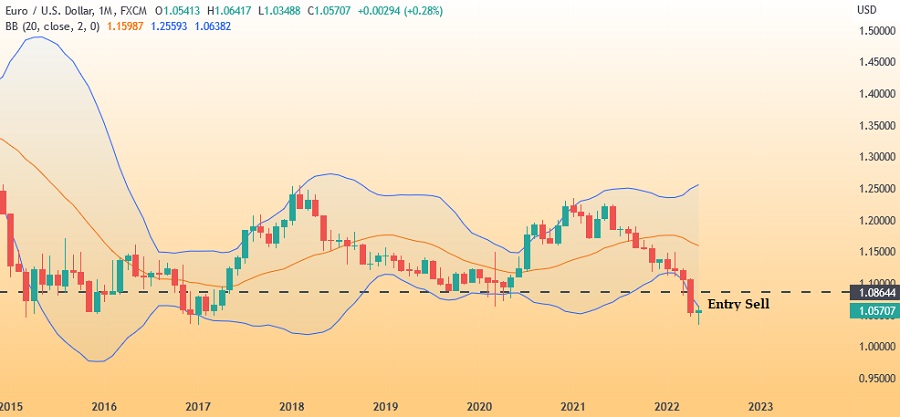
As you can see, there is a breakout because the candle closed below the support line as well as the lower Bollinger Bands. This means the trend was expected to go down from there. You can then choose to immediately open a sell position in hope that the price will move lower. Either way, you can open a pending order (limit entry order or stop entry order) if you want to enter the market at a different price.
Setting an Exit
In forex trading, it's not exactly wise to open a trade and keep it floating without a clear deadline. Please know that price movements in the forex market are quite volatile, so the longer you let the position open, the more risk you are letting yourself exposed to.
Most traders like to use risk/reward ratio to determine their profit targets and maximum loss. For instance, if a trader uses a 1:2 risk/reward ratio, a stop loss at 90 pips below the entry point would be followed by a 180 pips profit target.
For more strategies on exit positions, you could also consider money management methods explored in this article.


10 Comments
Lucia Barbagelata
May 28 2022
Can I use bounce and breakout in other financial markets?
Divany
Jul 18 2022
Lucia Barbagelata: Definitely! Bounce and breakouts can be used in many financial markets, such as forex, stock, commodity, and more.
Carmelita
Jun 5 2022
How to know when the trade has failed?
Divany
Jul 28 2022
Carmelita: The trade is considered failed when the price moves and touches your predetermined risk limit. In this case, you'd want to immediately exit the trade to save your money instead of letting the position open and risk losing it all.
Angelito
Jun 21 2022
When is the best time to spot bounce and breakout?
Divany
Jul 28 2022
Angelito: The best time is when you already determine the support and resistance levels on the chart, so you can filter out or ignore the other areas and focus on the spot where bounces or breakouts could occur.
Rico
Jul 1 2022
What is the best risk-to-reward ratio to use in this strategy?
Divany
Aug 15 2022
Rico: In this strategy, your risk to reward ratio should not be lower than 1:2. However, the exact number should depend on your risk tolerance and capability.
Mido
Jul 5 2022
What are other indicators that can be used to determine support and resistance levels?
Divany
Aug 15 2022
Mido: In order to determine support and resistance levels, you can use Fibonacci levels, pivot points, the Camarilla, etc.