 Dedicated FREE FOREX VPS
 Free FOREX Virtual Private Server
 MT4 Demo Contest, Get $500
 Sign Up for an Account, Claim 60% Deposit Bonus
 Free MT4/MT5 VPS 2024
 Send E-mail and Get Free Merchandise
 $1K Refer a Friend Bonus for Pepperstone Pro clients
 Maximize Your Earnings with 100% Deposit bonus
 Trade to Win, $5,000 Monthly Demo Contest
 Claim 30% + 15% Deposit Bonus from LiteFinance
Chart patterns are generally signify either trend reversal or trend continuation. In this article, we are going to introduce you to several famous patterns that often emerge on the charts.
Price movements on the chart often form patterns that could be used as a tool in technical forex analysis. Chart patterns are considered one of the most reliable tools to detect changes in price direction. Still, it is not an application that has to be installed on the chart individually. Instead, chart patterns are what we see on the chart everyday line graph or candlestick forms a certain pattern.
There are many different types of chart patterns, but some of the most common include:
- Triangle Pattern
- Wedge Pattern
- Head and Shoulders Pattern
- Double Tops and Double Bottoms
- Triple Tops and Triple Bottoms
Chart patterns generally signify either trend reversal or trend continuation. A reversal means that the price will bounce or move in the opposite direction of the last price movement depicted by the pattern. On the other hand, a trend continuation means that the last direction of price movement depicted by the pattern will be continued. For more, see the following explanation.
Triangle Patterns
Triangle patterns are when price forms a triangle shape on the chart. There are three kinds of triangle patterns: symmetrical, ascending, and descending.
- The symmetrical Triangle started with price moves from a low-level support to a high-level resistance, then fell to a higher support level than the previous support and made a lower resistance level than the previous resistance. If the subsequent resistance and support are lower than the second resistance and support, then the Symmetrical Triangle is complete.
- Descending Triangle gives off a bearish signal, which means that price will possibly move lower following the end of the pattern.
- Ascending Triangle is a bullish pattern that signals that price will move upward following the end of the pattern. Ascending Triangle is characterized by two resistance at the same level (flat resistance) and ascending support level.

Triangle pattern is generally considered the kind of pattern that signals trend continuation, which means that after the breakout, price will continue the previous trend. However, there is still exist possibility of pullback to the previous support/resistance levels.
See Also:
Wedge Pattern
Wedge Pattern generally signals a reversal from the ongoing trend. The chart has two kinds of wedges: Falling Wedge and Rising Wedge. Both consist of two slopes of resistance and supports, in which one slope is more slanted than the other, and the other is flatter, although not completely flat. The strength of the signal is influenced by how many times prices test the resistance and support trendline.
Our friend met Falling Wedge pattern a few weeks ago, as seen in the graph above. Falling Wedge is a wedge that points upward and usually signals that price will increase, although the previous price movement shows a downtrend. While Rising Wedge points downward and usually signals that price will go down by the completion of the pattern.
Head and Shoulders Pattern
Head and shoulders could be said as one of the most recurring chart patterns. We can easily spot this pattern by noting how a higher resistance stands between two lower resistances on equal level of support. The support is the neckline, which marks a price breakout to the lower area if broken.
Head and Shoulders is known as a reversal pattern. If it is formed with the peaks at the top, as in the picture above, it signals that the price will go lower. On the other hand, if the peak is created in the opposite direction, that is from three supports, then it will create an Inverted Head and Shoulders that signals the end of the previous downtrend, and the price will go up.
Double Tops and Double Bottoms
Double Tops is another well-known reversal pattern. It usually occurs during an uptrend but signals that the trend is losing steam and price will move lower after the pattern is completely formed. The Double Tops pattern consists of two resistance on equal level and one support level between them. The pattern ends when the price moves from the second resistance and breaks through the last support level.
Conversely, Double Bottoms pattern usually occurs during a downtrend, and signals that price will move upward following the end of the pattern. The Double Bottoms pattern consists of two support levels on equal level and one resistance in between, effectively a reverse of Double Tops. The pattern ends when the price moves from the second support and breaks through the last resistance level.
Triple Tops And Triple Bottoms
Triple Tops and Triple Bottoms are similar to Double Tops and Double Bottoms in the name and its significance. Triple Tops pattern is a bearish reversal pattern, as is the Double Tops pattern; and Triple Bottoms pattern is a bullish reversal pattern, just like Double Bottoms pattern.
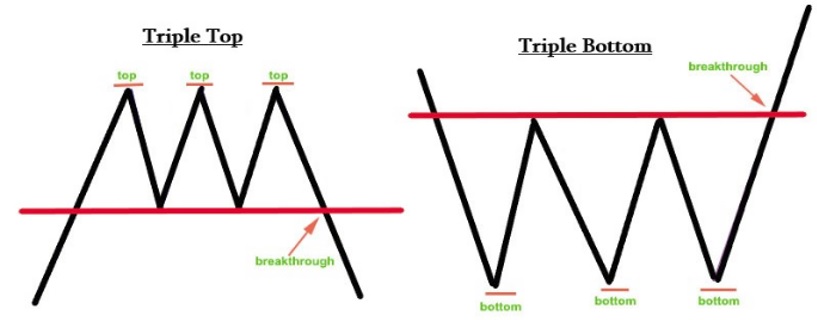
Besides pointing to the direction of the next price movements, it must be noted that this pattern has other significance. The resistances in Triple Tops and the supports in Triple Bottoms mark an important level due to the price's inability to pierce through that level.
Well, those are some unique patterns that might appear on your trading chart one day or in the next few minutes. Besides the patterns mentioned here, there are also other, rarer patterns, such as Cup and Handles, Flags, etc. Learning more about chart patterns and using them in chart observation could highly benefit your forex trading career. As such, you may want to check out the chart patterns ranked from the most reliable.


2 Comments
Reka
Apr 20 2024
It was mentioned that Double Tops represent a commonly recognized reversal pattern typically observed during an uptrend. This pattern suggests a weakening uptrend and anticipates a downward price movement once the pattern fully forms. Double Tops consist of two resistance levels at equal heights with a support level positioned between them. The pattern concludes when the price surpasses the second resistance and breaches the final support level.
A challenge arises in accurately identifying support and resistance levels. Are there specific methods or tools that aid in pinpointing these levels effectively, and can they be combined with Double Tops to enhance trading strategies?
Hans
Apr 24 2024